MNQ/NQ Risk Management ToolThis tool helps MNQ and NQ futures traders automatically calculate position size based on either a fixed dollar risk or a percentage of account balance.
Simply enter your stop loss level and choose whether to risk a set dollar amount or a percentage of your account. The script will display how many contracts to trade based on your setup.
Features:
Calculates contracts based on stop loss and risk size
Toggle between dollar-based or percent-of-account risk
Works with both MNQ ($2/point) and NQ ($20/point)
Automatically updates based on current price and direction (long or short)
Displays a clean info box on your chart with risk, contracts, and settings
This tool is ideal for intraday or swing traders who want to stay consistent with risk management across trades.
Indicators and strategies

LMAsLibrary "LMAs"
Credits
Thank you to @QuantraSystems for dynamic calculations.
Introduction
This lightweight library offers dynamic implementations of popular moving averages that adapt their length automatically as new bars are added to the chart.
Each function is built on a dynamic length formula:
len = math.min(maxLength, bar_index + 1)
This approach ensures that calculations begin as early as the first bar, allowing for smoother initialization and more consistent behavior across all timeframes. It’s especially useful in custom scripts that run from bar 0 or when historical data is limited.
Usage
You can use this library as a drop-in replacement for standard moving averages. It provides more flexibility and stability in live or backtesting environments where fixed-length indicators may delay or fail to initialize properly.
Why Use This?
• Works from the very first bar
• Avoids na values during early bars
• Great for real-time indicators, strategies, and bar-replay
• Clean and efficient code with dynamic behavior
How to Use
Import the library into your script and call any of the included functions just like you would with their native counterparts.
Summary
A lightweight Pine Script™ library offering dynamic moving averages that work seamlessly from the very first bar. Ideal for strategies and indicators requiring robust initialization and adaptive behavior.
SMA(sourceData, maxLength)
Dynamic SMA
Parameters:
sourceData (float)
maxLength (int)
EMA(src, length)
Dynamic EMA
Parameters:
src (float)
length (int)
DEMA(src, length)
Dynamic DEMA
Parameters:
src (float)
length (int)
TEMA(src, length)
Dynamic TEMA
Parameters:
src (float)
length (int)
WMA(src, length)
Dynamic WMA
Parameters:
src (float)
length (int)
HMA(src, length)
Dynamic HMA
Parameters:
src (float)
length (int)
VWMA(src, volsrc, length)
Dynamic VWMA
Parameters:
src (float)
volsrc (float)
length (int)
SMMA(src, length)
Dynamic SMMA
Parameters:
src (float)
length (int)
LSMA(src, length, offset)
Dynamic LSMA
Parameters:
src (float)
length (int)
offset (int)
RMA(src, length)
Dynamic RMA
Parameters:
src (float)
length (int)
ALMA(src, length, offset_sigma, sigma)
Dynamic ALMA
Parameters:
src (float)
length (int)
offset_sigma (float)
sigma (float)
ZLSMA(src, length)
Dynamic ZLSMA
Parameters:
src (float)
length (int)
FRAMA(src, length)
Parameters:
src (float)
length (int)
KAMA(src, length)
Dynamic KAMA
Parameters:
src (float)
length (int)
JMA(src, length, phase)
Dynamic JMA
Parameters:
src (float)
length (int)
phase (float)
T3(src, length, volumeFactor)
Dynamic T3
Parameters:
src (float)
length (int)
volumeFactor (float)

Candle Opens by HAZEDCandle Opens by HAZED
🎯 Overview
A clean, optimized indicator that displays key timeframe opening prices with enhanced performance and modern styling. Perfect for identifying critical support/resistance levels across multiple timeframes without chart clutter.
📈 Key Features
- 5 Major Timeframes: Daily, Weekly, Monthly, Quarterly, and Yearly opens
- Current Opens Only: No historical lookback - shows only the most recent/relevant levels
- Smart Positioning: Toggle between staggered lines (prevents overlap) or uniform length
- Dual Label Styles: Choose plain text (minimal) or enhanced labels with prices
- Performance Optimized: Streamlined code for faster loading and smoother operation
- Alert System: Get notified when any timeframe opens change
- Extended Hours Support: Works with pre/post market sessions
🎨 Customization Options
- Individual color selection for each timeframe
- Adjustable line width (1-4px)
- Right extension length control
- Optional left tail extensions
- Show/hide labels with style options
- Same length lines toggle for clean alignment
⚙️ Advanced Settings
- Discover Prices: Use chart data instead of HTF requests (for data feed discrepancies)
- Extended Hours: Display opens during pre/post market sessions
- Alert Controls: Enable/disable notifications for timeframe changes
📊 Default Configuration
- Enabled: Daily (Green), Weekly (Orange), Monthly (Red), Yearly (Blue)
- Disabled: Quarterly (Purple) - easily enabled if needed
- Labels: Enhanced style with prices shown by default
- Lines: 2px width, staggered positioning for optimal spacing
🚀 Performance Improvements
- Removed unnecessary historical data tracking
- Optimized drawing functions for better responsiveness
- Cleaner variable management and memory usage
- Enhanced yearly open detection algorithm
💡 Best Use Cases
- Swing trading: Identify key weekly/monthly levels
- Day trading: Respect daily opens as support/resistance
- Long-term investing: Monitor yearly opens for major trends
- Multi-timeframe analysis: See all key levels at once
🔧 Technical Notes
- Uses proper request.security() calls for accurate data
- Smart change detection prevents unnecessary redraws
- Handles different chart timeframes automatically
- Compatible with all asset classes and exchanges
Original concept enhanced and optimized by HAZED for modern trading needs.


Top-Center Range BoxTop-Center Range Box Indicator
This indicator calculates and displays:
The current bar’s range (High minus Low)
The average range over a specified number of previous bars
The percentage of the current range compared to that average
The result is shown in a floating label near the top of the chart.

Auto Trend Entry with SL/TP, Fake Signal & Sideways Filter🐂🐻 BULL and BEAR CHRONICLES by Lucifer
Author: Lucifer
Version: 1.0
Script Type: Overlay or Strategy (Specify which)
Tags: bullish, bearish, trend trading, market structure, Lucifer, price action, breakouts, EMA, MACD, support resistance
📖 Overview
BULL and BEAR CHRONICLES by Lucifer is more than just a trading script — it’s a real-time journal of the eternal battle between market bulls and bears. Designed to track, interpret, and visualize shifts in momentum, structure, and sentiment, this tool helps traders catch major trend transitions and avoid sideways traps.
Whether you're a trend follower, breakout trader, or simply seeking clarity in noisy markets, the Chronicles reveal which side currently holds the upper hand.
⚔️ Core Features
✅ Bull vs. Bear Detection
Based on EMA trend logic, MACD momentum, and price structure filters, such as Donchian Channels or Support/Resistance zones.
📊 Dynamic Candle & Background Coloring
Visually differentiate between bullish dominance, bearish pressure, and neutral zones.
🛡️ Sideways/Fake Signal Filter (if included)
Optional logic to block signals during choppy or low-momentum zones using slope or MACD compression.
🎯 Signal Highlights & Alerts (if applicable)
Get notified when clear breakouts or reversals occur.
🧠 How It Works
Bullish Momentum: Detected when price breaks structure, EMAs align upward, and MACD confirms momentum.
Bearish Momentum: Triggers when the trend reverses under structure with MACD confirmation.
Neutral Zone: Identified by consolidation ranges or weakening slope/momentum.
🧰 Customizable Inputs (If provided):
Donchian or lookback period
Fast/slow EMAs (e.g., 8/34)
MACD parameters
Sideways filter threshold
Volume spike or ATR filters (if included)
🧪 Best Use Cases
Swing trading in trending markets
Confirming trend reversals
Avoiding entries in choppy/no-volume zones
Visual learning and live market journaling
⚠️ Disclaimer
This tool is intended for educational and analytical purposes only. No indicator guarantees results. Use with sound risk management and test in simulation or paper trading environments before going live.

RSI Games 1.2he "RSI Games 1.2" indicator enhances the standard RSI by adding several layers of analysis:
Standard RSI Calculation: It calculates the RSI based on a configurable length (default 14 periods) and a user-selected source (default close price).
RSI Bands: It plots horizontal lines at 70 (red, overbought), 50 (yellow, neutral), and 30 (green, oversold) to easily identify extreme RSI levels.
RSI Smoothing with Moving Averages (MAs) and Bollinger Bands (BBs):
You can apply various types of moving averages (SMA, EMA, SMMA, WMA, VWMA) to smooth the RSI line.
If you choose "SMA + Bollinger Bands," the indicator will also plot Bollinger Bands around the smoothed RSI, providing dynamic overbought/oversold levels based on volatility.
The RSI line itself changes color based on whether it's above (green) or below (red) its smoothing MA.
It also fills the area between the RSI and its smoothing MA, coloring it green when RSI is above and red when below.
Bollinger Band Signals: When Bollinger Bands are enabled, the indicator marks "Buy" signals (green arrow up) when the RSI crosses above the lower Bollinger Band and "Sell" signals (red arrow down) when it crosses below the upper Bollinger Band.
Background Coloring: The background of the indicator pane changes to light green when RSI is below 30 (oversold) and light red when RSI is above 70 (overbought), visually highlighting extreme conditions.
Divergence Detection: This is a key feature. The indicator automatically identifies and labels:
Regular Bullish Divergence: Price makes a lower low, but RSI makes a higher low. This often signals a potential reversal to the upside.
Regular Bearish Divergence: Price makes a higher high, but RSI makes a lower high. This often signals a potential reversal to the downside.
Hidden Bullish Divergence: Price makes a higher low, but RSI makes a lower low. This can indicate a continuation of an uptrend.
Hidden Bearish Divergence: Price makes a lower high, but RSI makes a higher high. This can indicate a continuation of a downtrend.
Divergences are visually marked with labels and can trigger alerts.

EMAブレイク手法(エントリーポイント価格表示+アラート付き)This Pine Script is designed for 15-minute chart trading using EMA crossover breakouts.
It identifies bullish and bearish setups based on the relationship between the 12-period and 26-period EMAs, and plots entry points with price labels.

Customizable EMA 20/50/100/200It can be used on the EUR/GBP pairs to take trades on the 1-minute time frame, which is a moving average of 20, 50, 100, and 200. When the moving averages are in an upward direction and a correction occurs to touch the 20-period moving average, a trade is taken at a ratio of one to two.

Mera Mera - Ying Yang & Inside, OutsideMera Mera
It is a structure that traps the previous candle formed in the same direction.
When the structure is in the Buy direction, a blue dot is formed below it, when it is in the Sell direction, a red dot is formed above it.
Sell Mera Mera, Buy Mera Mera alerts are available.
Ying Yang
It is a structure that traps the next candle formed in the same process.
When the structure is in Buy transactions, a blue triangle is formed below it, when it is in Sell transactions, a red triangle is formed below it.
Ying Yang Sell, Ying Yang Buy alerts are available.
The calculation of inner bar and outer bar values is different.
After this formation, the candle fractal formations are followed and the transaction is searched.
The necessary visuals are in x
- Sorry if I have any mistakes
x.com
Copyright © 2025 @SimbiyotikTrader ;)

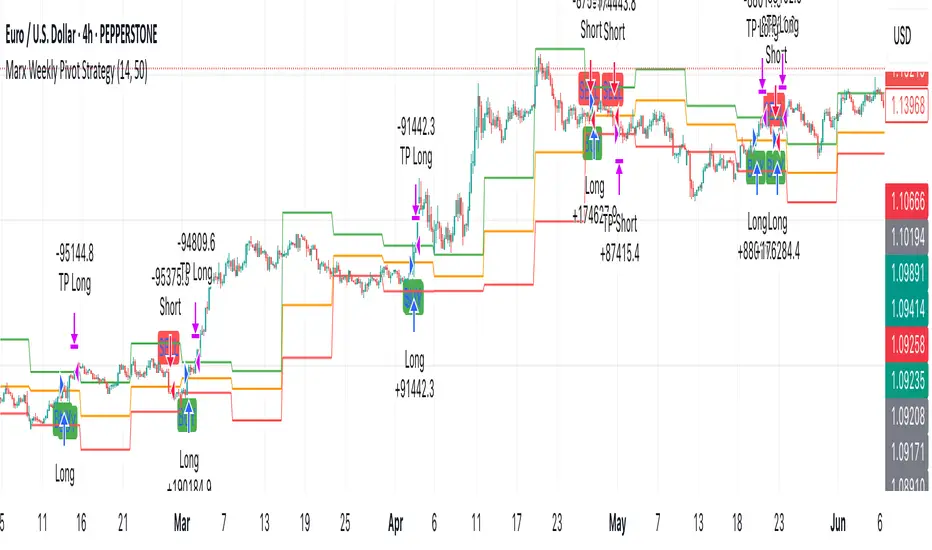
Marx Weekly Pivot StrategyMarx Weekly Pivot Strategy is a price action-based system that looks for high-probability reversals at key institutional levels — the weekly pivot point (PP). It’s designed to catch early-week moves with tight risk and strong reward potential.
⸻
How It Works
• Uses the previous week’s high, low, and close to calculate the weekly pivot (PP), R1, and S1.
• Enters long when price opens below PP but reclaims and closes above it, showing bullish reversal.
• Enters short when price opens above PP but breaks and closes below, indicating bearish reversal.
• Optional RSI confirmation helps filter false signals (default: RSI > 50 for longs, < 50 for shorts).
• Take Profit is set at R1 (for longs) or S1 (for shorts), with Stop Loss on the opposite side of the pivot.
⸻
🧠 Why It Works
Institutions and professional traders often use pivot points to identify high-volume reaction zones. This strategy taps into that order flow early in the week, aiming for high reward-to-risk setups when price retests and confirms these levels.
⸻
📊 Best Used On
• Liquid markets like EUR/USD, GBP/JPY, NAS100, XAU/USD
• Intraday timeframes like 15m or 1h
• Especially effective Monday to Wednesday
⸻
⚠️ Notes
• Avoid trading during high-impact news
• Backtest with your asset before live use
• Works best with additional trend filters for volatile markets
Canuck Trading Trader StrategyCanuck Trading Trader Strategy
Overview
The Canuck Trading Trader Strategy is a high-performance, trend-following trading system designed for NASDAQ:TSLA on a 15-minute timeframe. Optimized for precision and profitability, this strategy leverages short-term price trends to capture consistent gains while maintaining robust risk management. Ideal for traders seeking an automated, data-driven approach to trading Tesla’s volatile market, it delivers strong returns with controlled drawdowns.
Key Features
Trend-Based Entries: Identifies short-term trends using a 2-candle lookback period and a minimum trend strength of 0.2%, ensuring responsive trade signals.
Risk Management: Includes a configurable 3.0% stop-loss to cap losses and a 2.0% take-profit to lock in gains, balancing risk and reward.
High Precision: Utilizes bar magnification for accurate backtesting, reflecting realistic trade execution with 1-tick slippage and 0.1 commission.
Clean Interface: No on-chart indicators, providing a distraction-free trading experience focused on performance.
Flexible Sizing: Allocates 10% of equity per trade with support for up to 2 simultaneous positions (pyramiding).
Performance Highlights
Backtested from March 1, 2024, to June 20, 2025, on NASDAQ:TSLA (15-minute timeframe) with $1,000,000 initial capital:
Net Profit: $2,279,888.08 (227.99%)
Win Rate: 52.94% (3,039 winning trades out of 5,741)
Profit Factor: 3.495
Max Drawdown: 2.20%
Average Winning Trade: $1,050.91 (0.55%)
Average Losing Trade: $338.20 (0.18%)
Sharpe Ratio: 2.468
Note: Past performance is not indicative of future results. Always validate with your own backtesting and forward testing.
Usage Instructions
Setup:
Apply the strategy to a NASDAQ:TSLA 15-minute chart.
Ensure your TradingView account supports bar magnification for accurate results.
Configuration:
Lookback Candles: Default is 2 (recommended).
Min Trend Strength: Set to 0.2% for optimal trade frequency.
Stop Loss: Default 3.0% to cap losses.
Take Profit: Default 2.0% to secure gains.
Order Size: 10% of equity per trade.
Pyramiding: Allows up to 2 orders.
Commission: Set to 0.1.
Slippage: Set to 1 tick.
Enable "Recalculate After Order is Filled" and "Recalculate on Every Tick" in backtest settings.
Backtesting:
Run backtests over March 1, 2024, to June 20, 2025, to verify performance.
Adjust stop-loss (e.g., 2.5%) or take-profit (e.g., 1–3%) to suit your risk tolerance.
Live Trading:
Use with a compatible broker or TradingView alerts for automated execution.
Monitor execution for slippage or latency, especially given the high trade frequency (5,741 trades).
Validate in a demo account before deploying with real capital.
Risk Disclosure
Trading involves significant risk and may result in losses exceeding your initial capital. The Canuck Trading Trader Strategy is provided for educational and informational purposes only. Users are responsible for their own trading decisions and should conduct thorough testing before using in live markets. The strategy’s high trade frequency requires reliable execution infrastructure to minimize slippage and latency.

Previous Highs & Lows (Daily + Weekly)This indicator automatically plots the previous day's and previous week's high and low levels. These price points are commonly used by institutional traders as potential areas of support, resistance, or liquidity grabs.
🔧 How to Use
Previous Day High/Low: Use for intraday scalping or breakout setups.
Previous Week High/Low: Identify swing trade zones or key reaction areas.
Combine with price action (e.g., rejection candles or fakeouts) to spot smart money moves.
Enable/disable each level separately from settings.
Ideal for traders who rely on market structure, session levels, or liquidity theory.

Explosive Range Bar Highlighter🔥 Explosive Range Bar Highlighter
Description:
This indicator highlights bars that break out in volatility by exceeding 1.5× or 2.0× the ATR (Average True Range) — a clear signal of momentum ignition, institutional activity, or potential trap zones.
Each bar is dynamically colored based on:
✅ 1.5x ATR Up Bar
✅ 1.5x ATR Down Bar
✅ 2.0x ATR Up Bar
✅ 2.0x ATR Down Bar
You can fully customize the color for each type of explosive bar to suit your chart theme or personal preference.
🔔 Optional Sound Alerts:
Enable one-click sound alerts when any threshold is hit, helping you:
Catch breakout bars in real time
Track sudden volatility expansions
Stay alerted without watching every candle
🛠️ Settings:
ATR Period: Default 14, user adjustable
Color pickers for each bar type (1.5x/2x, up/down)
Toggle to enable/disable sound alerts
📈 Ideal For:
Scalpers watching for breakout acceleration
Swing traders identifying trend initiation
Institutional fade setups when range expands “too far, too fast”

Custom Market Time ZonesThis Indicator helps you wait for a trend to form after 30 minutes of NY market open.
After 1pm creates another zone indicating low probability

LUCY Multi-Timeframe Bias Checker//@version=5
indicator("LUCY Multi-Timeframe Bias Checker", overlay=true)
// === INPUTS === //
emaShort = input.int(8, title="Short EMA")
emaLong = input.int(34, title="Long EMA")
// === CURRENT TIMEFRAME === //
emaShort_curr = ta.ema(close, emaShort)
emaLong_curr = ta.ema(close, emaLong)
bias_curr = emaShort_curr > emaLong_curr ? "Bullish" : "Bearish"
// === HIGHER TIMEFRAMES === //
emaShort_5m = request.security(syminfo.tickerid, "5", ta.ema(close, emaShort))
emaLong_5m = request.security(syminfo.tickerid, "5", ta.ema(close, emaLong))
bias_5m = emaShort_5m > emaLong_5m ? "Bullish" : "Bearish"
emaShort_15m = request.security(syminfo.tickerid, "15", ta.ema(close, emaShort))
emaLong_15m = request.security(syminfo.tickerid, "15", ta.ema(close, emaLong))
bias_15m = emaShort_15m > emaLong_15m ? "Bullish" : "Bearish"
// === PANEL DISPLAY === //
var table biasTable = table.new(position.top_right, 2, 4, border_width=1)
if bar_index % 5 == 0
table.cell(biasTable, 0, 0, "Timeframe", bgcolor=color.black, text_color=color.white)
table.cell(biasTable, 1, 0, "Bias", bgcolor=color.black, text_color=color.white)
table.cell(biasTable, 0, 1, "1-Min", bgcolor=color.gray)
table.cell(biasTable, 1, 1, bias_curr, bgcolor=bias_curr == "Bullish" ? color.green : color.red, text_color=color.white)
table.cell(biasTable, 0, 2, "5-Min", bgcolor=color.gray)
table.cell(biasTable, 1, 2, bias_5m, bgcolor=bias_5m == "Bullish" ? color.green : color.red, text_color=color.white)
table.cell(biasTable, 0, 3, "15-Min", bgcolor=color.gray)
table.cell(biasTable, 1, 3, bias_15m, bgcolor=bias_15m == "Bullish" ? color.green : color.red, text_color=color.white)

LUCY Trend Analysis - MA, EMA, MACDBULL and BEAR CHRONICLES BY LUCIFER is a precision-crafted trend analysis tool that visually narrates the ongoing battle between bulls and bears using a fusion of classic indicators:
🔍 Core Logic:
This script detects trend direction by combining:
8 EMA vs 34 EMA – momentum crossover.
50 MA & 200 MA – broader trend context.
MACD Line vs Signal Line – momentum confirmation.
✅ Trend Conditions:
🟢 Bullish Trend:
8 EMA > 34 EMA
Price > 50 MA & 200 MA
MACD Line > Signal Line
🔴 Bearish Trend:
8 EMA < 34 EMA
Price < 50 MA & 200 MA
MACD Line < Signal Line
⚪ Sideways: When neither condition is fully met.
🎨 Visuals:
Trend labels: "Bullish", "Bearish", "Sideways"
Color-coded moving averages:
8 EMA (orange), 34 EMA (blue)
50 MA (green), 200 MA (red)
Background shading for clear visual cue:
Light green = Bullish
Light red = Bearish
🔔 Built-in Alerts:
Get notified instantly when a bullish, bearish, or sideways condition is triggered.
⚙️ Best For:
Swing Traders
Trend Followers
Strategy Builders are looking for multi-confirmation setups
🔥 Join the Chronicles. Ride with the bulls, run from the bears, or wait out the chaos — all with Lucifer's guidance.


均线Based on the pulu script used by Gogo, 4 SMA switches have been added for ease of use
基于果子哥使用的pulu脚本,增加了4个均线开关,方便使用

Global MA + Oscillator Score, Vol-Rank Filter and HA candlesOVERVIEW
This strategy goes long when TradingView’s global Technical-Rating score
(MA plus Oscillator composite) is strong and exits on weak scores or
volatility spikes. Scores are calculated on Heikin-Ashi candles for noise
reduction, but every order is executed on standard OHLC data, so back-tests
use real-candle prices.
KEY POINTS
• Uses the global Technical Rating because tests showed better risk-adjusted
returns than MA-only or Oscillator-only variants.
• Vol-Rank percentiles (Larry Williams VIX-Fix adaptation) block trades when
short-term volatility is in the top 20 % of the last 252 bars and allow
re-entry once it falls below 60 %.
• End-of-month Thursday profit-lock rule exits open winners just before
monthly option expiry.
• Works on any timeframe and any liquid symbol; defaults are tuned for QQQ
daily.
ENTRY AND EXIT
Long entry: globalRating ≥ +0.4
Soft exit: globalRating < −0.6
Hard exit: Vol-Rank ≥ 80 % or last-Thursday of the month rule
Re-entry: Same bar if Vol-Rank ≤ 60 % after last-thursday hard exit
INPUTS
symbol_correlation default QQQ (editable)
ratingThresholdIn +0.4
ratingThresholdOut −0.6
DEFAULT STRATEGY PROPERTIES
Initial capital default
Order size 5 % of equity
Pyramiding 1 order
Commission 0.05 % per trade
Slippage 5 ticks
Margin requirement long 100 %
Margin requirement short 100 %
Fill orders bar magnifier ON, on bar close, using standard OHLC
LIMITATIONS
• Heikin-Ashi smoothing delays signals; real-time fills can differ.
• Vol-Rank is derived from price, not true options IV Rank.
• Past results never guarantee future performance.
CREDITS
TradingView Technical Rating library v3
Larry Williams VIX-Fix concept (adapted)

Session Candles NY #ffsjr"The candle bodies tell the story, wicks do the damage" by ICT
Based on ICT words, I created the sessions indicator, to facilitate the visualization of each session in candle format, with the most important points being the confluence of session openings and closings.
Usually I use to create support and resistances lines using candle sessions bodies and to draw sessions liquidities.
Use on 15 minutes chart and hide default TradingView candles.
Enjoy

Soportes y Resistencias por Máximo Rebote con FiltroSupport and resistance lines are key strengths; they can be configured based on your needs or trading style, indicating levels of higher or lower risk.

Customizable Range Box📦 Customizable Range Box (with Dynamic Chart Placement)
Description:
The Customizable Range Box is a versatile tool for visualizing candle range dynamics directly on the chart, now positioned at the top of the visible price area for better readability and reduced clutter.
🔍 Features:
📊 Real-Time Range Analysis:
Displays the current candle’s range
Compares to the average range over a set lookback period
Shows ATR, 1.5× ATR, and 2× ATR thresholds for volatility context
🎯 Dynamic Chart-Top Label Positioning:
Automatically floats the label above the chart’s visible price range
Keeps the label unobstructed regardless of zoom or bar size
🎨 Customizable Appearance:
Toggle label position: Top, Middle, or Bottom of candle (if desired)
Choose left/right label alignment
Set label text size: Small → Huge
Customize text color and background box color
🛠️ Ideal Use Cases:
Spotting volatility spikes or compressed bars
Comparing candles to historical range behavior
Identifying bars likely to trigger breakouts or traps
Enhancing discretionary entries with quantified context
