Indicators and strategies

Custom Grid LinesThe Custom Grid Lines Indicator is a versatile tool designed for traders who want to manually define key price zones and visualize them with precision. This indicator allows users to select their own starting and ending price levels and automatically divides the range into user-defined grids using horizontal lines.
🔧 Key Features:
📍 User-Controlled Price Range:
Manually set the starting (bottom) and ending (top) price levels based on your trading plan, key zones, or market structure.
📊 Flexible Grid Setup:
Easily choose the number of grid lines to divide your selected range into equal price intervals.
📏 Automatic Grid Calculation:
The indicator calculates grid spacing and plots horizontal lines at each level, providing a clean and structured visual guide.
✅ Simple and Effective Visualization:
Ideal for grid trading, manual support/resistance plotting, or price zone tracking.
⚙️ How to Use:
Input the desired starting price (bottom of your range).
Input the ending price (top of your range).
Select the number of grids you want between these two levels.
The indicator will automatically draw all grid lines across your chart.
💡 Best For:
Grid Trading Strategies
Visualizing Custom Price Zones
Manual Support and Resistance Mapping
Session-Based Trading Ranges

Verticale 4H Candle Lijnen + Alarm4H candle opening time UTC+2.
Helps to know when 4H candles opens and closes.

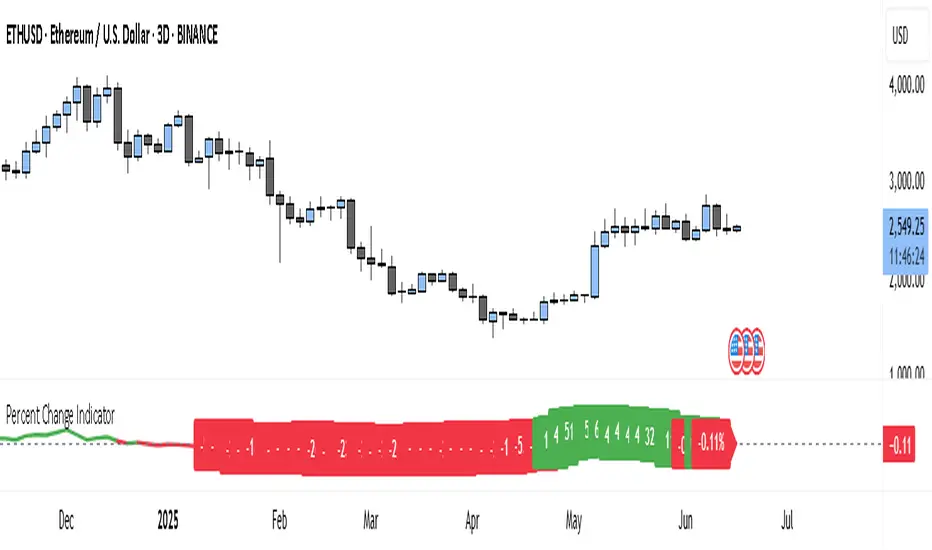
Percent Change IndicatorThe Percent Change Indicator helps you see how much the price of an asset has changed over a specific number of bars (or candles) on the chart. You get to decide how many bars to look back — for example, the last 10 candles. The indicator takes the current closing price and compares it to the closing price from 10 bars ago, then calculates the percentage difference between the two.
If the price has increased, the indicator shows a positive value and displays it in green. If the price has dropped, the value is negative and shown in red. A horizontal zero line helps you quickly see whether the market is gaining or losing value over the selected period.
On your chart, this indicator appears as a line that moves up or down with the price trend. It updates in real time and works on all timeframes — so whether you're trading on the 1-minute chart or analyzing the daily chart, it always tells you how much the price has changed over the number of bars you chose.
This tool is especially useful for spotting trends, measuring price momentum, or identifying when the market is starting to reverse direction.
candle open, current time [flasi]Displays the current time and candle open time on the chart in a customizable table.
Supports timezone and DST adjustments
Layout (stacked or side-by-side)
Personalized colors, labels, and text sizes
reupload

Time-CheckThis indicator highlights important time-based zones on the chart based on the Berlin time zone:
✅ Impulse Zones (Green Background): At every full hour (minute == 0), the market often shows strong directional movement. These periods are shaded in translucent green.
🔁 Reversal Zones (Orange Background): At 15, 30, and 45 minutes past each hour, price reversals are more likely. These are marked with translucent orange backgrounds.

Rejection Candle MarkerWhat it does:
Triangle down (🔻) marks bearish rejection (long upper wick).
Triangle up (🔺) marks bullish rejection (long lower wick).
No coloring or background highlighting — just neat triangle markers.

ICT Macros boxesThis indicator allows you to annotate 26 customizable time-based boxes according to your specified times.

Raana Price Band 1.1Detects Upper/Lower Circuit
✅ Shows UC/LC % and price in the top-right corner
✅ Uses clean syntax with all arguments on one line (no line continuation issues)
Note. NSE doesnt provide the data, we need to calculate manually.

Raana Price BandDetects Upper/Lower Circuit
✅ Shows UC/LC % and price in the top-right corner
✅ Uses clean syntax with all arguments on one line (no line continuation issues)

Simple Pips GridOverview
This is a clean, simple, and highly practical indicator that draws horizontal grid lines at user-defined pip intervals.
Unlike other complex grid indicators, this script is designed to be lightweight and error-free. It eliminates automatic symbol detection and instead gives you full manual control, ensuring it works perfectly with any symbol you trade—FX, CFDs, Crypto, Stocks, Indices, and more.
Key Features
Universal Compatibility: Works with any trading pair by letting you manually define the pip value.
Fully Customizable: Easily set the pip interval for your grid (e.g., 10 pips, 50 pips, 100 pips).
Lightweight & Fast: Simple code ensures smooth performance without lagging your chart.
Visual Customization: Change the color, width, and style (solid, dashed, dotted) of the grid lines.
How to Use
It's incredibly simple to set up. You only need to configure two main settings:
Step 1: Set the "Pip Value"
This is the most important setting. You need to tell the indicator what "1 pip" means for the symbol you are currently viewing.
Go to the indicator settings and find the "Pip Value" input. Here are some common examples:
Symbol Pip Value (Input this number)
USD/JPY 0.01
EUR/USD 0.0001
GBP/USD 0.0001
XAU/USD (Gold) 0.1
JP225 (Nikkei 225) 10
US500 (S&P 500) 1
BTC/USD 0.1 or 1.0 (depending on your preference)
Google スプレッドシートにエクスポート
Step 2: Set the "Pip Interval"
Next, in the "Pip Interval" input, simply type how many pips you want between each line.
For a 10-pip grid, enter 10.
For a 50-pip grid, enter 50.
That's it! The grid will now be perfectly aligned to your specifications.
Additional Settings
Line Color, Width, Style: Customize the appearance of the lines to match your chart theme.
Number of Lines: Adjust how many lines are drawn above and below the current price to optimize performance and visibility.
This script was created with the assistance of Gemini (Google's AI) to be a simple and reliable tool for all traders. Feel free to use and modify it. Happy trading!

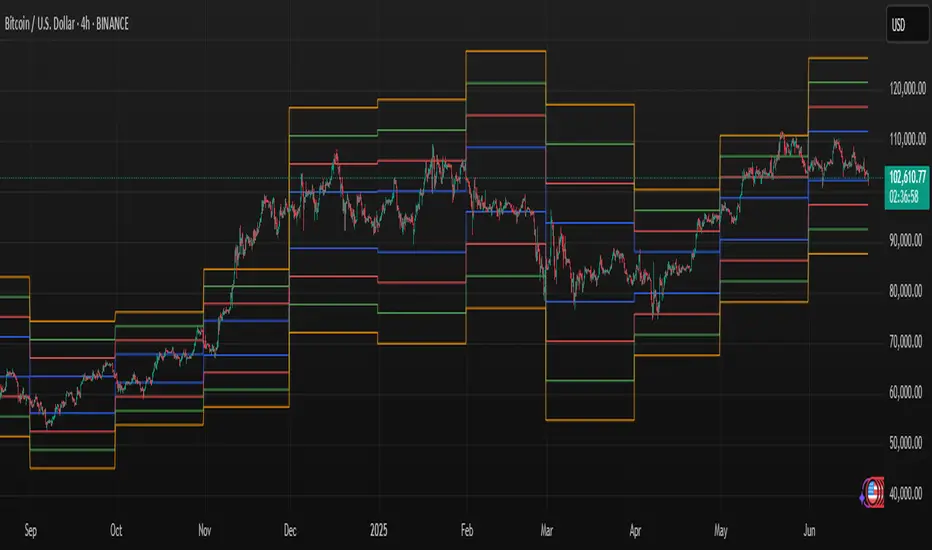
Volume Zones IndicatorVolume Zones Indicator — VWAP with Dynamic Monthly Volume Zones
This indicator is an enhanced version of the classic VWAP (Volume Weighted Average Price), designed to create clear monthly zones around VWAP based on average price range (ATR) and volume activity.
The core idea is to highlight key zones where price is more likely to reverse or consolidate, based on where significant trading volume occurs.
How does it work?
VWAP is calculated over the last N days (set by the lookbackPeriod input).
Four zones are plotted above and below VWAP, spaced using a multiple of ATR.
Each zone has its own color for clarity:
Blue — closest to VWAP
Red — second band
Green — third band
Orange — outer band (potential breakout or exhaustion zone)
If the current volume exceeds the moving average of volume, it is highlighted directly on the chart. This helps detect accumulation or distribution moments more easily.
What does the trader see?
You see horizontal colored bands on the chart that update at the start of each new month. These zones:
Remain fixed throughout the month
Automatically adjust based on recent volume and volatility
Act as dynamic support/resistance levels
Best used for:
Mean reversion strategies — identifying pullbacks toward value areas
Support and resistance mapping — automatic SR zones based on price/volume behavior
Breakout filtering — when price reaches zone 3 or 4, trend continuation or reversal is likely
Adding volume context to price action — works well with candlestick and pattern analysis
Settings
Lookback Period (Days): VWAP and volume smoothing length
Volume Area Threshold %: Reserved for future functionality
Works on any timeframe; best suited for 4H timeframe.
Zones are calculated and fixed monthly for clean visual context
Combines price structure with actual volume flow for more reliable decision-making
RSI + OBV + EMA + ADX FilterThis strategy combines multiple technical indicators to identify high-probability trade setups in trending markets:
🔹 RSI (Relative Strength Index)
Used to identify oversold (< 35) or overbought (> 70) conditions.
🔹 OBV (On-Balance Volume)
Confirms momentum direction through volume shifts.
🔹 EMA (Exponential Moving Average)
Filters trades to align only in the direction of the overall trend (optional).
🔹 ADX (Average Directional Index)
Filters out trades during low-volatility or sideways markets, only triggering when ADX exceeds a user-defined threshold.
🧠 Strategy Logic
Long Entry:
RSI < 35, OBV increasing, (optional: price above EMA), and ADX > threshold
Short Entry:
RSI > 70, OBV decreasing, (optional: price below EMA), and ADX > threshold
Plotting:
Green arrows for long signals
Red arrows for short signals
Optional debug plots (e.g. ADX pass as yellow circles)
⚙️ Parameters (User-Configurable)
RSI Length
EMA Length
ADX Length and Threshold
Enable/disable filters for RSI, OBV, EMA, and ADX

✅ SM/CENKER - Sniper Trend Filtered Entry v2🔫 SM/CENKER - Sniper Trend Filtered Entry v2
This script is a sniper entry tool combining EMA200 trend filter with a multi-confirmation system based on RSI, MACD, volume spikes, and candlestick patterns.
🚀 Features:
✅ EMA200 Trend Filter: Entries only in the trend direction
📈 RSI Breakouts: 30/70 level cross for early momentum confirmation
📊 MACD Crossovers: Momentum alignment with trend
🔊 Volume Spike Detection: Validates strong candles
🕯️ Candlestick Patterns: Detects Engulfing & Pin Bar setups
🎯 Minimum Score Filter: Filters out weak or noisy signals
🔔 Built-in Alerts for Long & Short signals
📱 Mobile-Friendly Labels: Adjustable label size
⏱️ Suggested Timeframes:
Optimized for 1M, 3M, 5M, and 15M charts.
Best suited for scalping and intraday trading.
⚠️ Disclaimer: This script is for educational and analytical purposes only. It does not constitute financial advice.

Share SizePurpose: The "Share Size" indicator is a powerful risk management tool designed to help traders quickly determine appropriate share/contract sizes based on their predefined risk per trade and the current market's volatility (measured by ATR). It calculates potential dollar differences from recent highs/lows and translates them into a recommended share/contract size, accounting for a user-defined ATR-based offset. This helps you maintain consistent risk exposure across different instruments and market conditions.
How It Works: At its core, the indicator aims to answer the question: "How many shares/contracts can I trade to keep my dollar risk within limits if my stop loss is placed at a recent high or low, plus an ATR-based buffer?"
Price Difference Calculation: It first calculates the dollar difference between the current close price and the high and low of the current bar (Now) and the previous 5 bars (1 to 5).
Tick Size & Value Conversion: These price differences are then converted into dollar values using the instrument's specific tickSize and tickValue. You can select common futures contracts (MNQ, MES, MGC, MCL), a generic "Stock" setting, or define custom values.
ATR Offset: An Average True Range (ATR) based offset is added to these dollar differences. This offset acts as a buffer, simulating a stop loss placed beyond the immediate high/low, accounting for market noise or volatility.
Risk-Based Share Size: Finally, using your Default Risk ($) input, the indicator calculates how many shares/contracts you can take for each of the 6 high/low scenarios (current bar, 5 previous bars) to ensure your dollar risk per trade remains constant.
Dynamic Table: All these calculations are presented in a clear, real-time table at the bottom-left of your chart. The table dynamically adjusts its "Label" to show the selected symbol preset, making it easy to see which instrument's settings are currently being used. The "Shares" rows indicate the maximum shares/contracts you can trade for a given risk and stop placement. The cells corresponding to the largest dollar difference (and thus smallest share size) for both high and low scenarios are highlighted, drawing your attention to the most conservative entry points.
Key Benefits:
Consistent Risk: Helps maintain a consistent dollar risk per trade, regardless of the instrument or its current price/volatility.
Dynamic Sizing: Automatically adjusts share/contract size based on market volatility and your chosen stop placement.
Quick Reference: Provides a real-time, easy-to-read table directly on your chart, eliminating manual calculations.
Informed Decision Making: Assists in quickly assessing trade opportunities and potential position sizes.
Setup Parameters (Inputs)
When you add the "Share Size" indicator to your chart, you'll see a settings dialog with the following parameters:
1. Symbol Preset:
Purpose: This is the primary setting to define the tick size and value for your chosen trading instrument.
Options:
MNQ (Micro Nasdaq 100 Futures)
MES (Micro E-mini S&P 500 Futures)
MGC (Micro Gold Futures)
MCL (Micro Crude Oil Futures)
Stock (Generic stock setting, with tick size/value of 0.01)
Custom (Allows you to manually input tick size and value)
Default: MNQ
Importance: Crucial for accurate dollar calculations. Ensure this matches the instrument you are trading.
2. Tick Size (Manual Override):
Purpose: Only used if Symbol Preset is set to Custom. This defines the smallest price increment for your instrument.
Type: Float
Default: 0.25
Hidden: This input is hidden (display=display.none) unless "Custom" is selected. You might need to change display=display.none to display=display.inline in the code if you want to see and adjust it directly in the settings for "Custom" mode.
3. Tick Value (Manual Override):
Purpose: Only used if Symbol Preset is set to Custom. This defines the dollar value of one tickSize increment.
Type: Float
Default: 0.50
Hidden: This input is hidden (display=display.none) unless "Custom" is selected. Similar to Tick Size, you might need to adjust its display property if you want it visible.
4. Default Risk ($):
Purpose: This is your maximum desired dollar risk per trade. All share size calculations will be based on this value.
Type: Float
Default: 50.0
Hidden: This input is hidden (display=display.none). It's a critical setting, so consider making it visible by changing display=display.none to display=display.inline in the code if you want users to easily adjust their risk.
ATR Offset Settings (Group): This group of settings allows you to fine-tune the ATR-based buffer added to your potential stop loss.
5. ATR Offset Length:
Purpose: Defines the lookback period for the Average True Range (ATR) calculation used for the offset.
Type: Integer
Default: 7
Hidden: This input is hidden (display=display.none).
6. ATR Offset Timeframe:
Purpose: Specifies the timeframe on which the ATR for the offset will be calculated. This allows you to use ATR from a higher timeframe for your stop buffer, even if your chart is on a lower timeframe.
Type: Timeframe string (e.g., "1" for 1 minute, "60" for 1 hour, "D" for Daily)
Default: "1" (1 Minute)
Hidden: This input is hidden (display=display.none).
7. ATR Offset Multiplier (x ATR):
Purpose: Multiplies the calculated ATR value to determine the final dollar offset added to your high/low price difference. A value of 1.0 means one full ATR is added. A value of 0.5 means half an ATR is added.
Type: Float
Minimum Value: 0 (no offset)
Default: 1.0
Hidden: This input is hidden (display=display.none).

SM/CENKER - Scalping Signal w/ Volume SpikeSM/CENKER - Scalping Signal with Volume Spike
This advanced scalping indicator combines MACD, RSI, EMA, VWAP, and volume spike detection to generate high-probability entry signals. It filters out low-quality setups by confirming entries only during volume surges.
🔍 Key Features:
✅ Volume Spike Filter: Signals are triggered only when volume exceeds 150% of the 20-bar average.
✅ Momentum Cross Confirmation: MACD crossover, RSI conditions, and price above/below EMA & VWAP are all required.
✅ Visual Background: Green or red background highlights BUY/SELL zones for quick decision-making.
✅ Clean Labels: Simple BUY/SELL labels are plotted on the chart.
✅ Optimized for Real-Time Scalping: Works effectively on 1M, 3M, 5M, and 15M charts.
📌 Recommended Timeframes & Settings:
Timeframe EMA RSI MACD Volume Spike Threshold
1 Minute 9 14 12-26-9 1.5x Avg Volume
3 Minute 9 14 12-26-9 1.5x Avg Volume
5 Minute 9 14 12-26-9 1.5x Avg Volume
15 Minute 9 14 12-26-9 1.5x Avg Volume
⚠️ Disclaimer: This script is for educational purposes only and does not constitute financial advice.

SM/CENKER - MACD + EMA 200 MTF Trend Panel📊 SM/CENKER - MACD + EMA 200 MTF Trend Panel
This advanced indicator combines the power of MACD momentum, EMA 200 trend filter, and volume confirmation to generate clean buy/sell signals, all while adapting to multi-timeframe (MTF) trend context.
🔍 Key Features:
✅ Multi-Timeframe EMA 200: Analyze higher timeframe trend while trading on your current chart.
📈 Buy/Sell Signals: Triggered only when MACD crossover aligns with the MTF trend direction and volume spike confirms the move.
🟢 Trend Coloring: EMA 200 line dynamically turns green in uptrend and red in downtrend.
🧭 Trend Panel: Top-right dashboard showing real-time trend direction and volume status.
📍 Minimalist Labels: Clean, modern BUY/SELL labels directly on the chart for easy spotting.
🕹️ Fully customizable font size and timeframe settings.
🚨 Ideal for traders looking for trend-following momentum entries with volume validation, and clean visual support.
⚠️ Disclaimer: This script is intended for educational purposes only and not for financial advice or commercial use.

GWAPGVWAP = Genesis Vwap. It is a very useful buy the dip indicator for IPO's that have come to market in the past few years, crypto, memecoins etc. The history gives this vwap more power and it always is placed at the beginning of any chart.

Trend-Following MA Crossover with MACD ConfirmationA simple strategy with MA crossover and MACD for confirmation


