Kalman Multi Timeframe TrendThe Kalman Multi Timeframe Trend uses a Kalman-filtered “fair value” line on two timeframes to map out trend structure and bias. Instead of relying on raw EMAs, it smooths price with a Kalman filter on both the chart timeframe (LTF) and a higher timeframe (HTF), then shows how price behaves relative to both.
When price trades above both Kalman lines, the market is in a strong, aligned bullish state. When it trades below both, it is in a strong, aligned bearish state. The indicator plots the LTF and HTF Kalman lines and draws a coloured cloud between them only when both are pointing in the same direction, visually highlighting high-conviction trend regimes.
Key points:
Kalman filter creates a smooth, adaptive fair value line on both LTF and HTF.
Bull cloud appears when price is above both Kalman lines (strong uptrend context).
Bear cloud appears when price is below both Kalman lines (strong downtrend context).
Great as a bias layer: trade in the direction of the active cloud, be cautious when no cloud is present.
Alerts fire when price first moves into a bull or bear Kalman Cloud regime.
Indicators and strategies

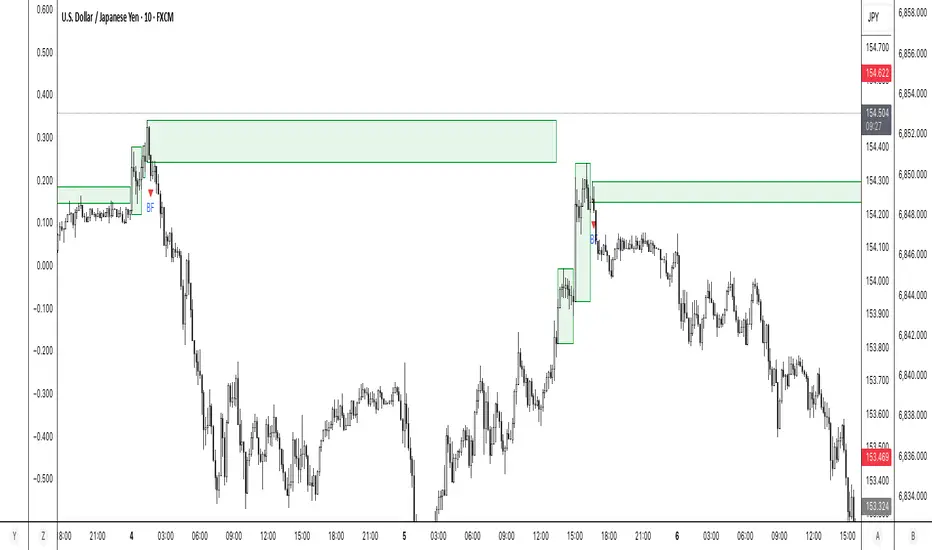
Target Reach & Trend ProjectionTarget Reach & Trend Projection
Overview: The Target Reach & Trend Projection indicator helps traders estimate how long (in candles) it might take for the price to reach a chosen target level, while also providing insight into the current and higher-timeframe trend directions.
Key Features
1. Target Projection: Set your custom Target Price manually.
The indicator calculates the expected number of candles needed to reach that price, based on recent price velocity.
Displays an estimated date and time for when the price could reach your target.
2. Trend Detection (Local): Detects the current market direction using one of two methods:
Linear Trend: Measures direct slope between candles.
Smoothed Trend: Uses a moving average slope for cleaner, less noisy trend estimation.
3. Higher-Timeframe Confirmation: Confirms whether the higher timeframe (e.g., 4H, 1D) trend agrees with the local trend.
Displays “✅ Aligned” when both are in sync and “⚠️ Diverging” when not.
4. On-Chart Information: A dynamic label near the target price line shows:
Target level
Trend method used
Estimated candles to target
Current trend direction
Estimated time of arrival (ETA)
Higher-timeframe trend confirmation
5. Visual Feedback: Background color changes lightly to reflect trend direction (green for bullish, red for bearish).
6. Alerts: Optional alerts for when:
The target price is reached.
Both local and higher-timeframe trends align bullishly or bearishly.
How It Works
The script measures the average price velocity (slope) over a chosen lookback period.
It then divides the distance between the current price and the target by that slope to estimate how many candles it might take to get there.
It projects the estimated time of arrival based on your chart’s current timeframe.
The script also checks a higher timeframe trend (using a moving average) for multi-timeframe confirmation.
🧭 Use Cases
Estimating the time horizon for swing trades or targets.
Confirming momentum direction before entering or exiting positions.
Aligning intraday setups with higher-timeframe trends.
⚠️ Notes
Estimates assume current trend velocity continues — it does not predict future volatility or reversals.
Works best on time-based charts with clear directional movement (e.g., 1H, 4H, 1D).

Trend Zone BreakoutsThe HD Trend Zone Breakouts indicator identifies when the market is trending strongly on both your chart timeframe and a higher timeframe, then tracks moments where price becomes stretched inside that trend. When this stretch occurs, the indicator builds a dynamic zone capturing the full high–low range during that extension. Once the stretch ends, the zone is frozen, and the script waits to see how price reacts to it. Breakouts above or below these zones signal whether the trend is likely to continue or fail. This creates a powerful structure-based way to time entries, exits, and reversals without relying on noisy overbought/oversold signals.
How It Works
Confirms trend direction on both lower and higher timeframes using an EMA-based regime.
Detects stretched conditions using RSI only when both timeframes are aligned.
Draws a price zone around candles formed during these extreme trend pushes.
Freezes the zone once the stretch ends, creating a reference area.
Monitors for breakouts above/below the zone to confirm trend continuation or trend failure.
Breakout Logic
Bull continuation → price breaks above the top of a bullish zone.
Bull failure → price breaks below the bottom of a bullish zone.
Bear continuation → price breaks below the bottom of a bearish zone.
Bear failure → price breaks above the top of a bearish zone.
Why It’s Useful
Distinguishes meaningful extensions from ordinary RSI signals.
Provides clear structural levels for timing trades.
Identifies trend continuation early and flags potential reversals.
Works extremely well alongside EMAC Forecast, Trend Exhaustion Lite, and Volatility Squeeze.
5m FVGs Lorem Ipsum is simply dummy text of the printing and typesetting industry. Lorem Ipsum has been the industry's standard dummy text ever since the 1500s, when an unknown printer took a galley of type and scrambled it to make a type specimen book. It has survived not only five centuries, but also the leap into electronic typesetting, remaining essentially unchanged. It was popularised in the 1960s with the release of Letraset sheets containing Lorem Ipsum passages, and more recently with desktop publishing software like Aldus PageMaker including versions of Lorem Ipsum.

OPPLIGER SMA Stufen-TP Strategie (200/100/50/25) mit Reentry✔️ 5.- transaction costs
✔️ 7% Stop-Loss
✔️ 3 Take-Profit SMA-levels
✔️ Reentry via SMA100 correction
✔️ Reentry via SMA25/SMA50 crossover
✔️ New REENTRY rule after Stop-Loss
→ only if SMA stack is bullish AND the 3rd & 4th candle after SL are above SMA25

Multi-TF Volatility Channel DashboardThis tool tracks where price sits inside a volatility channel on two timeframes at once and turns it into a simple trend state.
What it does
Builds a volatility channel around price using a midline and a volatility based band.
Converts the position of price inside that band into an oscillator that moves roughly between -100 and +100.
Calculates this oscillator on:
The current chart timeframe (LTF)
A selected higher timeframe (HTF)
From that it classifies each timeframe as:
Bull: oscillator above zero
Bear: oscillator below zero
Neutral: oscillator near zero
You can then see:
LTF oscillator line
HTF oscillator line
A small table showing LTF state, HTF state, and whether they are aligned
When both LTF and HTF are bullish or both are bearish, the background can highlight that period, and optional alerts fire.
How to use it
Trade in the direction of the higher timeframe when both lines agree.
Avoid taking counter trend trades when LTF and HTF are in strong but opposite states.
Use the LTF line for timing and the HTF line for directional bias.

TraderDemircan Trend Based Fibonacci + XABCD FormationDescription
TraderDemircan Trend-Based Fibonacci + XABCD Formation is an original open-source indicator that combines trend-based Fibonacci projections with an automated XABC structure detection engine.
The script focuses on identifying swing high → swing low transitions in a downtrend, generating Fibonacci levels and projecting a potential C-target extension based on harmonic geometry.
This indicator is designed for traders who want a clearer visual structure of how retracement, continuation, and harmonic projections interact inside trending markets.
🧩 What the Script Does
1. Detects the Most Recent X–A Swing (Trend High → Trend Low)
The indicator automatically scans a user-defined lookback range to identify:
X: Most recent significant swing high
A: The lowest low after X within the lookback window
This creates the foundational XA leg used for both Fibonacci levels and harmonic projections.
2. Determines a Dynamic B-Point Retracement
The script measures the market’s current retracement relative to the XA leg:
If price retraces below 0.50, B becomes the 0.50 level
If price retraces above 0.50, B becomes the 0.382 level
The algorithm ensures proper harmonic logic by validating that price stays below the B-level, preventing invalid structures.
3. Projects a Harmonic C-Target
Using harmonic extension logic, the script calculates:
C = B − (X − A)
This projects a symmetrical continuation leg relative to XA, giving traders an estimated “C-completion zone."
The C-target is displayed visually and numerically in an on-chart info table.
4. Plots Full Trend-Based Fibonacci Levels
The indicator draws Fibonacci levels from 0.0 to 2.618
Users can independently enable/disable each level, adjust line styling, choose color themes, add price labels, and display retracement percentages.
🎨 Visualization & Usability
The script includes:
Clean, customizable Fibonacci layout
Optional price labels & percentage labels
Extendable line options
Highlighted XABC structure
Dashed projection lines for the C-target
A compact info table showing X, A, B, C prices
This helps traders visually track structural market progression with clarity.
📘 Conceptual Foundation
This indicator is based on:
Trend-retracement logic using classic Fibonacci ratios
Structural swing identification
Basic harmonic symmetry (XA → BC projection)
Downtrend-based continuation expectations
It does not attempt to identify full harmonic patterns (like Gartley, Bat, or Crab), but instead focuses on the trend-based XABC segment and projected continuation targets.
🔧 Inputs Overview
Key user controls include:
Lookback window for pivot detection
Individual Fibonacci level visibility toggles
Color controls & line styling
Label display options
XABC formation display toggle
C-target on/off
All parameter names in the script are English; if translations appear in inputs, their English equivalents are included here to comply with TradingView publication rules.
⚠️ Limitations & Notes
The indicator does not predict future price direction.
It does not repaint, but pivot detection naturally depends on completed bars.
The C-projection is a geometric estimate, not a trading signal.
No forward-looking or non-causal data is used.
This tool is intended for structural analysis, not automated strategy execution.
📎 How to Use It
Add the indicator to a clean chart.
Observe the most recent X → A swing.
Watch how price interacts with 0.382 / 0.5 retracement to form the B-point.
Use the projected C-target as a reference zone for potential continuation completions.
Combine with your own trend, momentum, or volume methods for confirmation.
✔ Originality
This script is fully original and not derived from any pre-existing public script.
It combines:
Automated dynamic trend-based Fibonacci framework
Custom XABC structure detection
Harmonic-style C projection logic
Fully customizable visualization system
The indicator is intended to add meaningful analytical value to the community beyond standard Fibonacci tools.

First Historical Candle Date daily intervalIndicator that displays a first historical candle on daily interval as a table at a top-right corner

Emac ForecastEMAC Forecast System
What it measures
The EMAC Forecast measures the speed and persistence of trend movement. Instead of only looking at whether one EMA is above or below another, the forecast quantifies how quickly momentum is building or fading across multiple time horizons.
It captures three things at once:
The direction of the underlying trend
The rate at which the trend is strengthening or weakening
The consistency of that change across several smoothing speeds
This produces a forward leaning view of trend conditions, not a trailing confirmation.
How to read the forecast
The EMAC Forecast is displayed as a scaled oscillator, typically ranging between negative and positive values.
Positive forecast values
Indicate that bullish trend pressure is increasing.
Higher readings mean stronger acceleration, not just price rising.
Negative forecast values
Indicate increasing bearish pressure.
Again, the strength of the negative reading reflects how quickly selling momentum is building.
Rising forecast (slope up)
Shows improving momentum, even if the value is still below zero.
Useful for catching early reversals or transitions from chop to trend.
Falling forecast (slope down)
Shows momentum fading, even when trend direction has not flipped yet.
Helps anticipate exhaustions and pullbacks.
Flat forecast
Indicates low conviction and lack of directional drive.
Often corresponds to chop or range conditions.
Why the EMAC Forecast is different from a regular EMAC
A standard EMAC or EMA crossover follows a simple rule:
When fast EMA crosses above slow EMA, bullish.
When fast EMA crosses below slow EMA, bearish.
This is reactive and only changes after price has already moved.
The EMAC Forecast works differently:
1. Uses multiple EMAs rather than two
Instead of comparing one fast and one slow average, it blends several time constants into a composite signal.
This creates a smoother, more reliable directional read.
2. Measures acceleration, not just position
Traditional crossovers only monitor whether lines have crossed.
EMAC Forecast measures the speed and force behind the movement.
It tells you how strong the trend is becoming, not just whether one line is above the other.
3. Adapts to volatility
Sharp markets increase weighting of fast components.
Calm markets increase influence of slower components.
This reduces whipsaws in low-volatility conditions and improves responsiveness in high-volatility environments.
4. Gives actionable information before a crossover happens
The forecast often turns before the EMAC direction flips, allowing early detection of:
Trend ignition
Trend fade
Momentum squeezes
Impending reversals
It effectively “leans forward” into the trend instead of waiting for a full reversal.
Practical Use Cases
Early trend identification
When the forecast first turns positive or negative, trend acceleration is beginning.
This is often visible before the EMAC lines cross.
Confirming the Combined Forecast System
Use the EMAC Forecast to validate signals from your other forecast models.
If both agree, conviction is notably higher.
Filtering noise
Short-term whipsaws are reduced because the composite structure dilutes erratic fast movements.
Trend aging and exhaustion
A falling forecast during a positive trend suggests reduced conviction and potential exhaustion.

RSI (Custom Background) KDMThis code is a custom version of the RSI (Relative Strength Index) indicator.
Its main purpose is to compare recent price gains and losses to determine whether the market is in an overbought or oversold condition.
30–50 zone (purple tone): represents a weak or pullback area.
50–70 zone (green tone): represents a strengthening or dominant buying area.
Additionally, when the RSI line moves above 70, a green gradient background highlights the overbought region; when it moves below 30, a red gradient background emphasizes the oversold region.
Like the classic RSI, this version is a momentum indicator showing whether the price is losing or gaining strength.
The key difference is the colored background, which allows you to visually identify the RSI zones (e.g., 30–50 weak, 50–70 strong) much faster and more clearly.

Emac ML Adaptive CrossoverThe HDAlgos EMAC ML Adaptive Crossover is an adaptive trend reading and crossover system that uses a lightweight machine learning style scoring engine to detect regime shifts in the market. It blends multiple normalised technical features and automatically adjusts EMA lengths based on the detected market regime.
How it works
Feature Engine
The script computes several normalised indicators including RSI, ATR percentage, and Rate of Change. Each feature is converted into a z score so that the values behave consistently across different markets and timeframes. These feature values are then averaged to form a composite regime score.
Regime Detection
The composite score is compared to a dynamic upper and lower threshold. If the score rises above the upper boundary the regime becomes bullish. If the score falls below the lower boundary it becomes bearish. If it stays between the two boundaries the market is classified as neutral.
Adaptive EMAs
The fast and slow EMA lengths are automatically adjusted depending on the detected regime.
• In bullish regimes the fast and slow EMAs shorten.
• In bearish regimes they lengthen.
• In neutral regimes they revert to their base lengths.
This creates an EMA crossover system that responds to market volatility and directional strength rather than using fixed lookback values.
Crossovers
When the adaptive fast EMA crosses above the adaptive slow EMA, a bullish signal appears. When it crosses below, a bearish signal appears.
Visual Aids
• The fast EMA changes color to reflect the current regime.
• Candles can be optionally painted in regime colors.
• A label on the last bar shows the detected regime, score, and active EMA lengths.
• A compact table can be shown in the corner summarizing regime state and metrics.
Alerts
Alerts trigger when the regime changes, when a bullish adaptive crossover occurs, and when a bearish adaptive crossover occurs.
What it is designed for
This indicator is built for traders who want a crossover system that adapts to real market conditions instead of reacting to fixed length EMAs. It provides:
Smoother identification of trend phases
Dynamic sensitivity during strong conditions
Dampened reactions during noise and low conviction periods
Clear and simple signals that remain easy to interpret

GEX / Gamma - SPX Indicator Description – GEX / Gamma (SPX)
This indicator allows you to manually plot your daily +GEX, TRANS-GEX, and –GEX levels on SPX and visualize how price reacts around key gamma zones.
You enter the three levels each morning, and the script automatically draws:
+GEX / TRANS / –GEX zones with an adjustable buffer
Clean labels (e.g., “+GEX: 6850”) pinned to the right side of the chart
Today-only candle coloring (green above TRANS-GEX, red below)
Zones extend from yesterday’s session through the current session, helping highlight areas where dealer hedging flows may influence volatility, compression, or acceleration.
How to Use
Add the indicator to any intraday SPX chart.
Open settings and enter your +GEX, TRANS-GEX, and –GEX levels for the day.
Adjust the buffer, colors, and label style as needed.
Watch how price behaves as it moves above or below TRANS-GEX and interacts with +/- GEX zones.
Best For
Intraday SPX / ES / SPY
Options traders
Volatility and gamma-aware strategies
Strategy Behind It (Tight Version)
GEX levels help identify where dealer hedging flows can influence SPX price behavior.
+GEX (Positive Gamma)
Market tends to stabilize here. Dealers hedge against price moves, creating mean-reversion and lower volatility.
TRANS-GEX (Transition Level)
Key pivot where gamma flips. Price crossing this level often signals a shift in volatility or intraday direction.
–GEX (Negative Gamma)
Market becomes more reactive. Dealers hedge with price, increasing volatility, momentum, and trend potential.
How traders use it:
Expect resistance or slowdown into +GEX
Watch for potential bottoming or increased volatility –GEX
Use TRANS-GEX as a bias line or trigger for intraday shifts
A move outside of either the +GEX or -GEX will likely result in some type of high volume move.

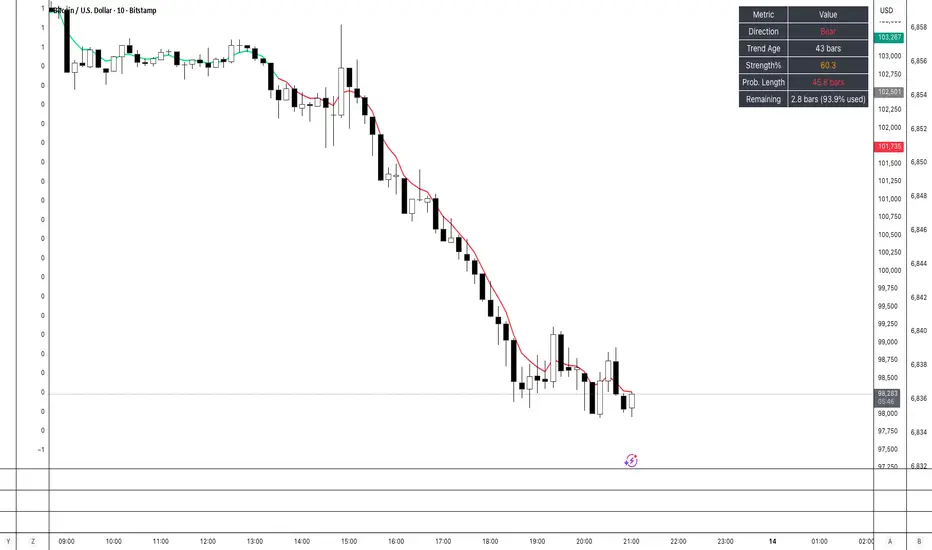
Trend Exhaustion liteThe Trend Exhaustion Lite tool tracks the age and strength of the current directional move to show how mature or extended a trend has become. It converts complex statistical analysis into a simple visual panel and colour-coded background.
How It Works
Once a directional bias is established, the indicator measures: Direction (Bullish / Bearish phase), Trend Age (Number of bars since the current trend began), and Strength % (Relative intensity of the move on a 0–100 scale). Background colour shifts subtly as strength increases or fades, while the table displays live metrics.
Use Cases
Younger trends (low age): Usually early in development — potential continuation
Aging trends (high age, declining strength): Often nearing exhaustion; tighten risk or prepare for rotation
Combine with the Forecast Paint Engine or Trend Regime Lite for confirmation on when conviction is building or fading
Interpretation Example
Example Output:
Panel reads Direction: Bull, Age: 47 bars, Strength: 68%
Meaning:
The uptrend remains statistically healthy but entering a later stage — manage exposure accordingly
SMA Stufen-TP Strategie (200/100/50/25) mit ReentryStrategy Description for TradingView: Multi-SMA Momentum & Reentry System
This Pine Script strategy, named "SMA Stufen-TP Strategie (200/100/50/25) mit Reentry," is a Long-Only trend-following system designed to capitalize on upward momentum and capture significant gains while incorporating sophisticated logic for reentry after corrections.
The system relies on four Simple Moving Averages (SMAs): SMA 200, SMA 100, SMA 50, and SMA 25. These indicators are used to define the trend structure, trigger entries, and set dynamic, layered Take-Profit (TP) levels.
Entry Rules
The strategy has one main entry and two specific reentry triggers:
Main Entry (Standard Trend): A long position is opened when the price crosses above the SMA 200. This acts as the initial signal for a strong, long-term uptrend.
Reentry 1 (Medium Correction): This reentry is sought after an official exit (Stop Loss or Take Profit). It is permitted if the SMA 100 is above the SMA 200 and two conditions are met: the price previously dipped below the SMA 100 during the correction, and it now closes two consecutive bars above the SMA 100. This targets a confirmed bounce within an overall bullish structure.
Reentry 2 (Deep Correction/Momentum Shift): This triggers during a deep correction where all shorter SMAs (100, 50, 25) are below the SMA 200. Reentry occurs when the SMA 25 crosses above the SMA 50, signaling a powerful short-term momentum shift that precedes a larger recovery.
Exit and Take-Profit Logic
Exits are governed by a prioritized system including a fixed Stop Loss and three dynamic Take-Profit stages.
A. Stop Loss (Highest Priority)
The primary risk control is a fixed Stop Loss at -10% below the entry price. This is always the first exit condition checked.
B. Layered Take-Profits (TP)
Profits are secured using a step-wise mechanism that trails the price using the shorter SMAs, but only after specific profit thresholds are met. This ensures that the strategy provides ample room for a strong rally while securing gains as the trend matures.
TP Stage 1: Activated when the price first crosses above the SMA 100. The position is closed if the profit reaches 10% or more and the price closes two consecutive bars below the SMA 100.
TP Stage 2: Activated when the price first crosses above the SMA 50. The position is closed if the profit reaches 20% or more and the price closes two consecutive bars below the SMA 50.
TP Stage 3: Activated when the price first crosses above the SMA 25. The position is closed if the profit reaches 40% or more and the price closes two consecutive bars below the SMA 25.
The exit priority ensures that the tightest active stop is used: Stop Loss takes precedence, followed by TP 3 (the highest profit and tightest trail), then TP 2, and finally TP 1.

Watermelon _cleanThis is updated newest chart, set buy and sell alerts same time frame as chart and for fastest response set it to one alert per bar

Range Oscillator Strategy + Stoch Confirm🔹 Short summary
This is a free, educational long-only strategy built on top of the public “Range Oscillator” by Zeiierman (used under CC BY-NC-SA 4.0), combined with a Stochastic timing filter, an EMA-based exit filter and an optional risk-management layer (SL/TP and R-multiple exits). It is NOT financial advice and it is NOT a magic money machine. It’s a structured framework to study how range-expansion + momentum + trend slope can be combined into one rule-based system, often with intentionally RARE trades.
────────────────────────
0. Legal / risk disclaimer
────────────────────────
• This script is FREE and public. I do not charge any fee for it.
• It is for EDUCATIONAL PURPOSES ONLY.
• It is NOT financial advice and does NOT guarantee profits.
• Backtest results can be very different from live results.
• Markets change over time; past performance is NOT indicative of future performance.
• You are fully responsible for your own trades and risk.
Please DO NOT use this script with money you cannot afford to lose. Always start in a demo / paper trading environment and make sure you understand what the logic does before you risk any capital.
────────────────────────
1. About default settings and risk (very important)
────────────────────────
The script is configured with the following defaults in the `strategy()` declaration:
• `initial_capital = 10000`
→ This is only an EXAMPLE account size.
• `default_qty_type = strategy.percent_of_equity`
• `default_qty_value = 100`
→ This means 100% of equity per trade in the default properties.
→ This is AGGRESSIVE and should be treated as a STRESS TEST of the logic, not as a realistic way to trade.
TradingView’s House Rules recommend risking only a small part of equity per trade (often 1–2%, max 5–10% in most cases). To align with these recommendations and to get more realistic backtest results, I STRONGLY RECOMMEND you to:
1. Open **Strategy Settings → Properties**.
2. Set:
• Order size: **Percent of equity**
• Order size (percent): e.g. **1–2%** per trade
3. Make sure **commission** and **slippage** match your own broker conditions.
• By default this script uses `commission_value = 0.1` (0.1%) and `slippage = 3`, which are reasonable example values for many crypto markets.
If you choose to run the strategy with 100% of equity per trade, please treat it ONLY as a stress-test of the logic. It is NOT a sustainable risk model for live trading.
────────────────────────
2. What this strategy tries to do (conceptual overview)
────────────────────────
This is a LONG-ONLY strategy designed to explore the combination of:
1. **Range Oscillator (Zeiierman-based)**
- Measures how far price has moved away from an adaptive mean.
- Uses an ATR-based range to normalize deviation.
- High positive oscillator values indicate strong price expansion away from the mean in a bullish direction.
2. **Stochastic as a timing filter**
- A classic Stochastic (%K and %D) is used.
- The logic requires %K to be below a user-defined level and then crossing above %D.
- This is intended to catch moments when momentum turns up again, rather than chasing every extreme.
3. **EMA Exit Filter (trend slope)**
- An EMA with configurable length (default 70) is calculated.
- The slope of the EMA is monitored: when the slope turns negative while in a long position, and the filter is enabled, it triggers an exit condition.
- This acts as a trend-protection exit: if the medium-term trend starts to weaken, the strategy exits even if the oscillator has not yet fully reverted.
4. **Optional risk-management layer**
- Percentage-based Stop Loss and Take Profit (SL/TP).
- Risk/Reward (R-multiple) exit based on the distance from entry to SL.
- Implemented as OCO orders that work *on top* of the logical exits.
The goal is not to create a “holy grail” system but to serve as a transparent, configurable framework for studying how these concepts behave together on different markets and timeframes.
────────────────────────
3. Components and how they work together
────────────────────────
(1) Range Oscillator (based on “Range Oscillator (Zeiierman)”)
• The script computes a weighted mean price and then measures how far price deviates from that mean.
• Deviation is normalized by an ATR-based range and expressed as an oscillator.
• When the oscillator is above the **entry threshold** (default 100), it signals a strong move away from the mean in the bullish direction.
• When it later drops below the **exit threshold** (default 30), it can trigger an exit (if enabled).
(2) Stochastic confirmation
• Classic Stochastic (%K and %D) is calculated.
• An entry requires:
- %K to be below a user-defined “Cross Level”, and
- then %K to cross above %D.
• This is a momentum confirmation: the strategy tries to enter when momentum turns up from a pullback rather than at any random point.
(3) EMA Exit Filter
• The EMA length is configurable via `emaLength` (default 70).
• The script monitors the EMA slope: it computes the relative change between the current EMA and the previous EMA.
• If the slope turns negative while the strategy holds a long position and the filter is enabled, it triggers an exit condition.
• This is meant to help protect profits or cut losses when the medium-term trend starts to roll over, even if the oscillator conditions are not (yet) signalling exit.
(4) Risk management (optional)
• Stop Loss (SL) and Take Profit (TP):
- Defined as percentages relative to average entry price.
- Both are disabled by default, but you can enable them in the Inputs.
• Risk/Reward Exit:
- Uses the distance from entry to SL to project a profit target at a configurable R-multiple.
- Also optional and disabled by default.
These exits are implemented as `strategy.exit()` OCO orders and can close trades independently of oscillator/EMA conditions if hit first.
────────────────────────
4. Entry & Exit logic (high level)
────────────────────────
A) Time filter
• You can choose a **Start Year** in the Inputs.
• Only candles between the selected start date and 31 Dec 2069 are used for backtesting (`timeCondition`).
• This prevents accidental use of tiny cherry-picked windows and makes tests more honest.
B) Entry condition (long-only)
A long entry is allowed when ALL the following are true:
1. `timeCondition` is true (inside the backtest window).
2. If `useOscEntry` is true:
- Range Oscillator value must be above `entryLevel`.
3. If `useStochEntry` is true:
- Stochastic condition (`stochCondition`) must be true:
- %K < `crossLevel`, then %K crosses above %D.
If these filters agree, the strategy calls `strategy.entry("Long", strategy.long)`.
C) Exit condition (logical exits)
A position can be closed when:
1. `timeCondition` is true AND a long position is open, AND
2. At least one of the following is true:
- If `useOscExit` is true: Oscillator is below `exitLevel`.
- If `useMagicExit` (EMA Exit Filter) is true: EMA slope is negative (`isDown = true`).
In that case, `strategy.close("Long")` is called.
D) Risk-management exits
While a position is open:
• If SL or TP is enabled:
- `strategy.exit("Long Risk", ...)` places an OCO stop/limit order based on the SL/TP percentages.
• If Risk/Reward exit is enabled:
- `strategy.exit("RR Exit", ...)` places an OCO order using a projected R-multiple (`rrMult`) of the SL distance.
These risk-based exits can trigger before the logical oscillator/EMA exits if price hits those levels.
────────────────────────
5. Recommended backtest configuration (to avoid misleading results)
────────────────────────
To align with TradingView House Rules and avoid misleading backtests:
1. **Initial capital**
- 10 000 (or any value you personally want to work with).
2. **Order size**
- Type: **Percent of equity**
- Size: **1–2%** per trade is a reasonable starting point.
- Avoid risking more than 5–10% per trade if you want results that could be sustainable in practice.
3. **Commission & slippage**
- Commission: around 0.1% if that matches your broker.
- Slippage: a few ticks (e.g. 3) to account for real fills.
4. **Timeframe & markets**
- Volatile symbols (e.g. crypto like BTCUSDT, or major indices).
- Timeframes: 1H / 4H / **1D (Daily)** are typical starting points.
- I strongly recommend trying the strategy on **different timeframes**, for example 1D, to see how the behaviour changes between intraday and higher timeframes.
5. **No “caution warning”**
- Make sure your chosen symbol + timeframe + settings do not trigger TradingView’s caution messages.
- If you see warnings (e.g. “too few trades”), adjust timeframe/symbol or the backtest period.
────────────────────────
5a. About low trade count and rare signals
────────────────────────
This strategy is intentionally designed to trade RARELY:
• It is **long-only**.
• It uses strict filters (Range Oscillator threshold + Stochastic confirmation + optional EMA Exit Filter).
• On higher timeframes (especially **1D / Daily**) this can result in a **low total number of trades**, sometimes WELL BELOW 100 trades over the whole backtest.
TradingView’s House Rules mention 100+ trades as a guideline for more robust statistics. In this specific case:
• The **low trade count is a conscious design choice**, not an attempt to cherry-pick a tiny, ultra-profitable window.
• The goal is to study a **small number of high-conviction long entries** on higher timeframes, not to generate frequent intraday signals.
• Because of the low trade count, results should NOT be interpreted as statistically strong or “proven” – they are only one sample of how this logic would have behaved on past data.
Please keep this in mind when you look at the equity curve and performance metrics. A beautiful curve with only a handful of trades is still just a small sample.
────────────────────────
6. How to use this strategy (step-by-step)
────────────────────────
1. Add the script to your chart.
2. Open the **Inputs** tab:
- Set the backtest start year.
- Decide whether to use Oscillator-based entry/exit, Stochastic confirmation, and EMA Exit Filter.
- Optionally enable SL, TP, and Risk/Reward exits.
3. Open the **Properties** tab:
- Set a realistic account size if you want.
- Set order size to a realistic % of equity (e.g. 1–2%).
- Confirm that commission and slippage are realistic for your broker.
4. Run the backtest:
- Look at Net Profit, Max Drawdown, number of trades, and equity curve.
- Remember that a low trade count means the statistics are not very strong.
5. Experiment:
- Tweak thresholds (`entryLevel`, `exitLevel`), Stochastic settings, EMA length, and risk params.
- See how the metrics and trade frequency change.
6. Forward-test:
- Before using any idea in live trading, forward-test on a demo account and observe behaviour in real time.
────────────────────────
7. Originality and usefulness (why this is more than a mashup)
────────────────────────
This script is not intended to be a random visual mashup of indicators. It is designed as a coherent, testable strategy with clear roles for each component:
• Range Oscillator:
- Handles mean vs. range-expansion states via an adaptive, ATR-normalized metric.
• Stochastic:
- Acts as a timing filter to avoid entering purely on extremes and instead waits for momentum to turn.
• EMA Exit Filter:
- Trend-slope-based safety net to exit when the medium-term direction changes against the position.
• Risk module:
- Provides practical, rule-based exits: SL, TP, and R-multiple exit, which are useful for structuring risk even if you modify the core logic.
It aims to give traders a ready-made **framework to study and modify**, not a black box or “signals” product.
────────────────────────
8. Limitations and good practices
────────────────────────
• No single strategy works on all markets or in all regimes.
• This script is long-only; it does not short the market.
• Performance can degrade when market structure changes.
• Overfitting (curve fitting) is a real risk if you endlessly tweak parameters to maximise historical profit.
Good practices:
- Test on multiple symbols and timeframes.
- Focus on stability and drawdown, not only on how high the profit line goes.
- View this as a learning tool and a basis for your own research.
────────────────────────
9. Licensing and credits
────────────────────────
• Core oscillator idea & base code:
- “Range Oscillator (Zeiierman)”
- © Zeiierman, licensed under CC BY-NC-SA 4.0.
• Strategy logic, Stochastic confirmation, EMA Exit Filter, and risk-management layer:
- Modifications by jokiniemi.
Please respect both the original license and TradingView House Rules if you fork or republish any part of this script.
────────────────────────
10. No payments / no vendor pitch
────────────────────────
• This script is completely FREE to use on TradingView.
• There is no paid subscription, no external payment link, and no private signals group attached to it.
• If you have questions, please use TradingView’s comment system or private messages instead of expecting financial advice.
Use this script as a tool to learn, experiment, and build your own understanding of markets.
────────────────────────
11. Example backtest settings used in screenshots
────────────────────────
To avoid any confusion about how the results shown in screenshots were produced, here is one concrete example configuration:
• Symbol: BTCUSDT (or similar major BTC pair)
• Timeframe: 1D (Daily)
• Backtest period: from 2018 to the most recent data
• Initial capital: 10 000
• Order size type: Percent of equity
• Order size: 2% per trade
• Commission: 0.1%
• Slippage: 3 ticks
• Risk settings: Stop Loss and Take Profit disabled by default, Risk/Reward exit disabled by default
• Filters: Range Oscillator entry/exit enabled, Stochastic confirmation enabled, EMA Exit Filter enabled
If you change any of these settings (symbol, timeframe, risk per trade, commission, slippage, filters, etc.), your results will look different. Please always adapt the configuration to your own risk tolerance, market, and trading style.

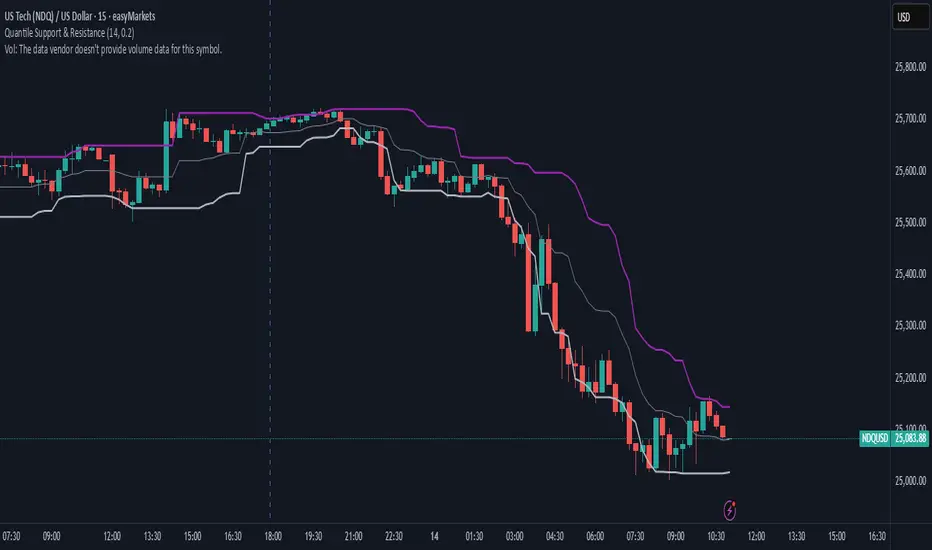
Quantile Support & ResistanceThis indicator plots dynamic support and resistance zones based on quantile logic — a statistically grounded method for identifying structural price boundaries.
Support Level: The price below which only a small percentage of lows fall (default: 10%). This approximates a strong demand zone.
Resistance Level: The price above which only a small percentage of highs rise (default: 10%). This approximates a strong supply zone.
Volatility-Adaptive: Levels adjust automatically to changing market conditions using a configurable lookback window.
Quantile Interpolation: Uses sorted price data and fractional indexing to estimate percentile thresholds with precision.
This tool is ideal for traders who want to visualize statistically significant price zones without relying on subjective drawing or fixed levels. It pairs well with breakout strategies, retest logic, and compression overlays.
Swing Trade BUY/SELL + SCORING +COLOUR FIXBUY/SELL labels now appear with a score (1–3) next to them.
Color coding visually distinguishes signal strength:
BUY → 1 yellow, 2 light green, 3 dark green
SELL → 1 orange, 2 red, 3 burgundy
This allows you to instantly see the signal strength both numerically and visually.

TraderDemircan Auto Fibonacci RetracementDescription:
What This Indicator Does:This indicator automatically identifies significant swing high and swing low points within a customizable lookback period and draws comprehensive Fibonacci retracement and extension levels between them. Unlike the manual Fibonacci tool that requires you to constantly redraw levels as price action evolves, this automated version continuously updates the Fibonacci grid based on the most recent major swing points, ensuring you always have current and relevant support/resistance zones displayed on your chart.Key Features:
Automatic Swing Detection: Continuously scans the specified lookback period to find the most significant high and low points, eliminating manual drawing errors
Comprehensive Level Coverage: Plots 16 Fibonacci levels including 7 retracement levels (0.0 to 1.0) and 9 extension levels (1.115 to 3.618)
Top-Down Methodology: Draws from swing high to swing low (right-to-left), following the traditional Fibonacci retracement convention where 100% is at the top
Dual Labeling System: Shows both exact price values and Fibonacci percentages for easy reference
Complete Customization: Individual toggle controls and color selection for each of the 16 levels
Flexible Display Options: Adjust line thickness (1-5), style (solid/dashed/dotted), and extension direction (left/right/both)
Visual Swing Markers: Red diamond at the swing high (starting point) and green diamond at the swing low (ending point)
Optional Trend Line: Connects the two swing points to visualize the overall price movement direction
How It Works:The indicator employs a sophisticated swing point detection algorithm that operates in two stages:Stage 1 - Find the Swing Low (Support Base):
Scans the entire lookback period to identify the lowest low, which becomes the anchor point (0.0 level in traditional retracement terms, though displayed at the bottom of the grid).Stage 2 - Find the Swing High (Resistance Peak):
After identifying the swing low, searches for the highest high that occurred after that low point, establishing the swing range. This creates a valid price movement range for Fibonacci analysis.Fibonacci Calculation Method:
The indicator uses the top-down approach where:
1.0 Level = Swing High (100% retracement, the top)
0.0 Level = Swing Low (0% retracement, the bottom)
Retracement Levels (0.236 to 0.786) = Potential support zones during pullbacks from the high
Extension Levels (1.115 to 3.618) = Potential target zones below the swing low
Formula: Price = SwingHigh - (SwingHigh - SwingLow) × FibonacciLevelThis ensures that 0.0 is at the bottom and extensions (>1.0) plot below the swing low, following standard Fibonacci retracement convention.Fibonacci Levels Explained:Retracement Levels (0.0 - 1.0):
0.0 (Gray): Swing low - the base support level
0.236 (Red): Shallow retracement, first minor support
0.382 (Orange): Moderate retracement, commonly watched support
0.5 (Purple): Psychological midpoint, significant support/resistance
0.618 (Blue - Golden Ratio): The most important retracement level, high-probability reversal zone
0.786 (Cyan): Deep retracement, last defense before full reversal
1.0 (Gray): Swing high - the initial resistance level
Extension Levels (1.115 - 3.618):
1.115 (Green): First extension, minimal downside target
1.272 (Light Green): Minor extension, common profit target
1.414 (Yellow-Green): Square root of 2, mathematical significance
1.618 (Gold - Golden Extension): Primary downside target, most watched extension level
2.0 (Orange-Red): 200% extension, psychological round number
2.382 (Pink): Secondary extension target
2.618 (Purple): Deep extension, major target zone
3.272 (Deep Purple): Extreme extension level
3.618 (Blue): Maximum extension, rare but powerful target
How to Use:For Retracement Trading (Buying Pullbacks in Uptrends):
Wait for price to make a significant move up from swing low to swing high
When price starts pulling back, watch for reactions at key Fibonacci levels
Most common entry zones: 0.382, 0.5, and especially 0.618 (golden ratio)
Enter long positions when price shows reversal signals (candlestick patterns, volume increase) at these levels
Place stop loss below the next Fibonacci level
Target: Return to swing high or higher extension levels
For Extension Trading (Profit Targets):
After price breaks below the swing low (0.0 level), use extensions as profit targets
First target: 1.272 (conservative)
Primary target: 1.618 (golden extension - most commonly reached)
Extended target: 2.618 (for strong trends)
Extreme target: 3.618 (only in powerful trending moves)
For Counter-Trend Trading (Fading Extremes):
When price reaches deep retracements (0.786 or below), look for exhaustion signals
Watch for divergences between price and momentum indicators at these levels
Enter reversal trades with tight stops below the swing low
Target: 0.5 or 0.382 levels on the bounce
For Trend Continuation:
In strong uptrends, shallow retracements (0.236 to 0.382) often hold
Use these as low-risk entry points to join the existing trend
Failure to hold 0.5 suggests weakening momentum
Breaking below 0.618 often indicates trend reversal, not just retracement
Multi-Timeframe Strategy:
Use daily timeframe Fibonacci for major support/resistance zones
Use 4H or 1H Fibonacci for precise entry timing within those zones
Confluence between multiple timeframe Fibonacci levels creates high-probability zones
Example: Daily 0.618 level aligning with 4H 0.5 level = strong support
Settings Guide:Lookback Period (10-500):
Short (20-50): Captures recent swings, more frequent updates, suited for day trading
Medium (50-150): Balanced approach, good for swing trading (default: 100)
Long (150-500): Identifies major market structure, suited for position trading
Higher values = more stable levels but slower to adapt to new trends
Pivot Sensitivity (1-20):
Controls how many candles are required to confirm a swing point
Low (1-5): More sensitive, identifies minor swings (default: 5)
High (10-20): Less sensitive, only major swings qualify
Use higher sensitivity on lower timeframes to filter noise
Individual Level Toggles:
Enable only the levels you actively trade to reduce chart clutter
Common minimalist setup: Show only 0.382, 0.5, 0.618, 1.0, 1.618, 2.618
Comprehensive setup: Enable all levels for maximum information
Visual Customization:
Line Thickness: Thicker lines (3-5) for presentation, thinner (1-2) for trading
Line Style: Solid for primary levels (0.5, 0.618, 1.618), dashed/dotted for secondary
Price Labels: Essential for knowing exact entry/exit prices
Percent Labels: Helpful for quickly identifying which Fibonacci level you're looking at
Extension Direction: Extend right for forward-looking analysis, left for historical context
What Makes This Original:While Fibonacci indicators are common on TradingView, this script's originality comes from:
Intelligent Two-Stage Detection: Unlike simple high/low finders, this uses a sequential approach (find low first, then find the high that occurred after it), ensuring logical price flow representation
Comprehensive Level Set: Includes 16 levels spanning from retracement to extreme extensions, more than most Fibonacci tools
Top-Down Methodology: Properly implements the traditional Fibonacci retracement convention (high to low) rather than the reverse
Automatic Range Validation: Only draws Fibonacci when both swing points are valid and in the correct temporal order
Dual Extension Options: Separate controls for extending lines left (historical context) and right (forward projection)
Smart Label Positioning: Places percentage labels on the left and price labels on the right for clarity
Visual Swing Confirmation: Diamond markers at swing points help users understand why levels are positioned where they are
Important Considerations:
Historical Nature: Fibonacci retracements are based on past price swings; they don't predict future moves, only suggest potential support/resistance
Self-Fulfilling Prophecy: Fibonacci levels work partly because many traders watch them, creating actual support/resistance at those levels
Not All Levels Hold: In strong trends, price may slice through multiple Fibonacci levels without pausing
Context Matters: Fibonacci works best when aligned with other support/resistance (previous highs/lows, moving averages, trendlines)
Volume Confirmation: The most reliable Fibonacci reversals occur with volume spikes at key levels
Dynamic Updates: The levels will redraw as new swing highs/lows form, so don't rely solely on static screenshots
Best Practices:
Don't Trade Blindly: Fibonacci levels are zones, not exact prices. Look for confirmation (candlestick patterns, indicators, volume)
Combine with Price Action: Watch for pin bars, engulfing candles, or doji at key Fibonacci levels
Use Stop Losses: Place stops beyond the next Fibonacci level to give trades room but limit risk
Scale In/Out: Consider entering partial positions at 0.5 and adding more at 0.618 rather than all-in at one level
Check Multiple Timeframes: Daily Fibonacci + 4H Fibonacci convergence = high-probability zone
Respect the 0.618: This golden ratio level is historically the most reliable for reversals
Extensions Need Strong Trends: Don't expect extensions to be hit unless there's clear momentum beyond the swing low
Optimal Timeframes:
Scalping (1-5 minutes): Lookback 20-30, watch 0.382, 0.5, 0.618 only
Day Trading (15m-1H): Lookback 50-100, all retracement levels important
Swing Trading (4H-Daily): Lookback 100-200, focus on 0.5, 0.618, 0.786, and extensions
Position Trading (Daily-Weekly): Lookback 200-500, all levels relevant for long-term planning
Common Fibonacci Trading Mistakes to Avoid:
Wrong Swing Selection: Choosing insignificant swings produces meaningless levels
Premature Entry: Entering as soon as price touches a Fibonacci level without confirmation
Ignoring Trend: Fighting the main trend by buying deep retracements in downtrends
Over-Reliance: Using Fibonacci in isolation without confirming with other technical factors
Static Analysis: Not updating your Fibonacci as market structure evolves
Arbitrary Lookback: Using the same lookback period for all assets and timeframes
Integration with Other Tools:Fibonacci + Moving Averages:
When 0.618 level aligns with 50 or 200 EMA, confluence creates stronger support
Price bouncing from both Fibonacci and MA simultaneously = high-probability trade
Fibonacci + RSI/Stochastic:
Oversold indicators at 0.618 or deeper retracements = strong buy signal
Overbought indicators at swing high (1.0) = potential reversal warning
Fibonacci + Volume Profile:
High-volume nodes aligning with Fibonacci levels create robust support/resistance
Low-volume areas near Fibonacci levels may see rapid price movement through them
Fibonacci + Trendlines:
Fibonacci retracement level + ascending trendline = double support
Breaking both simultaneously confirms trend change
Technical Notes:
Uses ta.lowest() and ta.highest() for efficient swing detection across the lookback period
Implements dynamic line and label arrays for clean redraws without memory leaks
All calculations update in real-time as new bars form
Extension options allow customization without modifying core code
Format.mintick ensures price labels match the symbol's minimum price increment
Tooltip on swing markers shows exact price values for precision

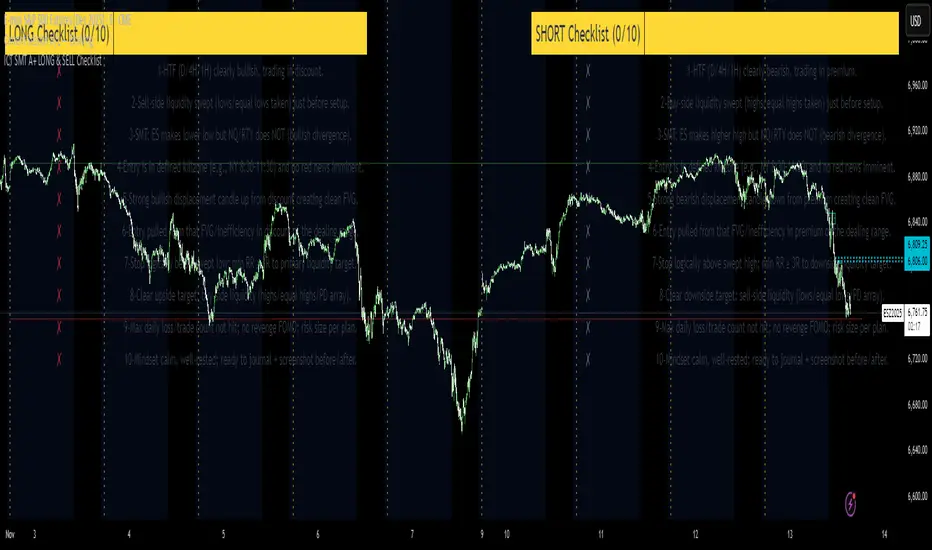
ICT SMT A+ LONG & SELL ChecklistTrade Checklist. Once all items checked color changes from yellow to green.
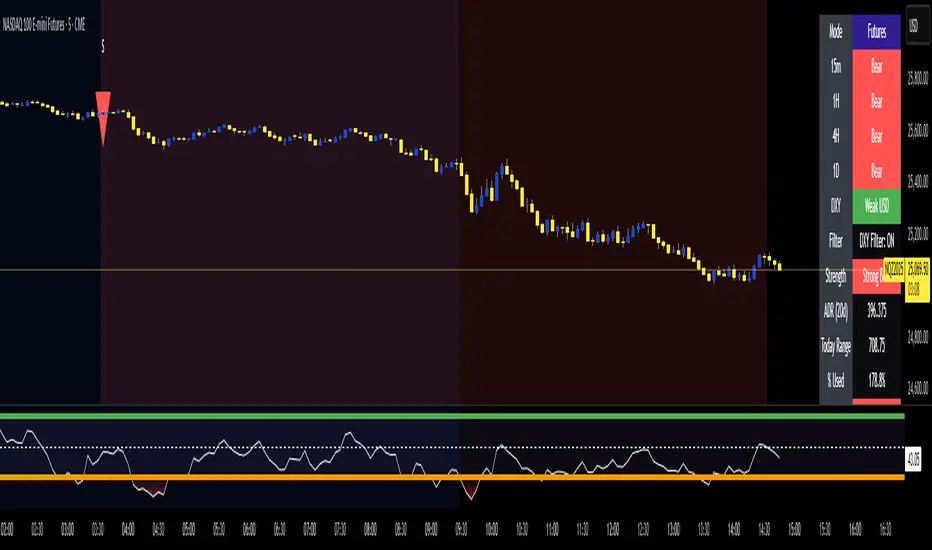
MTF Trend - Gold/XAU with DXY Filter + ADRThis MTF Dashboard has had an addition to it I have added the ADR to the MTF Dashboard this works with all assets but the DXY filter must be turned off If not Trading Gold The Dashboard gives Clarity to the Direction and the Strength of the Trend
Swing Trade AL/SAT + Güç Derecesi_huğurlu
Weak signal → MACD crossover only.
Moderate signal → MACD crossover + RSI confirmation.
Strong signal → MACD crossover + RSI + Stoch RSI confirmation.
BUY/SELL labels appear on the chart in different colors and sizes.
This way, you can instantly see which signal is more reliable.
Zayıf sinyal → sadece MACD kesişim var
Orta sinyal → MACD kesişim + RSI teyidi.
Güçlü sinyal → MACD kesişim + RSI + Stoch RSI teyidi.

EMA Dynamic Crossover Detector with Real-Time Signal TableDescriptionWhat This Indicator Does:This indicator monitors all possible crossovers between four key exponential moving averages (20, 50, 100, and 200 periods) and displays them both visually on the chart and in an organized data table. Unlike standard EMA indicators that only plot the lines, this tool actively detects every crossover event, marks the exact crossover point with a circle, records the precise price level, and maintains a running log of all crossovers during the trading session. It's designed for traders who want comprehensive EMA crossover analysis without manually watching multiple moving average pairs.Key Features:
Four Essential EMAs: Plots 20, 50, 100, and 200-period exponential moving averages with color-coded thin lines for clean chart presentation
Complete Crossover Detection: Monitors all 6 possible EMA pair combinations (20×50, 20×100, 20×200, 50×100, 50×200, 100×200) in both directions
Precise Price Marking: Places colored circles at the exact average price where crossovers occur (not just at candle close)
Real-Time Signal Table: Displays up to 10 most recent crossovers with timestamp, direction, exact price, and signal type
Session Filtering: Only records crossovers during active trading hours (10:00-18:00 Istanbul time) to avoid noise from low-liquidity periods
Automatic Daily Reset: Clears the signal table at the start of each new trading day for fresh analysis
Built-In Alerts: Two alert conditions (bullish and bearish crossovers) that can be configured to send notifications
How It Works:The indicator calculates four exponential moving averages using the standard EMA formula, then continuously monitors for crossover events using Pine Script's ta.crossover() and ta.crossunder() functions:Bullish Crossovers (Green ▲):
When a faster EMA crosses above a slower EMA, indicating potential upward momentum:
20 crosses above 50, 100, or 200
50 crosses above 100 or 200
100 crosses above 200 (Golden Cross when it's the 50×200)
Bearish Crossovers (Red ▼):
When a faster EMA crosses below a slower EMA, indicating potential downward momentum:
20 crosses below 50, 100, or 200
50 crosses below 100 or 200
100 crosses below 200 (Death Cross when it's the 50×200)
Price Calculation:
Instead of marking crossovers at the candle's close price (which might not be where the actual cross occurred), the indicator calculates the average price between the two crossing EMAs, providing a more accurate representation of the crossover point.Signal Table Structure:The table in the top-right corner displays four columns:
Saat (Time): Exact time of crossover in HH:MM format
Yön (Direction): Arrow indicator (▲ green for bullish, ▼ red for bearish)
Fiyat (Price): Calculated average price at the crossover point
Durum (Status): Signal classification ("ALIŞ" for buy signals, "SATIŞ" for sell signals) with color-coded background
The table shows up to 10 most recent crossovers, automatically updating as new signals appear. If no crossovers have occurred during the session within the time filter, it displays "Henüz kesişim yok" (No crossovers yet).EMA Color Coding:
EMA 20 (Aqua/Turquoise): Fastest-reacting, most sensitive to recent price changes
EMA 50 (Green): Short-term trend indicator
EMA 100 (Yellow): Medium-term trend indicator
EMA 200 (Red): Long-term trend baseline, key support/resistance level
How to Use:For Day Traders:
Monitor 20×50 crossovers for quick entry/exit signals within the day
Use the time filter (10:00-18:00) to focus on high-volume trading hours
Check the signal table throughout the session to track momentum shifts
Look for confirmation: if 20 crosses above 50 and price is above EMA 200, bullish bias is stronger
For Swing Traders:
Focus on 50×200 crossovers (Golden Cross/Death Cross) for major trend changes
Use higher timeframes (4H, Daily) for more reliable signals
Wait for price to close above/below the crossover point before entering
Combine with support/resistance levels for better entry timing
For Position Traders:
Monitor 100×200 crossovers on daily/weekly charts for long-term trend changes
Use as confirmation of major market shifts
Don't react to every crossover—wait for sustained movement after the cross
Consider multiple timeframe analysis (if crossovers align on weekly and daily, signal is stronger)
Understanding EMA Hierarchies:The indicator becomes most powerful when you understand EMA relationships:Bullish Hierarchy (Strongest to Weakest):
All EMAs ascending (20 > 50 > 100 > 200): Strong uptrend
20 crosses above 50 while both are above 200: Pullback ending in uptrend
50 crosses above 200 while 20/50 below: Early trend reversal signal
Bearish Hierarchy (Strongest to Weakest):
All EMAs descending (20 < 50 < 100 < 200): Strong downtrend
20 crosses below 50 while both are below 200: Rally ending in downtrend
50 crosses below 200 while 20/50 above: Early trend reversal signal
Trading Strategy Examples:Pullback Entry Strategy:
Identify major trend using EMA 200 (price above = uptrend, below = downtrend)
Wait for pullback (20 crosses below 50 in uptrend, or above 50 in downtrend)
Enter when 20 re-crosses 50 in the trend direction
Place stop below/above the recent swing point
Exit when 20 crosses 50 against the trend again
Golden Cross/Death Cross Strategy:
Wait for 50×200 crossover (appears in the signal table)
Verify: Check if crossover occurs with increasing volume
Entry: Enter in the direction of the cross after a pullback
Stop: Place stop below/above the 200 EMA
Target: Swing high/low or when opposite crossover occurs
Multi-Crossover Confirmation:
Watch for multiple crossovers in the same direction within a short period
Example: 20×50 crossover followed by 20×100 = strengthening momentum
Enter after the second confirmation crossover
More crossovers = stronger signal but also means you're entering later
Time Filter Benefits:The 10:00-18:00 Istanbul time filter prevents recording crossovers during:
Pre-market volatility and gaps
Low-volume overnight sessions (for 24-hour markets)
After-hours erratic movements
