Double Inside Bar Scanner [Daily]Double Inside Bar Scanner . Captures Double Inside based on last 2 daily Bars
Trend Analysis
Liquidity Grab Entry Signals [Daily Enhanced]Liquidity Grab Entry Signals is a powerful tool designed to detect intraday reversal opportunities around daily high/low liquidity zones.
Core features: – Plots current daily high/low levels
– Identifies price interaction with these key zones
– Confirms rejection via strong engulfing candles
– Plots real-time long/short entry signals directly on chart
– Includes alerts for both long and short setups
This script is ideal for scalpers and intraday traders looking to exploit stop hunts, liquidity sweeps, and false breakouts.
Optimized for instruments like US30, NAS100, Gold, BTC and more.
Customize the sensitivity buffer to suit your asset and timeframe.
Use this in combination with VWAP, FVG or Smart Money concepts for enhanced confirmation.
---
Built for: 1s–15m charts
Includes: Alerts + Custom Settings
Type: Non-repainting
Trade with clarity around the most manipulated price levels of the day.

Filtro Antirumore Ottimizzato by G.I.N.e TradingNoise Filter – Adaptive Version for Bund & DAX by G.I.N.e Trading
The Noise Filter is a market condition tool designed to help traders avoid false signals by identifying sideways or low-quality trading phases. This version has been specifically optimized to work effectively with both Bund and DAX price action behaviors.
⚙️ How It Works
The indicator analyzes four key components to determine if the market is in a "noise zone" (sideways, low volatility, or weak trend):
Bollinger Band Width – Detects price compression.
ADX – Measures the strength of the trend.
ATR – Captures recent volatility.
HMA Slope – Evaluates directional movement (trend or no trend).
A noise zone is triggered if at least two out of three core conditions are met:
Narrow Bollinger Bands
ADX below threshold
ATR below threshold
And it is confirmed only if there is no clear directional slope in price.
A strong directional slope overrides the noise signal, allowing valid trends with low volatility (common in instruments like the Bund).
🎯 Visual Output
Gray column → Noise zone: avoid signals in this phase (low quality environment).
Yellow column → Operational zone: conditions are more favorable for trend-following systems.
🛠️ Fully Customizable
You can adjust:
Bollinger Band period & width threshold
ADX length & threshold
ATR period & threshold
HMA slope sensitivity
💡 Best For
Filtering false signals in automated or manual trading strategies
Enhancing trend-following accuracy
Adapting behavior to both high-volatility instruments (DAX) and low-volatility instruments (Bund)

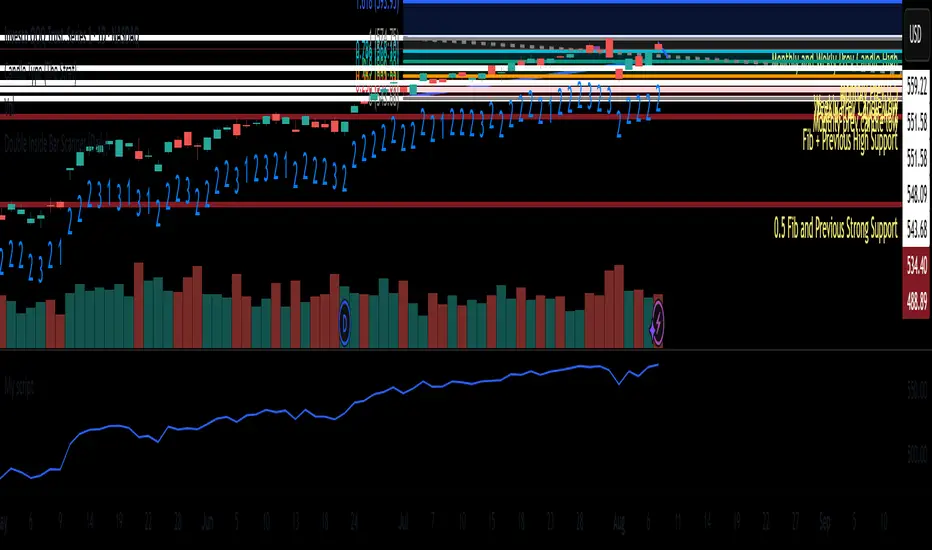
Fibonacci Retracement RealTimeAuto Fib Retracements with the important levels
Very useful to trade in real time with the high and lof of the day
Maybe more updates where you can track with the previous high and lows where the levels were and see where it bounced
Thanks to Grok and chat gpt for making this real

Confidence Score – DAX & BUND (Auto) by G.I.N.e TradingConfidence Score – DAX & BUND (Auto)
This indicator calculates a confidence score (0–5) to filter trade signals based on market conditions, adapting its parameters automatically for the DAX and the German Bund futures.
The score is built from five independent conditions:
ADX Strength – Measures trend directionality. Score point if ADX is above a defined threshold.
RSI Position – Avoids the neutral “no-trade zone” between two RSI levels. Score point if RSI is outside this range.
Price Range Expansion – Checks whether the recent price range (over N bars) is large enough relative to current price.
Candle Body Size – Ensures the current candle body is significant compared to the total high–low range (avoiding very small-bodied candles).
Volume Confirmation – Requires current volume to be above its moving average and higher than the previous bar.
Score Interpretation:
4–5 points → Green: strong, clear market conditions (high confidence).
2–3 points → Orange: moderate conditions (trade with caution).
0–1 points → Red: weak, choppy market (high noise).
DAX Logic:
Used for trend-following entries only.
Trades are allowed only if the score is above the DAX threshold and the price is aligned with the main trend (defined by HMA).
BUND Logic:
Used for trend-reversal entries only.
Trades are allowed only if the score is above the Bund threshold and the price is against the main trend, confirming a potential reversal setup.
Key Features:
Automatic instrument detection (DAX vs. BUND) with parameter adjustment.
Separate score thresholds for DAX (trend continuation) and Bund (reversals).
Visual columns showing score levels and optional bar coloring when score ≥ 4.
Context windows plotted as small markers to indicate when trade setups are allowed according to the instrument-specific rules.
This indicator should be used as a filter in combination with your core entry strategy (e.g., HARSI Cross, MACD, VSA) to avoid taking trades in low-confidence, noisy market conditions.

VWAP-RSI Scalper FINAL v1Description
This script implements a robust, battle-tested intraday scalping strategy designed for prop firm challenges, funded trader programs, and serious futures scalpers.
It combines VWAP, RSI, EMA trend, and ATR-based risk management to capture high-probability mean reversion and momentum moves during the most liquid hours of the trading day.
Core Logic
RSI (Relative Strength Index):
Trades are triggered when the RSI is either oversold or overbought using a short lookback (default: 3). This ensures only the strongest intraday reversals or exhaustion moves are considered.
VWAP Filter:
Longs are only taken above VWAP, shorts only below VWAP, aligning trades with the session’s dominant bias.
EMA Filter:
Additional trend quality filter—longs require price above EMA, shorts below EMA.
Session Control:
Only trades between user-defined session hours (default: US cash session), eliminating overnight/illiquid action.
ATR-based Dynamic Stops & Targets:
Every trade uses a stop loss at 1x ATR and a take profit at 2x ATR for a positive risk/reward ratio.
Max Trades Per Day:
Prevents overtrading and controls risk exposure (default: 3).
Performance (Sample Backtest)
Profit Factor: 1.37+ (prop-firm quality)
Drawdown: <1% (very conservative risk)
Win Rate: 37–48% (RR > 1, so high edge)
Consistency: Smooth, steady equity curve over hundreds of trades.
Best For:
ES/NQ/CL/GC intraday traders
Prop firm evaluation challenges (Tradeify, Topstep, Apex, etc.)
Anyone needing robust, no-nonsense systematic edge for futures or indices.
How to Use & Tune
Apply to 3min, 5min, or 15min charts of liquid futures or indices.
Change parameters in the settings panel to suit your asset, volatility, or session hours.
Use “Strategy Tester” to validate P&L, win rate, and drawdown.
How to Optimize
Raise/lower RSI length or bands to make signals more/less frequent.
Adjust stop/target multiples for your preferred risk/reward profile.
Change session hours to match your broker or market.
Disclaimer
This is not financial advice. Use on a demo or sim account first. Results will vary by market, slippage, and execution speed. Past performance does not guarantee future results.
If you find this useful, please give it a like, follow for more strategies, and comment your results or questions!
Good luck and safe trading!

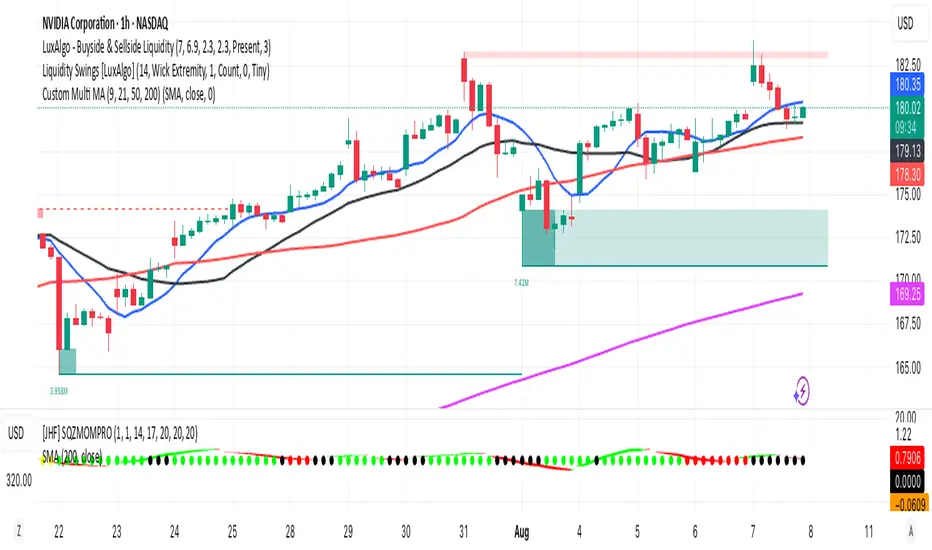
Multi MA (9, 21, 50, 200)This indicator plots four commonly used moving averages — 9, 21, 50, and 200 — with customizable smoothing methods and color-coded lines optimized for visibility on any chart background.
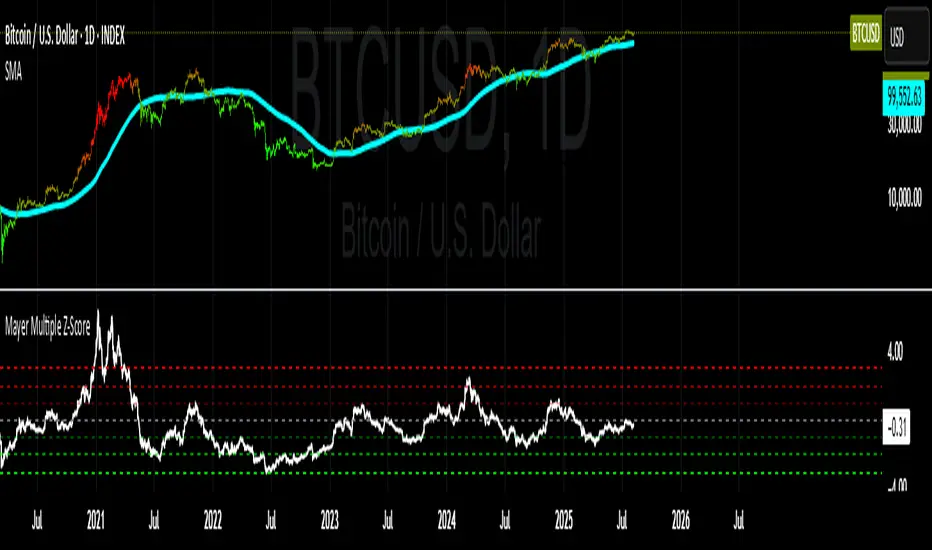
Mayer Multiple Z-ScoreMayer Multiple is a ratio between the current Market Price and its 200 days moving average.
Being a lagging indicator it shows periods of relative value for the asset but does not have much predictive power.
It is worth noting that the indicator relies on a fairly responsive moving average on the scale of a Bitcoin market cycle and as such may be best suited for the swing traders to find zones where price is overbought and oversold within a market cycle.
Added the Z-Score metric for easy classification of the value of Bitcoin according to this indicator. Customizable thresholds from Z-Score calculation as the metric suffers alpha decay / compression.
Created for TRW
ATR Trailing Stop (Strict Ratcheting + Resets Only on Stop)ATR trailing stop after a 250 day breakout. Final version.

Bullish Breakaway-Publish
This indicator tracks the intraday RTH (Regular Trading Hours) low in the bullish direction to identify breakaway candles based on the Fair Value Gap (FVG) and gap breakout concept. By default, the session runs from 9:30 AM to 5:00 PM EST, but the start time can be adjusted to track other sessions such as ETH beginning at 6:00 PM.
At the start of the session, the first candle is always considered the initial intraday low. This candle becomes the anchor, and the indicator continuously updates it whenever a new intraday low is made. A bullish breakaway occurs when a candle’s low is higher than the high of the current anchor candle, creating a gap between them. This first breakaway candle is marked with a green arrow. After the first breakaway, the indicator continues to look for additional breakaways in the bullish direction, each based on the most recent breakaway candle.
If a new intraday low is formed after a breakaway candle has appeared, the anchor is reset to this new low, all previous breakaway markers are removed, and the search starts over. The high and low of the most recent breakaway candle are drawn as horizontal rays, which can act as potential support or resistance depending on the trader’s bias.
You can backtest this indicator using TradingView’s Bar Replay feature to watch the resetting process as new intraday lows are made. Because the first candle of the session is always the first intraday low, the reset behavior is easy to observe in replay mode.
Timeframe recommendations: This tool works best on 1-minute, 5-minute, 15-minute, and 30-minute charts.
Trading tips:
• At the market open, always identify the first breakaway candle.
• Once the intraday low stabilizes, a bullish run may follow — the first breakaway candle often marks the start of this move.
• To trade reversals from a bullish trend, watch for a bearish breakaway candle using the bearish companion indicator.
• If the daily trend is bearish, you will often see the intraday low reset many times — this is a sign to favor bearish trades.
• If trading reversals against the prevailing trend, use the breakaway candle as your signal for potential entry.
You should always trade in the daily trend direction and this indicator will give you the footprint of the daily trend as they are the breakaway candle.

Bearish Breakaway-Publish-FVG concept
This indicator tracks the intraday RTH (Regular Trading Hours) high in the bearish direction to identify breakaway candles based on the Fair Value Gap (FVG) and gap breakout concept. By default, the session runs from 9:30 AM to 5:00 PM EST, but the start time can be adjusted to track other sessions such as ETH beginning at 6:00 PM.
At the start of the session, the first candle is always considered the initial intraday high. This candle becomes the anchor, and the indicator continuously updates it whenever a new intraday high is made. A bearish breakaway occurs when a candle’s high is lower than the low of the current anchor candle, creating a gap between them. This first breakaway candle is marked with a red arrow. After the first breakaway, the indicator continues to look for additional breakaways in the bearish direction, each based on the most recent breakaway candle.
If a new intraday high is formed after a breakaway candle has appeared, the anchor is reset to this new high, all previous breakaway markers are removed, and the search starts over. The high and low of the most recent breakaway candle are drawn as horizontal rays, which can act as potential resistance or support depending on the trader’s bias.
You can backtest this indicator using TradingView’s Bar Replay feature to watch the resetting process as new intraday highs are made. Because the first candle of the session is always the first intraday high, the reset behavior is easy to observe in replay mode.
Timeframe recommendations: This tool works best on 1-minute, 5-minute, 15-minute, and 30-minute charts.
Trading tips:
• At the market open, always identify the first bearish breakaway candle.
• Once the intraday high stabilizes, a bearish run may follow — the first breakaway candle often marks the start of this move.
• To trade reversals from a bearish trend, watch for a bullish breakaway candle using the bullish companion indicator.
• If the daily trend is bullish, you will often see the intraday high reset many times — this is a sign to favor bullish trades.
• If trading reversals against the prevailing trend, use the breakaway candle as your signal for potential entry.

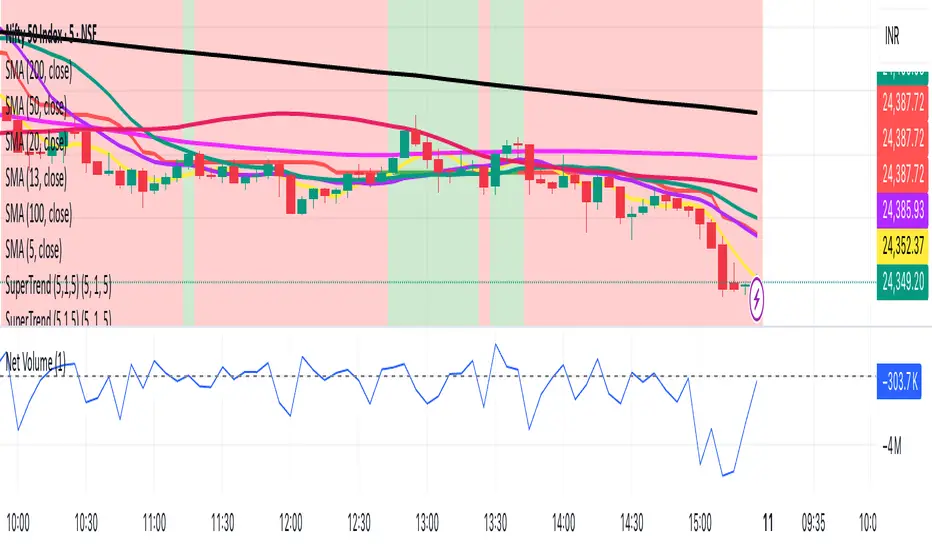
SuperTrend (5,1,5) By satish SWhy 3 Supertrends?
Short-term Supertrend (7, 1, 3) → reacts quickly, catches early trend changes but can give more false signals.
Medium-term Supertrend (14, 1, 2) → smoother, filters out noise.
Long-term Supertrend (21, 1, 3) → confirms major trend direction, fewer whipsaws.
How it Works
Trend Reversal Detection
If all three flip in the same direction → strong confirmation of trend change.
If only the short-term flips but others don’t → possible false signal, wait for confirmation.
Entry Signal Example
Buy when all three turn green (Supertrend below price).
Sell/short when all three turn red (Supertrend above price).
Exit / Partial Profit
Exit when the shortest one (7, 1, 3) flips against your position — protects profits in choppy markets.
TradingView Setup
You can do this by:
Adding Supertrend three times.
Setting their (Period, Multiplier, ATR Type) to:
ST1: 7, 1, 3
ST2: 14, 1, 2
ST3: 21, 1, 3
Use different colors or line styles for each so you can spot alignment quickly.
VHX EMA 135/315📈 EMA 135/315 Cross Strategy – Your Trend Compass with Smart Confirmations
🔍 Core Idea
The EMA 135/315 Cross strategy is a trend-following system.
It tracks two moving averages:
EMA 135 → the “fast” line that reacts to short-term price moves
EMA 315 → the “slow” line that reacts to the bigger trend
When the fast EMA crosses above the slow EMA → market momentum is turning up → BUY signal 🟢
When the fast EMA crosses below the slow EMA → momentum is turning down → SELL signal 🔴
This gives you a clear entry trigger — no guessing, no overcomplication.
✨ On Your Chart
BUY/SELL Arrows
🟢 Green arrow = bullish cross → trend turning up
🔴 Red arrow = bearish cross → trend turning down
Trend Info Panel (Top Left)
Current Trend: BUY / SELL / Neutral
Last Cross: how many bars ago it happened
EMA Gap in %: measures the strength of the trend
Status: “Approaching” if EMAs are getting close → possible cross soon
Automatic TP/SL Levels
📈 TP line (+2% from entry)
📉 SL line (–0.5% from entry)
Saves time — you instantly see your target and protection
EMA Distance Meter
Big % gap = strong trend momentum 🚀
Small % gap = weak or sideways market ⚠️
Real-Time Alerts
You get notified when a cross happens, even if you’re away from the screen
🧠 The Logic Behind It
The EMA 135 reacts faster → it reflects short-term momentum
The EMA 315 moves slower → it reflects the main trend
When the fast EMA overtakes the slow EMA: short-term strength now aligns with the long-term trend → higher probability of a sustained move
The gap % tells you how strong the alignment is — large gap = cleaner moves, small gap = market in transition
“Approaching” status warns that the EMAs are converging, which often happens before a reversal
📊 Boosting the Strategy with Volume Analysis
The EMA cross is a strong trigger, but volume confirms the quality of the move:
High Volume + Cross → more reliable signal, as strong market participation is pushing the trend
Low Volume + Cross → caution, the move might be weak or a false breakout
💡 Tip:
Check the volume histogram or a volume-based indicator (e.g., Volume Profile, OBV).
On a BUY signal: volume should spike above the recent average.
On a SELL signal: watch for strong selling volume bars.
📍 Adding Support & Resistance for Precision
Support and resistance levels help filter out bad trades and optimize entries:
Best BUY setups:
EMA 135 crosses above EMA 315 near a known support zone
Bonus if volume confirms the move
Avoid buying directly into a strong resistance
Best SELL setups:
EMA 135 crosses below EMA 315 near a known resistance zone
Bonus if selling volume is strong
Avoid selling directly into a major support
💡 Use tools like horizontal lines, previous highs/lows, and Volume Profile nodes to spot these zones.
📈 Best Usage Practices
Timeframes
Lower timeframes (1m–5m) → more signals, but more noise → best for scalping with extra filters
Always Combine With Confirmation
EMA Cross = Trigger
Volume spike = Confirmation
S/R zone in your favor = High-probability setup
Manage Risk
Start with the built-in TP/SL
Adjust SL if volatility is higher than usual
Consider trailing stop once price moves in your favor
Avoid Sideways Markets
If EMA gap % is very small and crosses happen often → stand aside until a clear direction forms
Use Alerts
Set alerts for BUY & SELL crosses so you never miss a setup
In short:
This isn’t just an EMA cross indicator — it’s a trend system with built-in risk management, strength measurement, and pre-trade preparation. Combine it with volume confirmation and smart use of support/resistance, and you turn a simple signal into a high-probability trading edge.

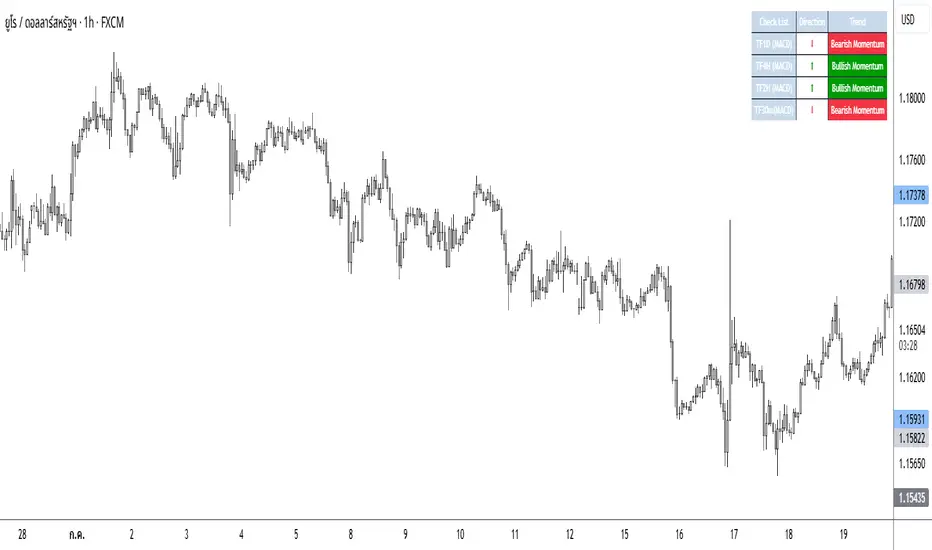
StratNinjaTableAuthor’s Instructions for StratNinjaTable
Purpose:
This indicator is designed to provide traders with a clear and dynamic table displaying The Strat candle patterns across multiple timeframes of your choice.
Usage:
Use the input panel to select which timeframes you want to monitor in the table.
Choose the table position on the chart (top left, center, right, or bottom).
The table will update each bar, showing the candle type, direction arrow, and remaining time until the candle closes for each selected timeframe.
Hover over or inspect the table to understand current market structure per timeframe using The Strat methodology.
Notes:
The Strat pattern is displayed as "1", "2U", "2D", or "3" based on the relationship of current and previous candle highs and lows.
The timer updates in real-time and adapts to daily, weekly, monthly, and extended timeframes.
This script requires Pine Script version 6. Please use it on supported platforms.
MFI or other indicators are not included in this base version but can be integrated separately if desired.
Credits:
Developed and inspired by shayy110 — thanks for your foundational work on The Strat in Pine Script.
Disclaimer:
This script is for educational and informational purposes only. Always verify signals and manage risk accordingly.

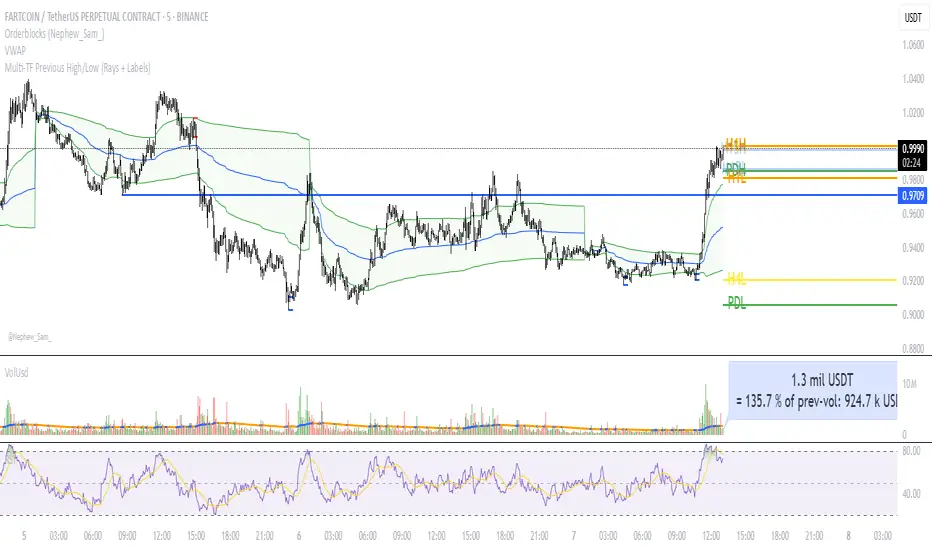
Multi‑TF Previous High/Low (Rays + Labels)Use this indicator if you want to automate Support and Resistance levels.
Previous Day High and Low - Green Lines
Previous 4 Hour High and Low - Yellow Lines
Previous 1 Hour High and Low - Orange Lines
Previous 15 Minute High and Low - Light Blue Lines
Follow me on X-
ADHDTRDR
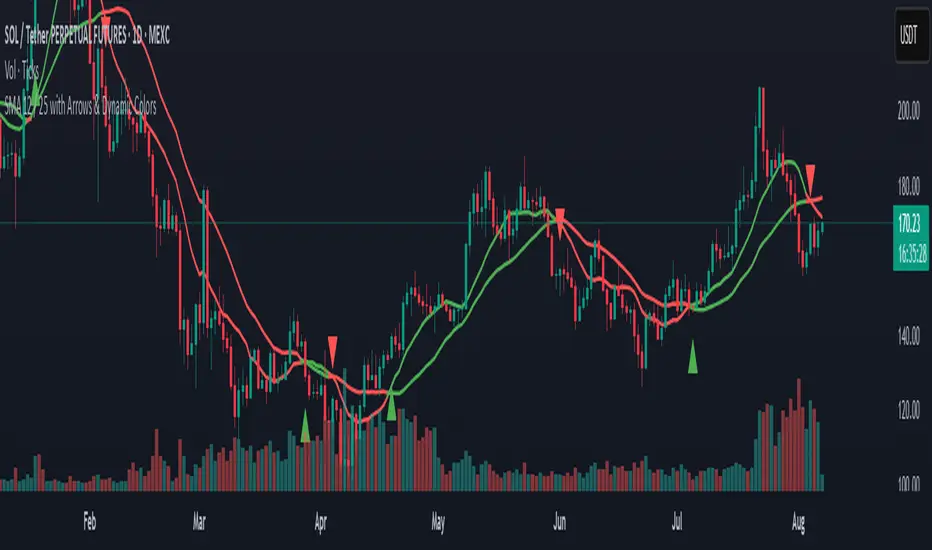
SMA 12 / 25 with Arrows & Dynamic ColorsSMA 12 / 25 with Arrows & Dynamic Colors
Colors are the same after crosses
Up down arrows at crosses
Squeeze Momentum Regression Clouds [SciQua]╭──────────────────────────────────────────────╮
☁️ Squeeze Momentum Regression Clouds
╰──────────────────────────────────────────────╯
🔍 Overview
The Squeeze Momentum Regression Clouds (SMRC) indicator is a powerful visual tool for identifying price compression , trend strength , and slope momentum using multiple layers of linear regression Clouds. Designed to extend the classic squeeze framework, this indicator captures the behavior of price through dynamic slope detection, percentile-based spread analytics, and an optional UI for trend inspection — across up to four customizable regression Clouds .
────────────────────────────────────────────────────────────
╭────────────────╮
⚙️ Core Features
╰────────────────╯
Up to 4 Regression Clouds – Each Cloud is created from a top and bottom linear regression line over a configurable lookback window.
Slope Detection Engine – Identifies whether each band is rising, falling, or flat based on slope-to-ATR thresholds.
Spread Compression Heatmap – Highlights compressed zones using yellow intensity, derived from historical spread analysis.
Composite Trend Scoring – Aggregates directional signals from each Cloud using your chosen weighting model.
Color-Coded Candles – Optional candle coloring reflects the real-time composite score.
UI Table – A toggleable info table shows slopes, compression levels, percentile ranks, and direction scores for each Cloud.
Gradient Cloud Styling – Apply gradient coloring from Cloud 1 to Cloud 4 for visual slope intensity.
Weight Aggregation Options – Use equal weighting, inverse-length weighting, or max pooling across Clouds to determine composite trend strength.
────────────────────────────────────────────────────────────
╭──────────────────────────────────────────╮
🧪 How to Use the Indicator
1. Understand Trend Bias with Cloud Colors
╰──────────────────────────────────────────╯
Each Cloud changes color based on its current slope:
Green indicates a rising trend.
Red indicates a falling trend.
Gray indicates a flat slope — often seen during chop or transitions.
Cloud 1 typically reflects short-term structure, while Cloud 4 represents long-term directional bias. Watch for multi-Cloud alignment — when all Clouds are green or red, the trend is strong. Divergence among Clouds often signals a potential shift.
────────────────────────────────────────────────────────────
╭───────────────────────────────────────────────╮
2. Use Compression Heat to Anticipate Breakouts
╰───────────────────────────────────────────────╯
The space between each Cloud’s top and bottom regression lines is measured, normalized, and analyzed over time. When this spread tightens relative to its history, the script highlights the band with a yellow compression glow .
This visual cue helps identify squeeze zones before volatility expands. If you see compression paired with a changing slope color (e.g., gray to green), this may indicate an impending breakout.
────────────────────────────────────────────────────────────
╭─────────────────────────────────╮
3. Leverage the Optional Table UI
╰─────────────────────────────────╯
The indicator includes a dynamic, floating table that displays real-time metrics per Cloud. These include:
Slope direction and value , with historical Min/Max reference.
Top and Bottom percentile ranks , showing how price sits within the Cloud range.
Current spread width , compared to its historical norms.
Composite score , which blends trend, slope, and compression for that Cloud.
You can customize the table’s position, theme, transparency, and whether to show a combined summary score in the header.
────────────────────────────────────────────────────────────
╭─────────────────────────────────────────────╮
4. Analyze Candle Color for Composite Signals
╰─────────────────────────────────────────────╯
When enabled, the indicator colors candles based on a weighted composite score. This score factors in:
The signed slope of each Cloud (up, down, or flat)
The percentile pressure from the top and bottom bands
The degree of spread compression
Expect green candles in bullish trend phases, red candles during bearish regimes, and gray candles in mixed or low-conviction zones.
Candle coloring provides a visual shorthand for market conditions , useful for intraday scanning or historical backtesting.
────────────────────────────────────────────────────────────
╭────────────────────────╮
🧰 Configuration Guidance
╰────────────────────────╯
To tailor the indicator to your strategy:
Use Cloud lengths like 21, 34, 55, and 89 for a balanced multi-timeframe view.
Adjust the slope threshold (default 0.05) to control how sensitive the trend coloring is.
Set the spread floor (e.g., 0.15) to tune when compression is detected and visualized.
Choose your weighting style : Inverse Length (favor faster bands), Equal, or Max Pooling (most aggressive).
Set composite weights to emphasize trend slope, percentile bias, or compression—depending on your market edge.
────────────────────────────────────────────────────────────
╭────────────────╮
✅ Best Practices
╰────────────────╯
Use aligned Cloud colors across all bands to confirm trend conviction.
Combine slope direction with compression glow for early breakout entry setups.
In choppy markets, watch for Clouds 1 and 2 turning flat while Clouds 3 and 4 remain directional — a sign of potential trend exhaustion or consolidation.
Keep the table enabled during backtesting to manually evaluate how each Cloud behaved during price turns and consolidations.
────────────────────────────────────────────────────────────
╭───────────────────────╮
📌 License & Usage Terms
╰───────────────────────╯
This script is provided under the Creative Commons Attribution-NonCommercial 4.0 International License .
✅ You are allowed to:
Use this script for personal or educational purposes
Study, learn, and adapt it for your own non-commercial strategies
❌ You are not allowed to:
Resell or redistribute the script without permission
Use it inside any paid product or service
Republish without giving clear attribution to the original author
For commercial licensing , private customization, or collaborations, please contact Joshua Danford directly.

🐿️ Squirrel of Wall Street This indicator is provided for educational and informational purposes only. It does not constitute a buy or sell recommendation. The user is solely responsible for any trading decisions. Always do your own research and use appropriate risk management.

Filtro Universale Antirumore by G.I.N.e TradingNoise Filter Indicator by G.I.N.e Trading
The Noise Filter Indicator is designed to detect market conditions where price action is likely to generate false signals due to low volatility or lack of trend. These are typically sideways or congested phases that trend-following systems should avoid.
⚙️ How it works:
The indicator analyzes the current market structure using three components:
Bollinger Band Width
Measures price compression.
Narrow bands indicate a potential sideways phase.
Average Directional Index (ADX)
Measures the strength of the trend.
Low ADX values suggest absence of directional momentum.
Average True Range (ATR)
Measures recent price volatility.
When ATR is below its moving average, the market is likely ranging or losing energy.
A noise zone is identified when at least 2 out of 3 conditions are true:
Low volatility (Bollinger Band Width)
Weak trend (ADX < threshold)
ATR below reference value
🎯 Visual Output:
🟨 Yellow bar: Trend conditions favorable — signals are more reliable.
⬜️ Gray bar: Noise zone — high risk of false signals, avoid trading.

Market Regime Matrix [Alpha Extract]A sophisticated market regime classification system that combines multiple technical analysis components into an intelligent scoring framework to identify and track dominant market conditions. Utilizing advanced ADX-based trend detection, EMA directional analysis, volatility assessment, and crash protection protocols, the Market Regime Matrix delivers institutional-grade regime classification with BULL, BEAR, and CHOP states. The system features intelligent scoring with smoothing algorithms, duration filters for stability, and structure-based conviction adjustments to provide traders with clear, actionable market context.
🔶 Multi-Component Regime Engine Integrates five core analytical components: ADX trend strength detection, EMA-200 directional bias, ROC momentum analysis, Bollinger Band volatility measurement, and zig-zag structure verification. Each component contributes to a sophisticated scoring system that evaluates market conditions across multiple dimensions, ensuring comprehensive regime assessment with institutional precision.
// Gate Keeper: ADX determines market type
is_trending = adx_value > adx_trend_threshold
is_ranging = adx_value <= adx_trend_threshold
is_maximum_chop = adx_value <= adx_chop_threshold
// BULL CONDITIONS with Structure Veto
if price_above_ema and di_bullish
if use_structure_filter and isBullStructure
raw_bullScore := 5.0 // MAXIMUM CONVICTION: Strong signals + Bull structure
else if use_structure_filter and not isBullStructure
raw_bullScore := 3.0 // REDUCED: Strong signals but broken structure
🔶 Intelligent Scoring System Employs a dynamic 0-5 scale scoring mechanism for each regime type (BULL/BEAR/CHOP) with adaptive conviction levels. The system automatically adjusts scores based on signal alignment, market structure confirmation, and volatility conditions. Features decision margin requirements to prevent false regime changes and includes maximum conviction thresholds for high-probability setups.
🔶 Advanced Structure Filter Implements zig-zag based market structure analysis using configurable deviation thresholds to identify significant pivot points. The system tracks Higher Highs/Higher Lows (HH/HL) for bullish structure and Lower Lows/Lower Highs (LL/LH) for bearish structure, applying structure veto logic that reduces conviction when price action contradicts the underlying trend framework.
// Define Market Structure (Bull = HH/HL, Bear = LL/LH)
isBullStructure = not na(last_significant_high) and not na(prev_significant_high) and
not na(last_significant_low) and not na(prev_significant_low) and
last_significant_high > prev_significant_high and last_significant_low > prev_significant_low
isBearStructure = not na(last_significant_high) and not na(prev_significant_high) and
not na(last_significant_low) and not na(prev_significant_low) and
last_significant_low < prev_significant_low and last_significant_high < prev_significant_high
🔶 Superior Engine Components Features dual-layer regime stabilization through score smoothing and duration filtering. The score smoothing component reduces noise by averaging raw scores over configurable periods, while the duration filter requires minimum regime persistence before confirming changes. This eliminates whipsaws and ensures regime transitions represent genuine market shifts rather than temporary fluctuations.
🔶 Crash Detection & Active Penalties Incorporates sophisticated crash detection using Rate of Change (ROC) analysis with severity classification. When crash conditions are detected, the system applies active penalties (-5.0) to BULL and CHOP scores while boosting BEAR conviction based on crash severity. This ensures immediate regime response to major market dislocations and drawdown events.
// === CRASH OVERRIDE (Active Penalties) ===
is_crash = roc_value < crash_threshold
if is_crash
// Calculate crash severity
crash_severity = math.abs(roc_value / crash_threshold)
crash_bonus = 4.0 + (crash_severity - 1.0) * 2.0
// ACTIVE PENALTIES: Force bear dominance
raw_bearScore := math.max(raw_bearScore, crash_bonus)
raw_bullScore := -5.0 // ACTIVE PENALTY
raw_chopScore := -5.0 // ACTIVE PENALTY
❓How It Works
🔶 ADX-Based Market Classification The Market Regime Matrix uses ADX (Average Directional Index) as the primary gatekeeper to distinguish between trending and ranging market conditions. When ADX exceeds the trend threshold, the system activates BULL/BEAR regime logic using DI+/DI- crossovers and EMA positioning. When ADX falls below the ranging threshold, CHOP regime logic takes precedence, with maximum conviction assigned during ultra-low ADX periods.
🔶 Dynamic Conviction Scaling Each regime receives conviction ratings from UNCERTAIN to MAXIMUM based on signal alignment and score magnitude. MAXIMUM conviction (5.0 score) requires perfect signal alignment plus favorable market structure. The system progressively reduces conviction when signals conflict or structure breaks, ensuring traders understand the reliability of each regime classification.
🔶 Regime Transition Management Implements decision margin requirements where new regimes must exceed existing regimes by configurable thresholds before transitions occur. Combined with duration filtering, this prevents premature regime changes and maintains stability during consolidation periods. The system tracks both raw regime signals and final regime output for complete transparency.
🔶 Visual Regime Mapping Provides comprehensive visual feedback through colored candle overlays, background regime highlighting, and real-time information tables. The system displays regime history, conviction levels, structure status, and key metrics in an organized dashboard format. Regime changes trigger immediate visual alerts with detailed transition information.
🔶 Performance Optimization Features efficient array management for zig-zag calculations, smart variable updating to prevent recomputation, and configurable debug modes for strategy development. The system maintains optimal performance across all timeframes while providing institutional-grade analytical depth.
Why Choose Market Regime Matrix ?
The Market Regime Matrix represents the evolution of market regime analysis, combining traditional technical indicators with modern algorithmic decision-making frameworks. By integrating multiple analytical dimensions with intelligent scoring, structure verification, and crash protection, it provides traders with institutional-quality market context that adapts to changing conditions. The sophisticated filtering system eliminates noise while preserving responsiveness, making it an essential tool for traders seeking to align their strategies with dominant market regimes and avoid adverse market environments.

EMA72 com Difusor - Cor Dinâmica e Espessuras Ajustadas17 EMA
72 EMA (with diffuser included, green signals buy, red signals sell)
72 EMA on the weekly chart

Gemini Trend Following SystemStrategy Description: The Gemini Trend Following System
Core Philosophy
This is a long-term trend-following system designed for a position trader or a patient swing trader, not a day trader. The fundamental goal is to capture the majority of a stock's major, multi-month or even multi-year uptrend.
The core principle is: "Buy weakness in a confirmed uptrend, and sell only when the uptrend's structure is fundamentally broken."
It operates on the belief that it's more profitable to ride a durable trend than to chase short-term breakouts or worry about daily price fluctuations. It prioritizes staying in a winning trade over frequent trading.
The Three Pillars of the Strategy
The script's logic is built on three distinct pillars, processed in order:
1. The Regime Filter: "Is This Stock in a Healthy Uptrend?"
Before even considering a trade, the script acts as a strict gatekeeper. It will only "watch" a stock if it meets all the criteria of a healthy, long-term uptrend. This is the most important part of the strategy as it filters out weak or speculative stocks.
A stock passes this filter if:
The 50-day Simple Moving Average (SMA) is above the 200-day SMA. This is the classic definition of a "Golden Cross" state, indicating the medium-term trend is stronger than the long-term trend—a hallmark of a bull market for the stock.
The stock's performance over the last year is positive. The Rate of Change (ROC) must be above a minimum threshold (e.g., 15%). This ensures we are only looking at stocks that have already demonstrated significant strength.
The 200-day SMA itself is rising. This is a crucial check to ensure the very foundation of the trend is solid and not flattening out or beginning to decline.
If a stock doesn't meet these conditions, the script ignores it completely.
2. The Entry Trigger: "When to Buy the Dip"
Once a stock is confirmed to be in a healthy uptrend, the script does not buy immediately. Instead, it patiently waits for a point of lower risk and higher potential reward—a pullback.
The entry trigger is a specific, two-step sequence:
The stock price first dips and closes below its 50-day SMA. This signifies a period of temporary weakness or profit-taking.
The price then recovers and closes back above the 50-day SMA within a short period (10 bars).
This sequence is a powerful signal. It suggests that institutional buyers view the 50-day SMA as a key support level and have stepped in to defend it, overpowering the sellers. The entry occurs at this point of confirmed support, marking the likely resumption of the uptrend. On the chart, this event is highlighted with a teal background.
3. The Exit Strategy: "When is the Trend Over?"
The exit logic is designed to keep you in the trade as long as possible and only sell when the trend's character has fundamentally changed. It uses a dual-exit system:
Primary Exit (Trend Failure): The main reason to sell is a "Death Cross"—when the 50-day SMA crosses below the 200-day SMA. This is a robust, albeit lagging, signal that the long-term uptrend is over and a bearish market structure is taking hold. This exit condition is designed to ignore normal market corrections and only trigger when the underlying trend has truly broken. On the chart, this is highlighted with a maroon background.
Safety-Net Exit (Catastrophic Stop-Loss): To protect against a sudden market crash or a company-specific disaster, a "safety-net" stop-loss is placed at the time of entry. This stop is set far below the entry price, typically underneath the 200-day SMA. It is a "just-in-case" measure that should only be triggered in a severe and rapid decline, protecting your capital from an unexpected black swan event.
Who is This Strategy For?
Position Traders: Investors who are comfortable holding a stock for many months to over a year.
Patient Swing Traders: Traders who want to capture large price swings over weeks and months, not days.
Investors using a Rules-Based Approach: Anyone looking to apply a disciplined, non-emotional system to their long-term portfolio.
Ideal Market Conditions
This strategy excels in markets with clear, durable trends. It performs best on strong, leading stocks during a sustained bull market. It will underperform significantly or generate losses in choppy, sideways, or range-bound markets, where the moving averages will frequently cross back and forth, leading to "whipsaw" trades.
