Instant Breakout Strategy with RSI & VWAPInstant Breakout Strategy with RSI & VWAP
This TradingView strategy (Pine Script v6) trades breakouts using pivot points, with optional filters for volume, momentum, RSI, and VWAP. It’s optimized for the 1-second timeframe.
Overview
The strategy identifies breakouts when price crosses above resistance (pivot highs) or below support (pivot lows). It can use basic pivot breakouts or add filters for stronger signals. Take-profit and stop-loss levels are set using ATR, and signals are shown on the chart.
Inputs
Left/Right Pivot Bars: Bars to detect pivots (default: 3). Lower values increase sensitivity.
Volume Surge Multiplier: Volume threshold vs. 20-period average (default: 1.5).
Momentum Threshold: Minimum % price change from bar open (default: 1%).
Take-Profit ATR Multiplier: ATR multiplier for take-profit (default: 9.0).
Stop-Loss ATR Multiplier: ATR multiplier for stop-loss (default: 1.0).
Use Filters: Enable/disable volume, momentum, RSI, and VWAP filters (default: off).
How It Works
1. Pivot Detection
Finds pivot highs (resistance) and lows (support) using ta.pivothigh and ta.pivotlow.
Tracks the latest pivot levels.
2. Volume Surge
Compares current volume to a 20-period volume average.
A surge occurs if volume exceeds the average times the multiplier.
3. Momentum
Measures price change from the bar’s open.
Bullish: Price rises >1% from open.
Bearish: Price falls >1% from open.
4. RSI and VWAP
RSI: 3-period RSI. Above 50 is bullish; below 50 is bearish.
VWAP: Price above VWAP is bullish; below is bearish.
5. ATR
14-period ATR sets take-profit (close ± atr * 9.0) and stop-loss (close ± atr * 1.0).
Trading Rules
Breakout Conditions
Bullish Breakout:
Price crosses above the latest pivot high.
With filters: Volume surge, bullish momentum, RSI > 50, price > VWAP.
Without filters: Only the crossover is needed.
Bearish Breakout:
Price crosses below the latest pivot low.
With filters: Volume surge, bearish momentum, RSI < 50, price < VWAP.
Without filters: Only the crossunder is needed.
Entries and Exits
Long: Enter on bullish breakout. Set take-profit and stop-loss. Close any short position.
Short: Enter on bearish breakout. Set take-profit and stop-loss. Close any long position.
Visuals
Signals: Green triangles (bullish) below bars, red triangles (bearish) above bars.
Pivot Levels: Green line (resistance), red line (support).
Indicators: RSI (blue, separate pane), VWAP (purple, on chart).
How to Use
Apply to a 1-second chart in TradingView for best results.
Adjust inputs (e.g., pivot bars, multipliers). Enable filters for stricter signals.
Watch for buy/sell triangles and monitor RSI/VWAP.
Use ATR-based take-profit/stop-loss for risk management.
Notes
Best on 1-second timeframe due to fast RSI and responsiveness.
Disable filters for more signals (less confirmation).
Backtest before live trading to check performance.
This strategy uses pivots, volume, momentum, RSI, and VWAP for clear breakout trades on the 1-second timeframe.
Volatility

MTF RSI + ADX + ATR SL/TP vivekDescription:
This strategy combines the power of multi-timeframe RSI filtering with ADX trend confirmation and ATR-based risk management to capture strong directional moves.
🔑 Entry Rules:
• Daily RSI > 60
• 4H RSI > 60
• 1H RSI > 60
• 10m RSI > 40
• ADX (current timeframe) > 20
When all conditions align, a long entry is triggered.
🛡 Risk Management:
• ATR-based Stop-Loss (customizable multiplier)
• Take-Profit defined as a Risk-Reward multiple of the ATR stop
🎯 Why this Strategy?
• Ensures alignment across higher timeframes before entering a trade
• Uses ADX to avoid choppy/range-bound markets
• Built-in ATR stop-loss & take-profit for disciplined risk control
• Fully customizable parameters
This strategy is designed for trend-following swing entries. It works best on liquid instruments such as indices, forex pairs, and large-cap stocks. Always optimize the parameters based on your preferred asset and timeframe.

Regime Radar — Trend vs Volatile [AlphaGroup.Live]⚡ Regime Radar — Trend vs Volatile
Markets switch personalities. Some weeks they trend relentlessly. Other times they chop, fake out, and punish breakout traders.
This tool tells you — at a glance — whether an asset is in TREND , VOLATILE , or MIXED mode across multiple timeframes.
🔑 How it works
The engine scores every timeframe on two dimensions:
Trend Score (directional persistence):
• Efficiency Ratio (straight vs noisy moves)
• Normalized ADX (directional movement strength)
• Positive autocorrelation (persistence of returns)
Volatile Score (chop / mean reversion):
• 1 − Efficiency Ratio (lack of direction)
• Frequency of outside bars (indecision candles)
• Negative autocorrelation (flip-flop behavior)
Then it compares the difference:
• TREND if Trend − Volatile > thWeak
• VOLATILE if Trend − Volatile < −thWeak
• MIXED if the difference is inside
Strength comes from how far apart the scores are:
• Strong if |diff| ≥ thStrong
• Weak if thWeak ≤ |diff| < thStrong
• Neutral if |diff| < thWeak
🖼️ What you see
• Yellow candles mark outside bars (both high & low broken) → “non-decision” events.
• A dashboard table prints your chosen timeframes with verdicts like:
5m VOLATILE Strong
15m VOLATILE Weak
1h TREND Neutral
4h TREND Weak
D VOLATILE Neutral
W TREND Strong
M TREND Strong
• Optional Bias column shows the numeric difference (Trend − Volatile).
💡 Why use it
• Spot when trend-following systems (crossovers, inside bar breakouts) are favored.
• Spot when reversal systems (RSI2, MinMax, Bollinger plays) are favored.
• Check regime alignment across intraday, swing, and macro frames.
• Avoid trading a TREND system in a VOLATILE regime (and vice versa).
⚡ Want more setups?
Get 100 battle-tested trading strategies FREE here:
👉 alphagroup.live
No excuses. No guesswork. The market tells you its regime. Listen — and adapt.
📌 Tags
trenddetection, volatility, regimefilter, trendfilter, rangetrading, meanreversion, priceaction, chartpatterns, riskmanagement, tradingdashboard, forex, crypto, stocks, scalping, swingtrading

Alpha Spread Indicator Panel - [AlphaGroup.Live]Alpha Spread Indicator Panel –
This sub-panel plots the OLS spread between two assets, normalized into percent .
• Green area = spread above zero (Buy Leg1 / Sell Leg2)
• Red area = spread below zero (Sell Leg1 / Buy Leg2)
• The white line shows the exact % deviation of the spread from its fitted baseline
• Optional ±1% and ±2% guides give clear statistical thresholds
Because it’s expressed in percent relative to midprice , the scale remains consistent even if absolute prices change over years.
⚠️ Important: This panel is designed to be used together with the overlay chart:
👉 Alpha Spread Indicator Chart –
Pre-selected asset pairs included:
EURUSD / GBPUSD
AUDUSD / NZDUSD
USDJPY / USDCHF
USDCAD / USDNOK
EURJPY / GBPJPY
AUDJPY / NZDJPY
XAUUSD / XAGUSD
WTI (USOIL) / Brent (UKOIL)
NatGas / Crude
HeatingOil / RBOB
Corn / Wheat
Platinum / Palladium
XOM / CVX
KO / PEP
V / MA
JPM / BAC
NVDA / AMD
BHP / RIO
SHEL / BP
SPY / QQQ
Want more institutional-grade setups? Get our 100 Trading Strategies eBook free at:
alphagroup.live
Tags: pairs-trading, spread-trading, statistical-arbitrage, ols-regression, zscore, mean-reversion, arbitrage, quant, hedge, alphagroup

Vertical Line - Time SpecificIf you want to draw a vertical line at a certain time , you can use this Indicator - Work with 24 hr format

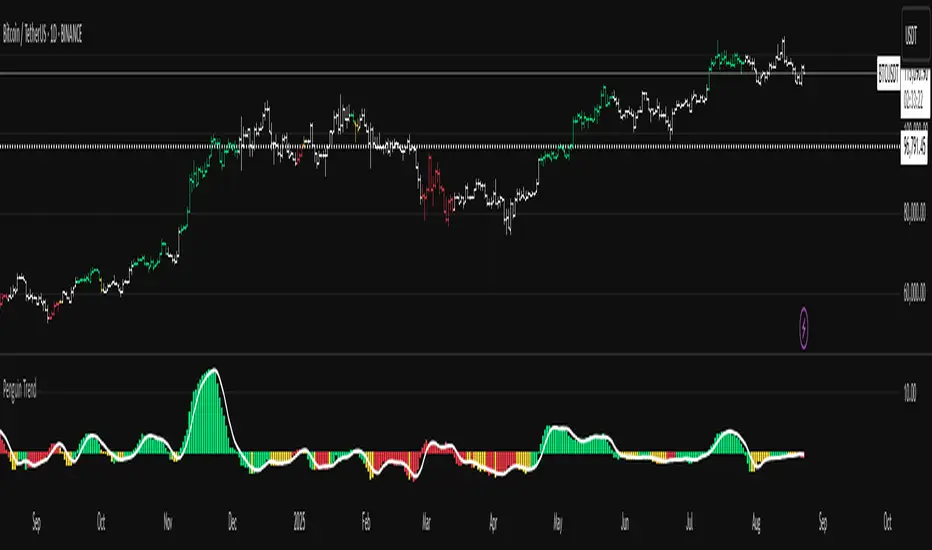
Penguin TrendMeasures the volatility regime by comparing the upper Bollinger Band to the upper Keltner Channel and colors bars with a lightweight trend state. Supports SMA/EMA/WMA/RMA/HMA/VWMA/VWAP and a selectable calculation timeframe. Default settings preserve the original look and behavior.
Penguin Trend visualizes expansion vs. compression in price action by comparing two classic volatility envelopes. It computes:
Diff% = (UpperBB − UpperKC) / UpperKC × 100
* Diff > 0: Bollinger Bands are wider than Keltner Channels -> expansion / momentum regime.
* Diff < 0: BB narrower than KC -> compression / squeeze regime.
A white “Average Difference” line smooths Diff% (default: SMA(5)) to help spot regime shifts.
Trend coloring (kept from original):
Bars are colored only when Diff > 0 to emphasize expansion phases. A lightweight trend engine defines four states using a fast/slow MA bias and a short “thrust” MA applied to ohlc4:
* Green: Bullish bias and thrust > fast MA (healthy upside thrust).
* Red: Bearish bias and thrust < fast MA (healthy downside thrust).
* Yellow: Bullish bias but thrust ≤ fast MA (pullback/weakness).
* Blue: Bearish bias but thrust ≥ fast MA (bear rally/short squeeze).
Note: By default, Blue renders as Yellow to preserve the original visual style. Enable “Use true BLUE color” if you prefer Aqua for Blue.
How it works (under the hood):
* Bollinger Bands (BB): Basis = selected MA of src (default SMA(20)). Width = StdDev × Mult (default 2.0).
* Keltner Channels (KC): Basis = selected MA of src (default SMA(20)). Width = ATR(kcATR) × Mult (defaults 20 and 2.0).
* Diff%: Safe division guards against division-by-zero.
* MA engine: You can choose SMA / EMA / WMA / RMA / HMA / VWMA / VWAP for BB/KC bases, Diff smoothing, and the trend components (VWAP is session-anchored).
* Calculation timeframe: Set “Calculation timeframe” to compute all internals on a chosen TF via request.security() while viewing any chart TF.
Inputs (key ones):
* Calculation timeframe: Empty = use chart TF; if set (e.g., 60), all internals compute on that TF.
* BB: Length, StdDev Mult, MA Type.
* KC: Basis Length, ATR Length, Multiplier, MA Type.
* Smoothing: Average Length & MA Type for the “Average Difference” line.
* Trend Engine: Fast/Slow lengths & MA type; Signal (kept for completeness); Thrust length & MA type (defaults replicate original behavior).
* Display: Paint bars only when Diff > 0; optional Zero line; optional true Blue color.
How to use:
1. Regime changes: Watch Diff% or Average Diff crossing 0. Above zero favors momentum/continuation setups; below zero suggests compression and potential breakout conditions.
2. State confirmation: Use bar colors to qualify expansion: Green/Red indicate expansion aligned with trend thrust; Yellow/Blue flag weaker/contrarian thrust during expansion.
3. Multi-timeframe analysis: Run calculations on a higher TF (e.g., H1/H4) while trading a lower TF chart to smooth noise.
Alerts:
* Diff crosses above/below 0.
* Average Diff crosses above/below 0.
* State changes: GREEN / RED / YELLOW / BLUE.
Notes & limitations:
* VWAP is session-anchored and best on intraday data. If not applicable on the selected calculation TF, the script automatically falls back to EMA.
* Default parameters (SMA(20) for BB/KC, multipliers 2.0, SMA(5) smoothing, trend logic and bar painting) preserve the original appearance.
Release notes:
v6.0 — Rewritten in Pine v6 with structured inputs and guards. Multi-MA support (SMA/EMA/WMA/RMA/HMA/VWMA/VWAP). Calculation timeframe via request.security() for multi-TF workflows. Safe division; optional zero line; optional true Blue color. Original visuals and behavior preserved by default.
License / disclaimer:
© waranyu.trkm — MIT License. Educational use only; not financial advice.
MTF RSI + ADX + ATR SL/TPThis strategy combines the power of multi-timeframe RSI filtering with ADX trend confirmation and ATR-based risk management to capture strong directional moves.
🔑 Entry Rules:
• Daily RSI > 60
• 4H RSI > 60
• 1H RSI > 60
• 10m RSI > 40
• ADX (current timeframe) > 20
When all conditions align, a long entry is triggered.
🛡 Risk Management:
• ATR-based Stop-Loss (customizable multiplier)
• Take-Profit defined as a Risk-Reward multiple of the ATR stop
🎯 Why this Strategy?
• Ensures alignment across higher timeframes before entering a trade
• Uses ADX to avoid choppy/range-bound markets
• Built-in ATR stop-loss & take-profit for disciplined risk control
• Fully customizable parameters
This strategy is designed for trend-following swing entries. It works best on liquid instruments such as indices, forex pairs, and large-cap stocks. Always optimize the parameters based on your preferred asset and timeframe.

Alpha Spread Indicator Chart - [AlphaGroup.Live]Alpha Spread Indicator Chart –
This overlay plots the two legs of a pair trade directly on the price chart .
• Leg1 is shown in teal
• Leg2 (fitted) is shown in orange
• The green/red filled area shows the distance (spread) between the two
The spread is calculated using OLS regression fitting , which keeps Leg2 scaled to Leg1 so the overlay always sticks to the chart’s price axis. When the fill turns green , the model suggests Buy Leg1 / Sell Leg2; when it turns red , it suggests Sell Leg1 / Buy Leg2.
Optional Z-Score bands help visualize statistical stretch from the mean.
⚠️ Important: To use this tool properly, you also need to install the companion script:
👉 Alpha Spread Indicator Panel –
Pre-selected asset pairs included:
EURUSD / GBPUSD
AUDUSD / NZDUSD
USDJPY / USDCHF
USDCAD / USDNOK
EURJPY / GBPJPY
AUDJPY / NZDJPY
XAUUSD / XAGUSD
WTI (USOIL) / Brent (UKOIL)
NatGas / Crude
HeatingOil / RBOB
Corn / Wheat
Platinum / Palladium
XOM / CVX
KO / PEP
V / MA
JPM / BAC
NVDA / AMD
BHP / RIO
SHEL / BP
SPY / QQQ
Ready to take your trading further? Download our free eBook with 100 trading strategies at:
alphagroup.live
Tags: pairs-trading, spread-trading, statistical-arbitrage, ols-regression, zscore, mean-reversion, arbitrage, quant, hedge, alphagroup

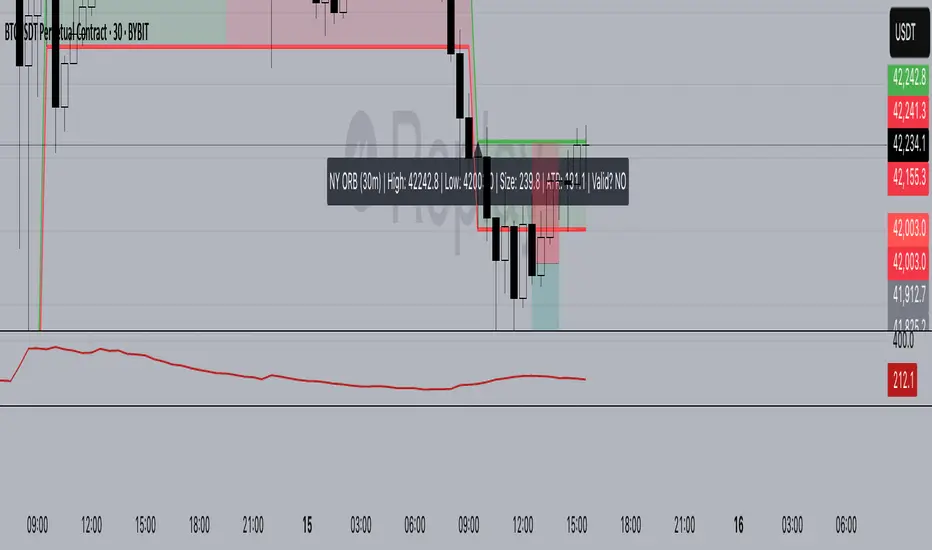
NY ORB (30m) + ATR CheckNY Open strategy
First candle at 30min NY Open @ 9:30
Mark high/low of that candle (ORB)
Make sure ATR is within 25% deviation +/-
If ATR is in harmony with the price difference of the first candle high/low
You trade the first candle close that closes above the candle high/low (ORB)

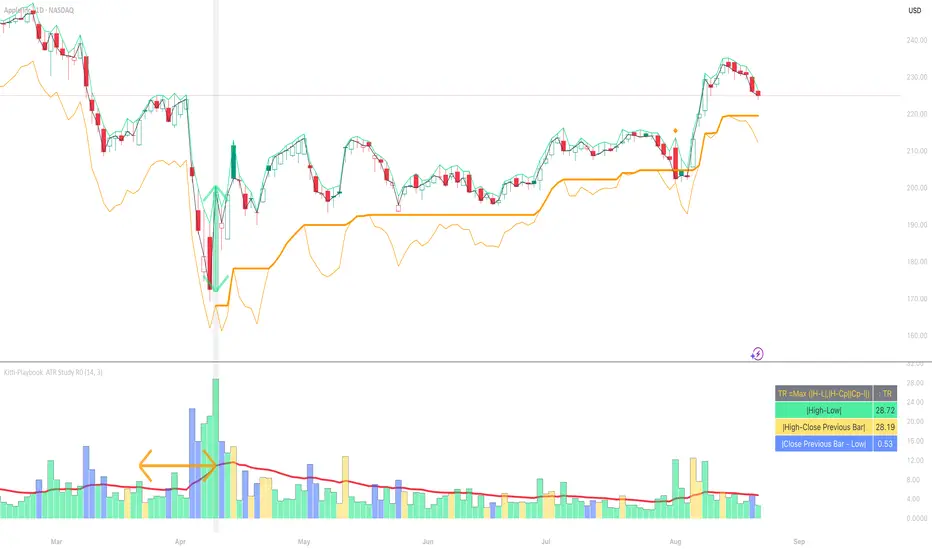
Kitti-Playbook ATR Study R0
Date : Aug 22 2025
Kitti-Playbook ATR Study R0
This is used to study the operation of the ATR Trailing Stop on the Long side, starting from the calculation of True Range.
1) Studying True Range Calculation
1.1) Specify the Bar graph you want to analyze for True Range.
Enable "Show Selected Price Bar" to locate the desired bar.
1.2) Enable/disable "Display True Range" in the Settings.
True Range is calculated as:
TR = Max (|H - L|, |H - Cp|, |Cp - L|)
• Show True Range:
Each color on the bar represents the maximum range value selected:
◦ |H - L| = Green
◦ |H - Cp| = Yellow
◦ |Cp - L| = Blue
• Show True Range on Selected Price Bar:
An arrow points to the range, and its color represents the maximum value chosen:
◦ |H - L| = Green
◦ |H - Cp| = Yellow
◦ |Cp - L| = Blue
• Show True Range Information Table:
Displays the actual values of |H - L|, |H - Cp|, and |Cp - L| from the selected bar.
2) Studying Average True Range (ATR)
2.1) Set the ATR Length in Settings.
Default value: ATR Length = 14
2.2) Enable/disable "Display Average True Range (RMA)" in Settings:
• Show ATR
• Show ATR Length from Selected Price Bar
(An arrow will point backward equal to the ATR Length)
3) Studying ATR Trailing
3.1) Set the ATR Multiplier in Settings.
Default value: ATR Multiply = 3
3.2) Enable/disable "Display ATR Trailing" in Settings:
• Show High Line
• Show ATR Bands
• Show ATR Trailing
4) Studying ATR Trailing Exit
(Occurs when the Close price crosses below the ATR Trailing line)
Enable/disable "Display ATR Trailing" in Settings:
• Show Close Line
• Show Exit Points
(Exit points are marked by an orange diamond symbol above the price bar)
NY Session First 15m Range ORB Strategy first 15m high&low NY session
let you know the high and low of first 15m and the first candle is sitck out of the line you can ride on the wave to make moeny no bul OANDA:XAUUSD SP:SPX
Previous Days High & Low RTH Session by TenAM TraderPurpose:
This indicator plots the high and low levels of previous trading days’ Regular Trading Hours (RTH), helping traders identify key support and resistance zones based on historical price action.
How to Use / Strategy:
Designed as a super simple trading strategy:
Buy when price breaks above and confirms the previous day’s high.
Sell when price breaks below and confirms the previous day’s low.
Alerts notify you when price interacts with these levels, helping traders act on confirmed breakout opportunities rather than premature moves.
*Traders can also look for reversal opportunities if price breaks back through one of the levels.
Note: Make sure RTH (Regular Trading Hours) is turned on for the chart, as the indicator is based on RTH highs and lows.
Features:
Tracks previous days’ highs and lows.
Provides clear visual reference for support and resistance.
Simple, actionable strategy based on breakout confirmations and reversal plays.
Alerts for confirmed price breaks.
Disclaimer:
This indicator is for educational and informational purposes only. It does not provide financial advice. Trading involves risk, and past performance does not guarantee future results. Users trade at their own risk.

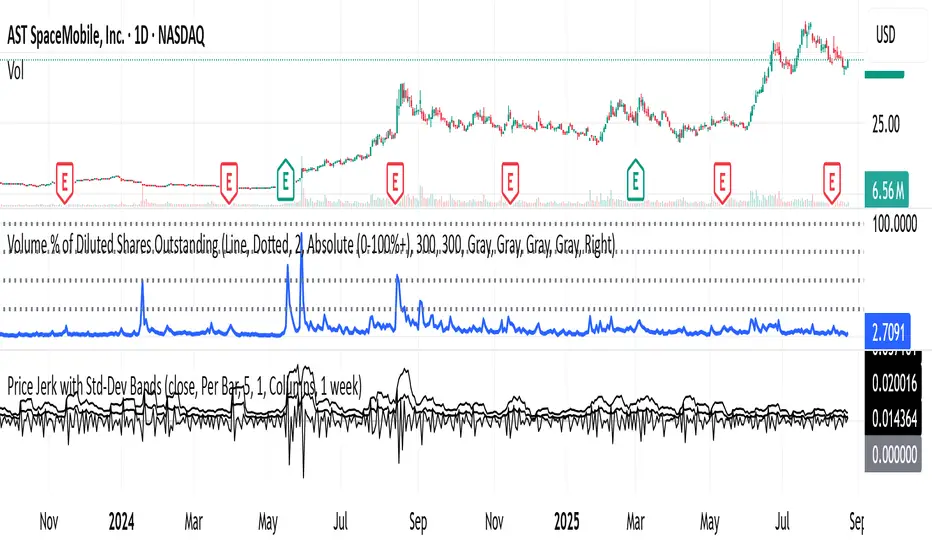
Shock Detector: Price Jerk with Std-Dev BandsDetect sudden shocks in market behaviour
This indicator measures the jerk of price – the third derivative of price with respect to time (rate of change of acceleration). It highlights sudden accelerations and decelerations in price movement that are often invisible with standard momentum or volatility indicators.
Per-bar or time-scaled derivatives (choose whether calculations are based on bars or actual seconds).
Features
Log-price option for more stable readings across different price levels.
Optional smoothing with EMA to reduce noise.
Line or column view for flexible visualization.
Standard deviation bands (±1σ and ±2σ), centered either on zero or the rolling mean.
Auto window selection (1 day to 4 weeks), adaptive to chart timeframe.
Color-coded jerk: green for positive, red for negative.
Optional filled bands for easy visual context of normal vs. extreme jerk moves.
How to Use
Use jerk to identify sudden shifts in market dynamics, where price movement is not just changing direction but changing its acceleration.
Bands help highlight when jerk values are statistically unusual compared to recent history.
Combine with trend or momentum indicators for potential early warning of breakouts, reversals, or exhaustion.
Why it’s useful
Most indicators measure price, velocity (returns), or acceleration (momentum). This goes one step further to look at jerk, giving you a tool to spot “shock” movements in the market. By framing jerk within standard deviation bands, it’s easy to see whether current moves are ordinary or exceptional.
Developed with the assistance of ChatGPT (OpenAI).
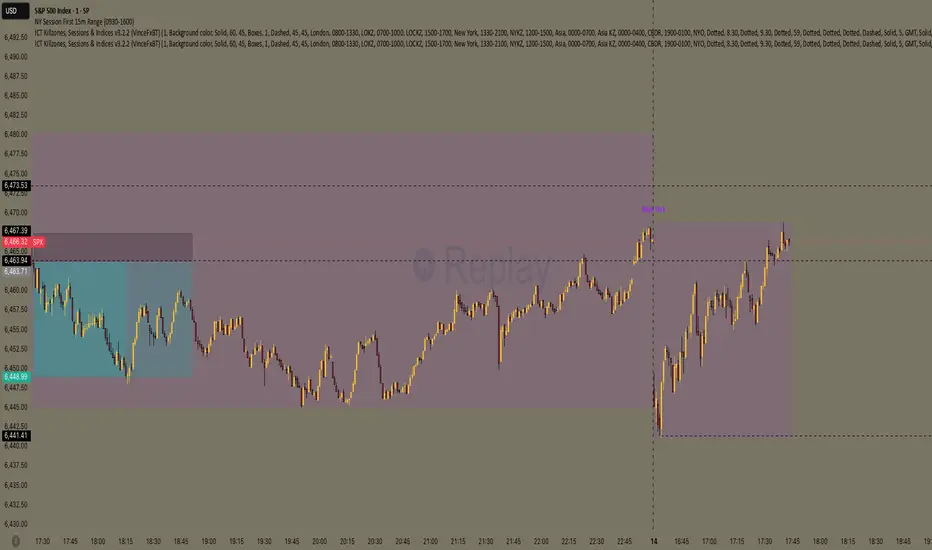
ICT Macro Time Window NYThis script highlights the typical ICT “macro” algorithm activity windows on your chart. It marks 10 minutes before to 10 minutes after each full hour, based on New York time (NY). The display is restricted to the 00:00 – 16:00 NY time range.
Overlay on chart with semi-transparent background
Automatically adjusts to the chart timeframe
Customizable: window start/end minutes, hours, and background color
Ideal for traders following ICT concepts to visually identify high-probability algorithm activity periods.

StdDev Supply/Demand Zone RefinerThis indicator uses standard deviation bands to identify statistically significant price extremes, then validates these levels through volume analysis and market structure. It employs a proprietary "Zone Refinement" technique that dynamically adjusts zones based on price interaction and volume concentration, creating increasingly precise support/resistance areas.
Key Features:
Statistical Extremes Detection: Identifies when price reaches 2+ standard deviations from mean
Volume-Weighted Zone Creation: Only creates zones at extremes with abnormal volume
Dynamic Zone Refinement: Automatically tightens zones based on touch points and volume nodes
Point of Control (POC) Identification: Finds the exact price with maximum volume within each zone
Volume Profile Visualization: Shows horizontal volume distribution to identify key liquidity levels
Multi-Factor Validation: Combines volume imbalance, zone strength, and touch count metrics
Unlike traditional support/resistance indicators that use arbitrary levels, this system:
Self-adjusts based on market volatility (standard deviation)
Refines zones through machine-learning-like feedback from price touches
Weights by volume to show where real money was positioned
Tracks zone decay - older, untested zones automatically fade

Momentum Breakout StrategyBacktest a strategy where, when a candlestick on a timeframe rises more than a certain %, it enters a trade.

Overnight Gap Dominance Indicator (OGDI)The Overnight Gap Dominance Indicator (OGDI) measures the relative volatility of overnight price gaps versus intraday price movements for a given security, such as SPY or SPX. It uses a rolling standard deviation of absolute overnight percentage changes divided by the standard deviation of absolute intraday percentage changes over a customizable window. This helps traders identify periods where overnight gaps predominate, suggesting potential opportunities for strategies leveraging extended market moves.
Instructions
A
pply the indicator to your TradingView chart for the desired security (e.g., SPY or SPX).
Adjust the "Rolling Window" input to set the lookback period (default: 60 bars).
Modify the "1DTE Threshold" and "2DTE+ Threshold" inputs to tailor the levels at which you switch from 0DTE to 1DTE or multi-DTE strategies (default: 0.5 and 0.6).
Observe the OGDI line: values above the 1DTE threshold suggest favoring 1DTE strategies, while values above the 2DTE+ threshold indicate multi-DTE strategies may be more effective.
Use in conjunction with low VIX environments and uptrend legs for optimal results.

KAMA Trend Flip - SightLing LabsBuckle up, traders—this open-source KAMA Trend Flip indicator is your ticket to sniping trend reversals with a Kaufman Adaptive Moving Average (KAMA) that’s sharper than a Wall Street shark’s tooth. No voodoo, no fluff—just raw, volatility-adaptive math that dances with the market’s rhythm. It zips through trending rockets and chills in choppy waters, slashing false signals like a samurai. Not laggy like the others - this thing is the real deal!
Core Mechanics:
• Efficiency Ratio (ER): Reads the market’s pulse (0-1). High ER = turbo-charged MA, low ER = smooth operator.
• Adaptive Smoothing: Mixes fast (default power 2) and slow (default 30) constants to match market mood swings.
• Trend Signals: KAMA climbs = blue uptrend (bulls run wild). KAMA dips = yellow downtrend (bears take over). Flat = gray snooze-fest.
• Alerts: Instant pings on flips—“Trend Flip Up” for long plays, “Down” for shorts. Plug into bots for set-and-forget domination.
Why It Crushes:
• Smokes static MAs in volatile arenas (crypto, stocks, you name it). Backtests show 20-30% fewer fakeouts than SMA50.
• Visual Pop: Overlays price with bold blue/yellow signals. Slap it on BTC 1D to see trends light up like Times Square.
• Tweakable: Dial ER length (default 50) to your timeframe. Short for scalps, long for swing trades.
Example Settings in Action:
• 10s Chart (Hyper-Scalping): Set Source: Close, ER Length: 100, Fast Power: 1, Slow Power: 6. Catches micro-trends in crypto like a heat-seeking missile. Blue/yellow flips scream entry/exit on fast moves.
• 2m Chart (Quick Trades): Set Source: Close, ER Length: 14, Fast Power: 1, Slow Power: 6. Perfect for rapid trend shifts in stocks or forex. Signals align with momentum bursts—check historical flips for proof.
Deployment:
• Drop it on any chart. Backtest settings to match your asset’s volatility—tweak until it sings.
• Pair with RSI or volume spikes for killer confirmation. Pro move: Enter on flip + volume pop, exit on reverse.
• Strategy-Ready: Slap long/short logic on alerts to build a lean, mean trading machine.
Open source from SightLing Labs—grab it, hack it, profit from it. Share your tweaks in the comments and let’s outsmart the market together. Trade hard, win big!
FlowStateTrader FlowState Trader - Advanced Time-Filtered Strategy
## Overview
FlowState Trader is a sophisticated algorithmic trading strategy that combines precision entry signals with intelligent time-based filtering and adaptive risk management. Built for traders seeking to achieve their optimal performance state, FlowState identifies high-probability trading opportunities within user-defined time windows while employing dynamic trailing stops and partial position management.
## Core Strategy Philosophy
FlowState Trader operates on the principle that peak trading performance occurs when three elements align: **Focus** (precise entry signals), **Flow** (optimal time windows), and **State** (intelligent position management). This strategy excels at finding reversal opportunities at key support and resistance levels while filtering out suboptimal trading periods to keep traders in their optimal flow state.
## Key Features
### 🎯 Focus Entry System
**Support/Resistance Zone Trading**:
- Dynamic identification of key price levels using configurable lookback periods
- Entry signals triggered when price interacts with these critical zones
- Volume confirmation ensures genuine breakout/reversal momentum
- Trend filter alignment prevents counter-trend disasters
**Entry Conditions**:
- **Long Signals**: Price closes above support buffer, touches support level, with above-average volume
- **Short Signals**: Price closes below resistance buffer, touches resistance level, with above-average volume
- Optional trend filter using EMA or SMA for directional bias confirmation
### ⏰ FlowState Time Filtering System
**Comprehensive Time Controls**:
- **12-Hour Format Trading Windows**: User-friendly AM/PM time selection
- **Multi-Timezone Support**: UTC, EST, PST, CST with automatic conversion
- **Day-of-Week Filtering**: Trade only weekdays, weekends, or both
- **Lunch Hour Avoidance**: Automatically skips low-volume lunch periods (12-1 PM)
- **Visual Time Indicators**: Background coloring shows active/inactive trading periods
**Smart Time Features**:
- Handles overnight trading sessions seamlessly
- Prevents trades during historically poor performance periods
- Customizable trading hours for different market sessions
- Real-time trading window status in dashboard
### 🛡️ Adaptive Risk Management
**Multi-Level Take Profit System**:
- **TP1**: First profit target with optional partial position closure
- **TP2**: Final profit target for remaining position
- **Flexible Scaling**: Choose number of contracts to close at each level
**Dynamic Trailing Stop Technology**:
- **Three Operating Modes**:
- **Conservative**: Earlier activation, tighter trailing (protect profits)
- **Balanced**: Optimal risk/reward balance (recommended)
- **Aggressive**: Later activation, wider trailing (let winners run)
- **ATR-Based Calculations**: Adapts to current market volatility
- **Automatic Activation**: Engages when position reaches profitability threshold
### 📊 Intelligent Position Sizing
**Contract-Based Management**:
- Configurable entry quantity (1-1000 contracts)
- Partial close quantities for profit-taking
- Clear position tracking and P&L monitoring
- Real-time position status updates
### 🎨 Professional Visualization
**Enhanced Chart Elements**:
- **Entry Zone Highlighting**: Clear visual identification of trading opportunities
- **Dynamic Risk/Reward Lines**: Real-time TP and SL levels with price labels
- **Trailing Stop Visualization**: Live tracking of adaptive stop levels
- **Support/Resistance Lines**: Key level identification
- **Time Window Background**: Visual confirmation of active trading periods
**Dual Dashboard System**:
- **Strategy Dashboard**: Real-time position info, settings status, and current levels
- **Performance Scorecard**: Live P&L tracking, win rates, and trade statistics
- **Customizable Sizing**: Small, Medium, or Large display options
### ⚙️ Comprehensive Customization
**Core Strategy Settings**:
- **Lookback Period**: Support/resistance calculation period (5-100 bars)
- **ATR Configuration**: Period and multipliers for stops/targets
- **Reward-to-Risk Ratios**: Customizable profit target calculations
- **Trend Filter Options**: EMA/SMA selection with adjustable periods
**Time Filter Controls**:
- **Trading Hours**: Start/end times in 12-hour format
- **Timezone Selection**: Four major timezone options
- **Day Restrictions**: Weekend-only, weekday-only, or unrestricted
- **Session Management**: Lunch hour avoidance and custom periods
**Risk Management Options**:
- **Trailing Stop Modes**: Conservative/Balanced/Aggressive presets
- **Partial Close Settings**: Enable/disable with custom quantities
- **Alert System**: Comprehensive notifications for all trade events
### 📈 Performance Tracking
**Real-Time Metrics**:
- Net profit/loss calculation
- Win rate percentage
- Profit factor analysis
- Maximum drawdown tracking
- Total trade count and breakdown
- Current position P&L
**Trade Analytics**:
- Winner/loser ratio tracking
- Real-time performance scorecard
- Strategy effectiveness monitoring
- Risk-adjusted return metrics
### 🔔 Alert System
**Comprehensive Notifications**:
- Entry signal alerts with price and quantity
- Take profit level hits (TP1 and TP2)
- Stop loss activations
- Trailing stop engagements
- Position closure notifications
## Strategy Logic Deep Dive
### Entry Signal Generation
The strategy identifies high-probability reversal points by combining multiple confirmation factors:
1. **Price Action**: Looks for price interaction with key support/resistance levels
2. **Volume Confirmation**: Ensures sufficient market interest and liquidity
3. **Trend Alignment**: Optional filter prevents counter-trend positions
4. **Time Validation**: Only trades during user-defined optimal periods
5. **Zone Analysis**: Entry occurs within calculated buffer zones around key levels
### Risk Management Philosophy
FlowState Trader employs a three-tier risk management approach:
1. **Initial Protection**: ATR-based stop losses set at strategy entry
2. **Profit Preservation**: Trailing stops activate once position becomes profitable
3. **Scaled Exit**: Partial profit-taking allows for both security and potential
### Time-Based Edge
The time filtering system recognizes that not all trading hours are equal:
- Avoids low-volume, high-spread periods
- Focuses on optimal liquidity windows
- Prevents trading during news events (lunch hours)
- Allows customization for different market sessions
## Best Practices and Optimization
### Recommended Settings
**For Scalping (1-5 minute charts)**:
- Lookback Period: 10-20
- ATR Period: 14
- Trailing Stop: Conservative mode
- Time Filter: Major session hours only
**For Day Trading (15-60 minute charts)**:
- Lookback Period: 20-30
- ATR Period: 14-21
- Trailing Stop: Balanced mode
- Time Filter: Extended trading hours
**For Swing Trading (4H+ charts)**:
- Lookback Period: 30-50
- ATR Period: 21+
- Trailing Stop: Aggressive mode
- Time Filter: Disabled or very broad
### Market Compatibility
- **Forex**: Excellent for major pairs during active sessions
- **Stocks**: Ideal for liquid stocks during market hours
- **Futures**: Perfect for index and commodity futures
- **Crypto**: Effective on major cryptocurrencies (24/7 capability)
### Risk Considerations
- **Market Conditions**: Performance varies with volatility regimes
- **Timeframe Selection**: Lower timeframes require tighter risk management
- **Position Sizing**: Never risk more than 1-2% of account per trade
- **Backtesting**: Always test on historical data before live implementation
## Educational Value
FlowState serves as an excellent learning tool for:
- Understanding support/resistance trading
- Learning proper time-based filtering
- Mastering trailing stop techniques
- Developing systematic trading approaches
- Risk management best practices
## Disclaimer
This strategy is for educational and informational purposes only. Past performance does not guarantee future results. Trading involves substantial risk of loss and is not suitable for all investors. Users should thoroughly backtest the strategy and understand all risks before live trading. Always use proper position sizing and never risk more than you can afford to lose.
---
*FlowState Trader represents the evolution of systematic trading - combining classical technical analysis with modern risk management and intelligent time filtering to help traders achieve their optimal performance state through systematic, disciplined execution.*

Realized Volatility (StdDev of Returns, %)📌 Realized Volatility (StdDev of Returns, %)
This indicator measures realized volatility directly from price returns, instead of the common but misleading approach of calculating standard deviation around a moving average.
🔹 How it works:
Computes close-to-close log returns (the most common way volatility is measured in finance).
Calculates the standard deviation of these returns over a chosen lookback period (default = 200 bars).
Converts results into percentages for easier interpretation.
Provides three key volatility measures:
Daily Realized Vol (%) – raw standard deviation of returns.
Annualized Vol (%) – scaled by √250 trading days (market convention).
Horizon Vol (%) – volatility over a custom horizon (default = 5 days, i.e. weekly).
🔹 Why use this indicator?
Shows true realized volatility from historical returns.
More accurate than measuring deviation around a moving average.
Useful for traders analyzing risk, position sizing, and comparing realized vs implied volatility.
⚠️ Note:
It is best used on the Daily Chart!
By default, this uses log returns (which are additive and standard in quant finance).
If you prefer, you can easily switch to simple % returns in the code.
Volatility estimates depend on your chosen lookback length and may vary across timeframes.

Range Percent Histogram📌 Range Percent Histogram – Indicator Description
The Range Percent Histogram is a custom indicator that behaves like a traditional volume histogram, but instead of showing traded volume it displays the percentage range of each candle.
In other words, the height of each bar represents how much the price moved (in percentage terms) within that candle, from its low to its high.
🔧 What it shows
The indicator has two main components:
Component Description
Histogram Bars Columns plotted in red or green depending on the candle direction (green = bullish candle, red = bearish). The height of each bar = (high - low) / low * 100. That means a candle that moved, for example, 1 % from its lowest point to its highest point will show a bar with 1 % height.
Moving Average (optional) A 20-period Simple Moving Average applied directly to the bar values. It can be turned ON/OFF via a checkbox and helps you detect whether current range activity is above or below the average range of the past candles.
⚙️ How it works
Every time a new candle closes, the indicator calculates its range and converts it into a percentage.
This value is drawn as a column under the chart.
If the closing price is above the opening price → the bar is green (bullish range).
If the closing price is below the opening price → the bar is red (bearish range).
When the Show Moving Average option is enabled, a smooth line is plotted on top of the histogram representing the average percentage range of the last 20 candles.
📈 How to use it
This indicator is very helpful for detecting moments of range expansion or contraction.
One powerful way to use it is similar to a volume exhaustion / low-volume pattern:
Situation Interpretation
Consecutive bars with very low height Price is in a period of low volatility → possible accumulation or "pause" phase.
A sudden large bar after a series of small ones Indicates a strong pickup in volatility → often marks the start of a new impulse in the direction of the breakout.

Volatility Squeeze (Bollinger BW + 16 SMA + 8 EMA of 16 SMA )Can't take any credit for this, thank you Steve Strazza for putting me on to this
