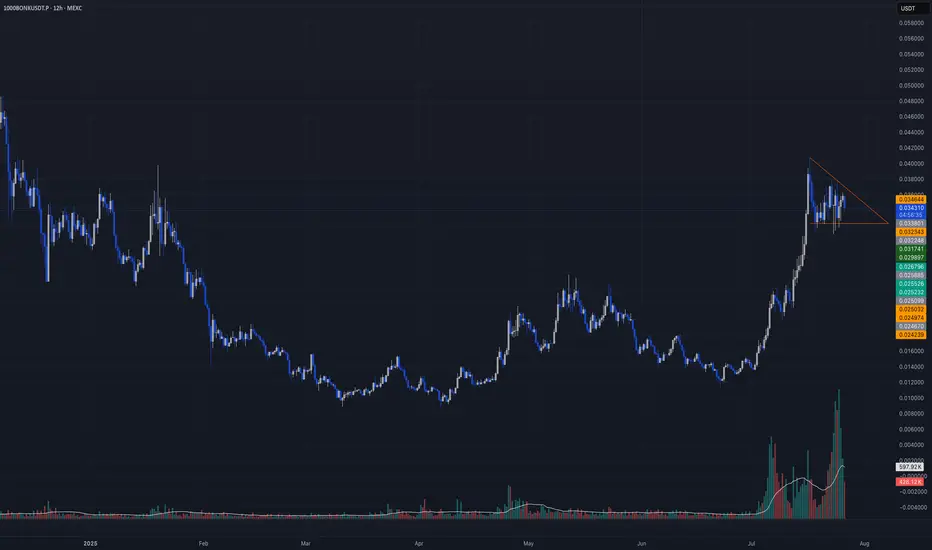
LONG Setup | Breakout or Retest Entry AheadTeam, I’m eyeing a solid continuation setup on 1000BONKUSDT.P. After a strong move up, price is currently consolidating in a textbook bullish pennant on the 12H timeframe. This is typically a continuation pattern, and all signs point to a potential breakout or a deeper retest before the next leg hig
Bonk USDT Buy / Long SetupBonk performing well among all meme sectors, wait for the entry and take risk, if tp hits first then ignore. I already shared this setup on my group, we closed the trade at minor profit, but now this is showing strong momentum on 1hr tf also, that's why sharing.

BONK - Sentiment and Chart shows bullish signal!Technical Analysis
First, let's lock in our view of the chart. The daily chart for 1000BONKUSDT shows a very strong, sustained uptrend, particularly throughout July. After hitting a recent peak just above $0.040, the price has undergone a healthy retracement.
It has now pulled back to the $0.034 le

Bonk Buy program activatedBeen holding it in spot due to it's history of quick and fast moves. It is promising; will sell at 0.040, then buy again on the retest something around 0.025. The long term target is a new ATH. Then again will short it to 0.50 fib exactly; where it will be in excellent sideways for sculping.
My ave

1000BONK/USDT - New ATH!!Lately, 1000BONK has been gaining significant attention across the market, supported by a rapidly growing and engaged community. After a liquidity grab below 0.015 1000BONK is now gearing up for its next leg up, with clear potential to target a new all-time high (ATH).

$1000BONK/USDT – 1H Chart AnalysisCurrently testing the downtrend resistance (green line) and showing signs of consolidation near $0.0143. Watching for a breakout or breakdown from this key level.
Key Levels:
Support: $0.014202 (blue), $0.014551 (yellow zone)
Resistance TP1: $0.015794
Resistance TP2: $0.017997
Scenarios:
🟩 Bu

$BONK Breakout ConfirmedSEED_DONKEYDAN_MARKET_CAP:BONK Breakout Confirmed
The $1000BONKUSDT 1D chart shows a breakout from a long-term downtrend followed by a successful retest of the key support zone around $0.016390.
This area, previously resistant, is now acting as strong support.
If it holds, BONK could rally up

1000Bonk Day Trading SetupIf you see price starts consolidation at the poi, or see any 5m big green candle then enter with proper SL, will update trade should be closed or not.

$BONK just broke out SEED_DONKEYDAN_MARKET_CAP:BONK just broke out of a long downtrend after a double bottom
- Retesting support at $0.016 holding strong.
- Target: $0.061 (+278%)

BONKE Set to Surge: Big Pump Incoming! (12H)At the top of the chart, there is a liquidity pool that is expected to be swept soon.
There are two bullish iCHs visible on the chart, along with a double bottom pattern. The descending trendline has also been broken.
If the Key Level support holds, the price could move toward the red box area.
A

See all ideas
Summarizing what the indicators are suggesting.
Oscillators
Neutral
SellBuy
Strong sellStrong buy
Strong sellSellNeutralBuyStrong buy
Oscillators
Neutral
SellBuy
Strong sellStrong buy
Strong sellSellNeutralBuyStrong buy
Summary
Neutral
SellBuy
Strong sellStrong buy
Strong sellSellNeutralBuyStrong buy
Summary
Neutral
SellBuy
Strong sellStrong buy
Strong sellSellNeutralBuyStrong buy
Summary
Neutral
SellBuy
Strong sellStrong buy
Strong sellSellNeutralBuyStrong buy
Moving Averages
Neutral
SellBuy
Strong sellStrong buy
Strong sellSellNeutralBuyStrong buy
Moving Averages
Neutral
SellBuy
Strong sellStrong buy
Strong sellSellNeutralBuyStrong buy
Displays a symbol's price movements over previous years to identify recurring trends.