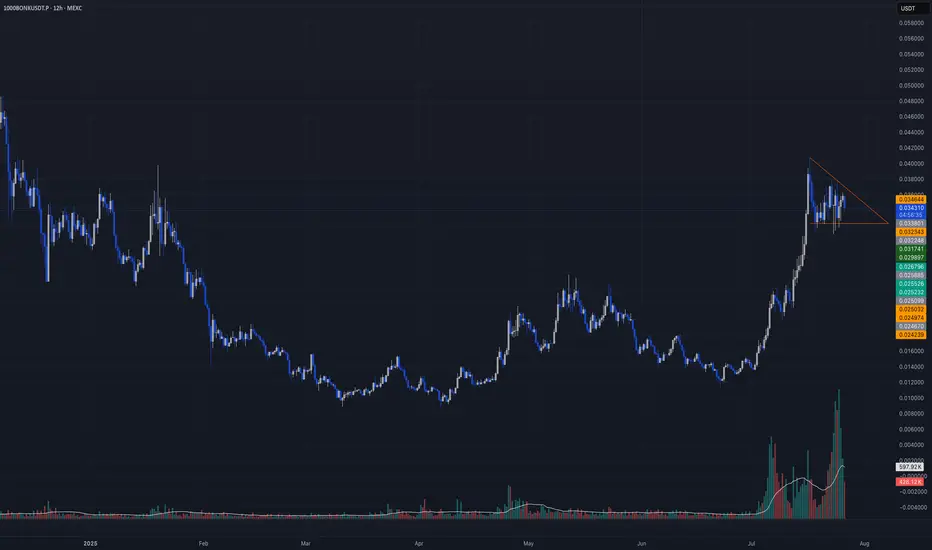
LONG Setup | Breakout or Retest Entry AheadTeam, I’m eyeing a solid continuation setup on 1000BONKUSDT.P. After a strong move up, price is currently consolidating in a textbook bullish pennant on the 12H timeframe. This is typically a continuation pattern, and all signs point to a potential breakout or a deeper retest before the next leg higher.
Momentum has cooled off a bit (as expected), and RSI is resetting — which is exactly what we want before a clean move.
🎯 My Plan (Two Entry Options):
1. Breakout Entry
• 🔹 Entry: 0.03780 – 0.03820 (wait for breakout candle close or strong impulse)
• 🎯 Targets:
• TP1: 0.04250
• TP2: 0.04900
• TP3: 0.06000
• 🛡️ Stop-loss: 0.03550 (just below the structure)
2. Retest Entry (More Conservative)
• 🔹 Entry: 0.03280 – 0.03340 (support zone from previous consolidation)
• 🎯 Same targets
• 🛡️ Stop-loss: 0.03150
🔍 Why I’m Taking This Trade:
• Clean bullish structure on all higher timeframes.
• Volume confirms accumulation; no signs of panic selling.
• RSI has room to climb again after a healthy reset.
• Market is holding strong above key support zones.
🧠 As always, manage your risk. I’ll be scaling in based on confirmation and watching BTC for correlation. This setup has potential for continuation — don’t rush, let the market come to you.
Stay sharp.
— Candle Craft
1000BONKUSDT.PS trade ideas
Meme Coin Liquidity Trap📣 Hey CandleCraft fam, remember this one?
We nailed the previous BONK long — while it didn’t tag the absolute top, it delivered us a clean, sharp profit right out of the gate. Now? The story has flipped. Meme energy is fading, funding flipped, and the structure’s screaming reversal. Let’s see how this short idea plays out. 🐶💨
The dog barked loud — BONK went full meme mode with a 203% pump… but now it’s giving off that “walk of shame” energy. 🐶 RSI tanked, funding flipped, and it’s bleeding liquidity. Who let the dogs out? Probably market makers.
🔥 TRADE SETUP
Bias: Short
Strategy: Meme Coin Liquidity Trap
Entry: $0.0000355 – $0.0000370
SL: $0.0000400
TPs: $0.000030, $0.000025, $0.000020
Why?
– Overextended meme coin pullback
– Funding rate negative = longs bleeding
– OI down 35%, RSI from 85 → sub-50
– Price hovering under 20-day EMA support
Candle Craft | Signal. Structure. Execution.

BONK - Sentiment and Chart shows bullish signal!Technical Analysis
First, let's lock in our view of the chart. The daily chart for 1000BONKUSDT shows a very strong, sustained uptrend, particularly throughout July. After hitting a recent peak just above $0.040, the price has undergone a healthy retracement.
It has now pulled back to the $0.034 level. This is a critical support zone. As we identified, this level was the peak of the rally in late May, and the price is now retesting it. The small green fractal arrows on the chart confirm these previous swing highs. The price is currently consolidating right on this old resistance level, which we anticipate will now act as new support. This is a textbook setup for our strategy, making it a prime candidate for an immediate long entry.
Sentiment and Fundamental Analysis
Now, let's analyze the news to see if the market sentiment supports our bullish technical view.
"LetsBONK Allocates Revenue Share for Token Buybacks in BONK Ecosystem" (11 hours ago): This is fundamentally very bullish. Token buybacks are a powerful mechanism. They use project revenue to purchase tokens from the open market, which reduces the circulating supply and can create sustained buying pressure. It also signals the team's confidence in the token's value.
"Meme News: Supercycle Loading? Pengu and Bonk Lead in Sea of Green" (5 days ago): This headline frames BONK as a leader in the meme coin sector, which is currently experiencing strong positive momentum (a "Supercycle"). This is bullish as it attracts trend-following traders and highlights BONK's relative strength.
"Bonk News: Why is BONK's price up today?" (6 days ago): This article, published during the recent rally, reinforces the positive price action and likely explains the bullish momentum we've seen. It contributes to the overall bullish sentiment.
The sentiment is clearly bullish. The most recent and significant piece of news is about token buybacks, which is a strong fundamental driver for price appreciation. This aligns perfectly with the technical setup of the price holding at a key support level.
The Trade Plan: 1000BONKUSDT (Long)
The plan is set. We're entering a long position with a market entry now, around $0.0345.
Entering a long position as the price retraces to a major support level ($0.034) where old resistance is flipping into new support. The entry is supported by strong bullish news, particularly the announcement of token buybacks.
Stop Loss (SL): $0.0295
This level is safely below the entire support structure and below the recent swing low of this pullback. A break below $0.030 would invalidate our trade thesis. Placing the SL at $0.0295 protects us from a failed support scenario.
Take Profit 1 (TP1): $0.0415 (Moonbag Target)
This target is just above the recent all-time high. It's the most logical first target where the price will prove the uptrend is continuing.
At TP1, we take initial profits and move the trailing stop to our entry price (~$0.0345) to make the rest of the trade risk-free.
Take Profit 2 (TP2): $0.0520
This represents a measured move projection and aligns with the 1.272 Fibonacci extension from the previous range. It's a common target after a new all-time high is made.
When TP2 is hit, move the trailing stop up to the TP1 level ($0.0415) to lock in profits.
Take Profit 3 (TP3): $0.0600
This is a major psychological round number and aligns with the 1.618 Fibonacci extension, a key target in price discovery mode.
When TP3 is hit, move the trailing stop up to the TP2 level ($0.0520).
Take Profit 4 (TP4): $0.0750 (Final Target)
This is our optimistic "blue sky" target. In a strong meme coin rally fueled by buybacks, prices can often run much further than expected. $0.075 represents a significant milestone.
Close all remaining positions.
Conclusion:
The 1000BONKUSDT long trade is a high-quality setup where the technicals and fundamentals are in strong alignment. The risk is clearly defined, and the profit targets offer excellent potential. The plan is ready to be executed.

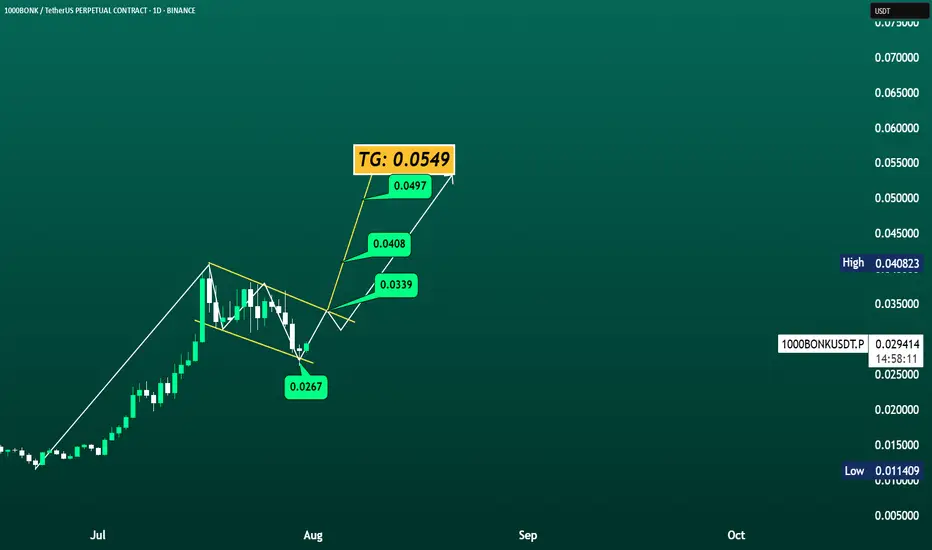
1000BONK - Bull Flag in Play1000BONK/USDT Overview (1D Chart)
1000BONK has completed a falling wedge breakout from the 0.0267 low and is showing bullish momentum. Key resistance levels to watch are:
📌 0.0339
📌 0.0408
📌 0.0497
🎯 Target: 0.054
Bonk USDT Buy / Long SetupBonk performing well among all meme sectors, wait for the entry and take risk, if tp hits first then ignore. I already shared this setup on my group, we closed the trade at minor profit, but now this is showing strong momentum on 1hr tf also, that's why sharing.

Is it a time for BONK? 40% potential profit - 0.035 USD TARGETOn the 4-hour chart of the 1000BONK/USDT pair, we can observe a corrective phase following a strong prior bullish impulse, which peaked around the 0.041 USDT level. Currently, the price is in a consolidation zone after a sharp downward move, but there are early signs of a potential trend reversal.
Key observations:
Support and rebound: The price has stabilized around the 0.012 level and is starting to form a local bottom, which may suggest exhaustion of selling pressure.
Moving Averages (MA): The price is attempting to break above the short-term moving average (green line), which could signal the beginning of a trend reversal. A break above this level and a test of the longer-term moving average (red line) in the 0.018–0.020 range would be an important bullish confirmation.
Momentum (bottom indicator – WaveTrend/WT): The WT oscillator indicates oversold conditions (below -50), and the lines are starting to curve upward, which often precedes upward moves.
Bullish scenario:
If the current consolidation proves to be an accumulation phase and the price breaks through the nearest resistance in the 0.018–0.020 range, a move toward 0.035 is possible. This level corresponds to a previous consolidation zone and acts as a local resistance area. Such a move would align with a technical rebound following the strong decline and would represent a retest of the equilibrium zone from the end of July.
Potential TP: 0.035 USD

Bonk Buy program activatedBeen holding it in spot due to it's history of quick and fast moves. It is promising; will sell at 0.040, then buy again on the retest something around 0.025. The long term target is a new ATH. Then again will short it to 0.50 fib exactly; where it will be in excellent sideways for sculping.
My average buy now is 0.032
Note: not financial advice

1000BONK/USDT - New ATH!!Lately, 1000BONK has been gaining significant attention across the market, supported by a rapidly growing and engaged community. After a liquidity grab below 0.015 1000BONK is now gearing up for its next leg up, with clear potential to target a new all-time high (ATH).

$1000BONK/USDT – 1H Chart AnalysisCurrently testing the downtrend resistance (green line) and showing signs of consolidation near $0.0143. Watching for a breakout or breakdown from this key level.
Key Levels:
Support: $0.014202 (blue), $0.014551 (yellow zone)
Resistance TP1: $0.015794
Resistance TP2: $0.017997
Scenarios:
🟩 Bullish: A confirmed breakout above the downtrend and TP1 zone could lead to a rally toward TP2.
🟨 Neutral: Sideways movement between $0.0145 and $0.0158 suggests accumulation before the next move.
🟥 Bearish: Rejection from the resistance zone and a breakdown below $0.0145 may lead to further downside.
📊 Volume and structure suggest a breakout is likely soon.
🔔 Set alerts around $0.0158 and $0.0145 for breakout confirmation or failure.

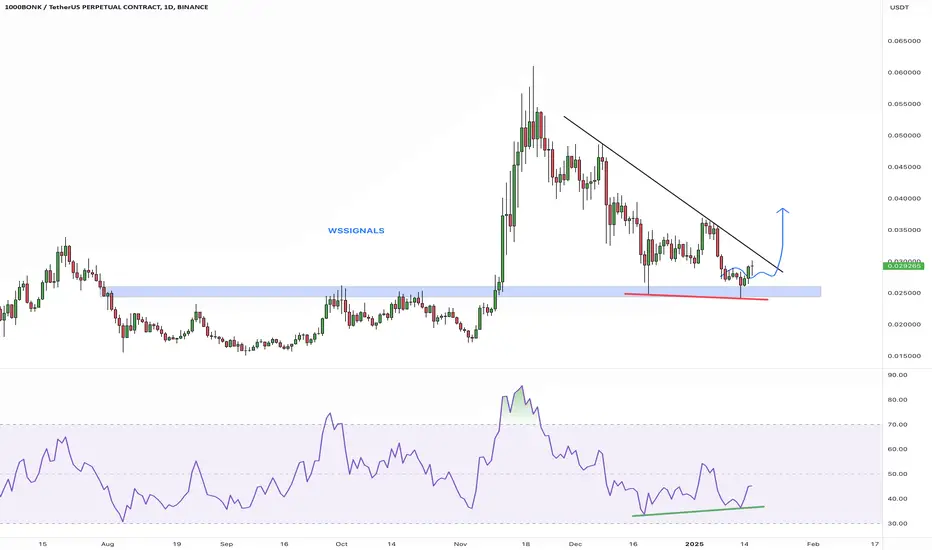
$BONK Breakout ConfirmedSEED_DONKEYDAN_MARKET_CAP:BONK Breakout Confirmed
The $1000BONKUSDT 1D chart shows a breakout from a long-term downtrend followed by a successful retest of the key support zone around $0.016390.
This area, previously resistant, is now acting as strong support.
If it holds, BONK could rally up to $0.040830, a potential 150% upside.
Invalidation occurs on a clean break below the support zone. Structure remains bullish for now.
DYRO, NFA

1000Bonk Day Trading SetupIf you see price starts consolidation at the poi, or see any 5m big green candle then enter with proper SL, will update trade should be closed or not.

$BONK just broke out SEED_DONKEYDAN_MARKET_CAP:BONK just broke out of a long downtrend after a double bottom
- Retesting support at $0.016 holding strong.
- Target: $0.061 (+278%)

BONKE Set to Surge: Big Pump Incoming! (12H)At the top of the chart, there is a liquidity pool that is expected to be swept soon.
There are two bullish iCHs visible on the chart, along with a double bottom pattern. The descending trendline has also been broken.
If the Key Level support holds, the price could move toward the red box area.
A daily candle close below the Key Level would invalidate this analysis.
For risk management, please don't forget stop loss and capital management
When we reach the first target, save some profit and then change the stop to entry
Comment if you have any questions
Thank You

1000BONKUSDT: Ready for a Breakout?
🔥 **1000BONKUSDT.P** has been consolidating under resistance for a long time, accumulating liquidity. The price has tested **0.017630 USDT** multiple times, and whales are clearly building positions. The question is: will we see a breakout, or will there be another dip before the pump?
---
🔑 **Key Levels:**
**Support:**
**0.017630 USDT** — Major demand zone. A breakdown below this level could trigger further declines.
**0.016800 USDT** — Last defense for bulls to maintain the uptrend.
**Resistance:**
**0.018481 USDT** — Initial liquidity zone, where a local rejection may occur.
**0.019000 USDT** — Key level that, if broken, opens the way to 0.020 USDT.
**0.024379 USDT** — Ultimate target where large players might start taking profits.
---
🚀 **Trading Strategy:**
**Entry Points:**
- Long upon breakout of **0.018481 USDT**, confirmed by volume increase.
- Alternative entry on a retest of **0.017630 USDT**, provided support volumes increase.
**Stop-Loss:**
- Below **0.016800 USDT** to avoid liquidity grabs before the potential move up.
**Take-Profit Targets:**
**0.019000 USDT** — Partial profit-taking, securing position.
**0.020000 USDT** — Major target if momentum follows through.
**0.024379 USDT** — Ideal scenario if a strong impulse move occurs.
---
📈 **Market Analysis:**
Price has been consolidating near resistance, suggesting an impending breakout.
Large orders in the order book indicate whale activity.
Volume is starting to pick up, signaling a potential phase transition.
---
💡 **Conclusion:**
1000BONKUSDT.P is at a decisive moment. A confirmed breakout above **0.018481 USDT** could lead to a strong bullish move. However, if another fakeout and dump happen, it's time to reassess. What’s your take—ready for the pump? 🚀💬

Bonk will go bonkers nextRemember to be careful. BTC should have broken the resistance by now. as time goes on we are slowly going from bullish to bearish.
Good luck

Identifying Fakeouts and Enhancing Risk Management in TradingEducational Purpose:
This tutorial aims to educate traders on identifying fakeouts, understanding their characteristics, and improving risk management strategies to avoid common pitfalls.
Key Educational Points:
1. What is a Fakeout?
A fakeout occurs when the price temporarily breaks a key support or resistance level but fails to sustain the move, reversing quickly. It often traps traders who enter prematurely.
2. Spotting Fakeouts:
Volume Analysis: Fakeouts typically show weak volume during the breakout. Always confirm breakouts with a noticeable increase in volume.
Market Context: In range-bound or choppy markets, breakouts are less reliable. Look for additional confirmation before entering trades.
Follow-Through: Wait for at least one or two candles to close above resistance or below support after a breakout.
3. Risk Management During Fakeouts:
Set Tight Stop-Losses: Place stop-loss orders close to the breakout level to minimize losses if the move fails.
Use Confluence: Combine multiple factors (e.g., trendlines, moving averages, Fibonacci retracements) for stronger confirmation.
Plan Your Targets: Avoid overly aggressive targets unless the breakout is supported by strong market structure and volume.
4. Trading Psychology:
Patience is Key: Do not rush into trades at the first sign of a breakout. Wait for confirmations to reduce emotional decision-making.
Learn from Losses: Treat fakeouts as learning opportunities. Analyze what went wrong and refine your approach.
Practical Application:
In the attached chart of 1000BONK/USDT, a failed breakout (fakeout) highlights these principles:
Weak volume during the breakout.
Lack of follow-through above resistance.
A reversal that would have been avoided by waiting for confirmation.
This tutorial emphasizes that proper confirmation, risk management, and trading psychology are essential for avoiding fakeouts and improving overall performance.
Let me know your thoughts or share how you approach such situations!

BONK/USDT - 4-Hour Volume Footprint Chart AnalysisVolume Footprint Insights:
Delta Analysis:
Dominant positive deltas (+269M, +70M) signal aggressive buying during recent moves.
Volume spikes in consolidation (4.37B total) suggest the market is preparing for a significant move.
Liquidity Zones:
Demand Cluster: 0.032–0.033 USDT.
Minor Resistance: 0.036 USDT, but selling pressure is weaker than buying pressure.
Indicators Overview:
RSI: At ~59, showing moderate bullish momentum with room to grow before overbought levels.
MACD: Bullish crossover with expanding histogram supports an upward trend.
Directional Index: Positive DI > Negative DI, confirming growing bullish strength.
Moving Averages: The price is above short-term MAs, and medium-term MAs are flattening or curving upward, signaling a potential bullish reversal.

BONK/USDT - 4-Hour Volume Footprint Chart Analysis1. Price Action:
Trend Shift: Clear breakout from a descending trendline; higher lows are forming.
Consolidation Zone: Price is currently consolidating between 0.032–0.036 USDT, which is critical for the next move.
Support & Resistance:
Strong support at 0.026 USDT.
Resistance at 0.036 USDT, with the next significant resistance at 0.045–0.050 USDT on a breakout.
2. Volume Footprint Insights:
Delta Analysis:
Dominant positive deltas (+269M, +70M) signal aggressive buying during recent moves.
Volume spikes in consolidation (4.37B total) suggest the market is preparing for a significant move.
Liquidity Zones:
Demand Cluster: 0.032–0.033 USDT.
Minor Resistance: 0.036 USDT, but selling pressure is weaker than buying pressure.
3. Indicators Overview:
RSI: At ~59, showing moderate bullish momentum with room to grow before overbought levels.
MACD: Bullish crossover with expanding histogram supports an upward trend.
Directional Index: Positive DI > Negative DI, confirming growing bullish strength.
Moving Averages: The price is above short-term MAs, and medium-term MAs are flattening or curving upward, signaling a potential bullish reversal.
Scenarios
Bullish Scenario:
Triggers:
Breakout above 0.036 USDT with strong volume and positive delta.
Price Target:
Immediate: 0.045 USDT.
Extended: 0.050 USDT or higher if momentum sustains.
Indicators Supporting Bullish Move:
Strong buying pressure in the volume footprint.
Consolidation indicates a potential breakout structure.
Bearish Scenario:
Triggers:
Breakdown below 0.032 USDT with increasing sell-side delta and volume.
Price Target:
Immediate: 0.028 USDT.
Extended: 0.026 USDT if selling accelerates.
Indicators Supporting Bearish Move:
Failing to hold 0.032 USDT would invalidate the bullish setup.

Comprehensive BONK/USDT AnalysisKey Observations
Price Action:
Breakout from a downtrend; consolidating at 0.032–0.036 USDT.
Support: 0.026 USDT. Resistance: 0.036 USDT, then 0.045–0.050 USDT.
Volume Footprint:
Positive deltas (+269M, +70M) indicate strong buying pressure.
Volume spike near 4.37B signals market readiness for a breakout.
Key demand zone: 0.032–0.033 USDT.
Indicators:
RSI (~59): Moderate bullish momentum.
MACD: Bullish crossover.
Directional Index: Positive DI > Negative DI, showing rising bullish strength.
Scenarios
Bullish:
Action: Watch consolidation; breakout signals continuation to higher targets.

BONK/USDT Analysis: Consolidation Before Potential BreakoutBONK/USDT is currently trading at $0.0334, consolidating within a key zone as it tests the descending trendline resistance. Volume is increasing, signaling growing buyer interest, but confirmation of breakout momentum is still awaited.
Market Status:
Metric Status
Time Frame Check
Consolidation Yes
Breakout Waiting
Momentum Waiting
Volume Increasing
IFC Candle Waiting
RSI: 64, signaling strong momentum but approaching overbought levels.
ADX: Positive DI dominance, confirming bullish bias as trend strength builds.
Volume: Increasing, indicating accumulation ahead of a potential breakout.
Trade Strategy:
Entry: Above $0.037.391 with a confirmed close and high volume.
Targets: $0.060 (long-term).
Stop-Loss: Below $0.030874 to minimize risk.
If rejection occurs at $0.035, a retest of $0.030 or $0.025 may provide better entry opportunities. Monitor breakout momentum closely, as confirmation is essential.
Feedback and alternate views are welcome to refine this analysis further!

BONK/USDT Analysis: Potential Breakout Ahead
BONK/USDT is trading at $0.0332, forming a bullish structure after bouncing from the $0.025 support zone. The recent breakout attempt from the descending channel is a positive signal, with potential for further upside if key resistance levels are breached.
Key Levels to Watch:
Support: $0.030 (near-term), $0.025 (major support)
Resistance: $0.035 (trendline resistance)
Indicators:
RSI: At 63, reflecting strong momentum but approaching overbought levels.
ADX: Indicates strengthening trend, with DI+ dominance supporting bullish bias.
Volume: Rising, confirming increasing buyer interest.
Trade Plan:
Entry: Above $0.037111 with volume confirmation.
Targets: $0.060 (long-term).
Stop-Loss: Below $0.030864 to minimize risk.
A rejection at $0.035 could lead to a pullback towards $0.030 or $0.025 for a better entry. Watch volume closely for confirmation of a breakout.
Feel free to share your feedback or insights to enhance this analysis!

BONK Seems like bottomed out & Ready for the Breakout!Bought some #BONK #1000BONK
Bullish divergence RSI on the previous resistance retest!
Delik, reversal to uptrend! Hold on!Bonk (BONK):
Similarly, Bonk (BONK) is also showing signs of an impending breakout as it approaches the upper resistance of its falling wedge formation. Trading at $0.00003141, BONK has been consolidating for weeks but now appears to be building momentum.
The RSI for BONK is at 43.88, suggesting that there is room for upward movement if buyers step in. The MACD indicator also reflects a waning bearish trend, with the potential for a shift in momentum.
