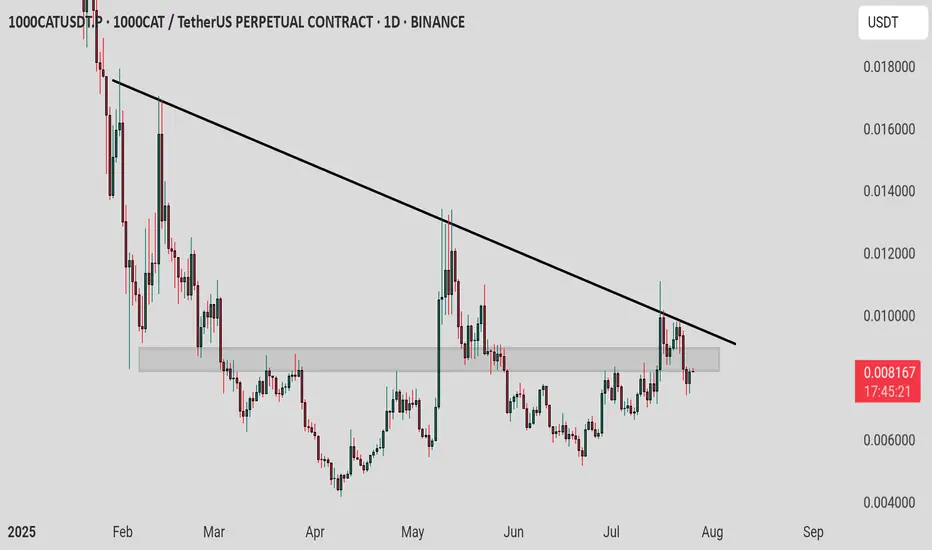
1000cat / usdt : Keep a close watch for rejection or breakout 1000CAT/USDT Analysis:
1000CAT/USDT is currently testing horizontal resistance and is near a potential breakout from the trendline resistance. This is a crucial level to watch for either a rejection or a breakout.
Key Levels:
Horizontal Resistance: Current price level.
Trendline Resistance: Near breakout.
Scenario 1: Breakout:
If the price breaks above both resistance levels, it could lead to a strong bullish move. Watch for confirmation on higher timeframes.
Scenario 2: Rejection:
If the price fails to break through and gets rejected at these levels, a pullback or reversal could occur.
Tip: Keep an eye on volume and confirmation candles to validate the breakout or rejection.
1000CATUSDT.P trade ideas
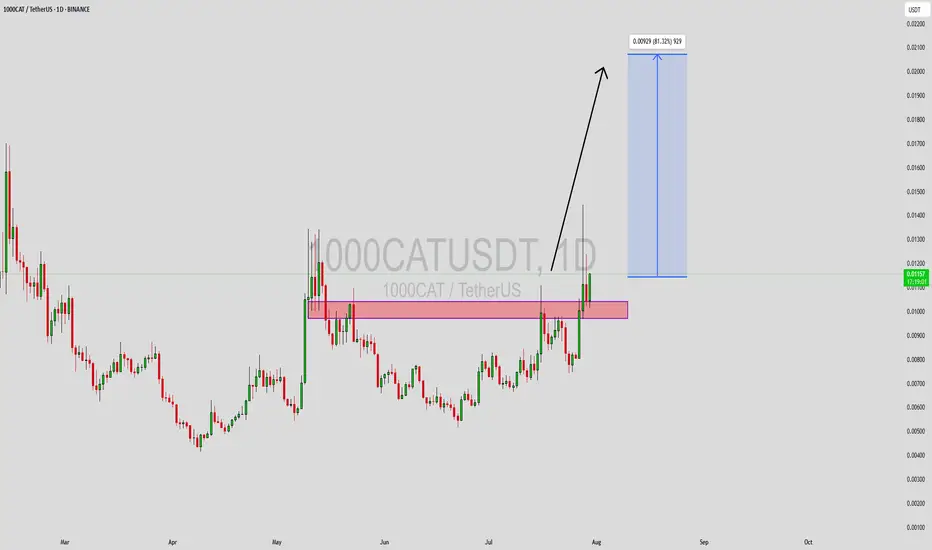
1000CATUSDT Forming Bullish Reversal1000CATUSDT is showing strong signs of bullish Reversal as it begins to form a solid base for a possible upward rally. After a period of consolidation, price action appears to be gaining momentum, supported by good volume activity — a key indicator that accumulation may be taking place. This setup has caught the attention of many short- and mid-term traders anticipating a breakout in the coming days.
From a technical perspective, the current structure suggests that buyers are starting to step in more aggressively. The asset seems to be forming higher lows, which could be the early signs of a trend reversal. If the price manages to break above its recent resistance zone, a strong upward move of around 70% to 80% could be within reach, especially as market sentiment around small-cap altcoins continues to improve.
Investor interest is increasing in the CATUSDT project, fueled by community engagement and growing speculative momentum. Such market dynamics often precede sharp moves in price, especially when supported by technical breakout patterns and volume confirmation. The fundamentals combined with bullish technicals make 1000CATUSDT one to watch closely.
As the broader market stabilizes, assets like 1000CATUSDT with strong technical structures and bullish setups could deliver notable returns. Traders should remain alert for confirmation signals and take advantage of the potential upside if bullish continuation unfolds.
✅ Show your support by hitting the like button and
✅ Leaving a comment below! (What is You opinion about this Coin)
Your feedback and engagement keep me inspired to share more insightful market analysis with you!
1000CAT/USDT April 2025 was a breakout month for 1000CAT/USDT, delivering a powerful +200% rally. Since then, the pair has entered a healthy consolidation phase, now trading around $0.008, and showing strength by holding a solid support zone at $0.006–$0.007.
Over the past weeks, price action has respected the $0.006–$0.007 range, suggesting accumulation and strong buyer presence.

1000CATUSDT is bullish in 4h time farme as it printed bullish 1000CATUSDT is bullish in 4h time farme as it printed bullish engulfing candle and also took support on 0.61 retracement

1000 CAT PERPETUAL TRADE ,Sold From $0.0109601000 CAT PERPETUAL TRADE
1000 CAT SELL SETUP
Currently $0.010960
Sold From $0.010960
(Trading plan If CAT go up to $0.011800
will add more shorts)
Expecting target $0.010200 OR DOWN
Incase of early exist will update this anaylsis
Its not a Financial advice

1000CATUSDT: Two Key Red Lines – Focused and Ready!1000CATUSDT: Two Key Red Lines – Focused and Ready! 🔴🐾
Traders, we’re looking at 1000CATUSDT with clear sell opportunities around two red lines. Let me break it down:
Red Line #1: I might ignore this level if CDV remains bullish. Why? Because it could indicate continued buyer strength.
Red Line #2: This one’s critical. I probably won’t miss it—it’s a high-probability sell zone and worth watching closely.
Here’s how I plan to trade these levels effectively:
Patience Pays Off: Watch for volume spikes and CDV shifts as price approaches each red line.
Market Confirmation: Look for rejection patterns or bearish market structure at these levels.
Risk Management: Reduce exposure if the first red line doesn’t react strongly and shift focus to the second.
💡 Want to learn my system? I can teach you how to dominate with CDV, liquidity heatmaps, volume profiles, and volume footprints . DM me for a masterclass!
👉 Boost, comment, and follow! Let’s make 1000CATUSDT a winning trade together! 🚀
Let me tell you, this is something special. These insights, these setups—they’re not just good; they’re game-changers. I've spent years refining my approach, and the results speak for themselves. People are always asking, "How do you spot these opportunities?" It’s simple: experience, clarity, and a focus on high-probability moves.
Want to know how I use heatmaps, cumulative volume delta, and volume footprint techniques to find demand zones with precision? I’m happy to share—just send me a message. No cost, no catch. I believe in helping people make smarter decisions.
Here are some of my recent analyses. Each one highlights key opportunities:
🚀 GMTUSDT: %35 FAST REJECTION FROM THE RED BOX
🎯 ZENUSDT.P: Patience & Profitability | %230 Reaction from the Sniper Entry
🐶 DOGEUSDT.P: Next Move
🎨 RENDERUSDT.P: Opportunity of the Month
💎 ETHUSDT.P: Where to Retrace
🟢 BNBUSDT.P: Potential Surge
📊 BTC Dominance: Reaction Zone
🌊 WAVESUSDT.P: Demand Zone Potential
🟣 UNIUSDT.P: Long-Term Trade
🔵 XRPUSDT.P: Entry Zones
🔗 LINKUSDT.P: Follow The River
📈 BTCUSDT.P: Two Key Demand Zones
🟩 POLUSDT: Bullish Momentum
🌟 PENDLEUSDT.P: Where Opportunity Meets Precision
🔥 BTCUSDT.P: Liquidation of Highly Leveraged Longs
🌊 SOLUSDT.P: SOL's Dip - Your Opportunity
🐸 1000PEPEUSDT.P: Prime Bounce Zone Unlocked
🚀 ETHUSDT.P: Set to Explode - Don't Miss This Game Changer
🤖 IQUSDT: Smart Plan
⚡️ PONDUSDT: A Trade Not Taken Is Better Than a Losing One
💼 STMXUSDT: 2 Buying Areas
🐢 TURBOUSDT: Buy Zones and Buyer Presence
🌍 ICPUSDT.P: Massive Upside Potential | Check the Trade Update For Seeing Results
🟠 IDEXUSDT: Spot Buy Area | %26 Profit if You Trade with MSB
📌 USUALUSDT: Buyers Are Active + %70 Profit in Total
🌟 FORTHUSDT: Sniper Entry +%26 Reaction
🐳 QKCUSDT: Sniper Entry +%57 Reaction
📊 BTC.D: Retest of Key Area Highly Likely
This list? It’s just a small piece of what I’ve been working on. There’s so much more. Go check my profile, see the results for yourself. My goal is simple: provide value and help you win. If you’ve got questions, I’ve got answers. Let’s get to work!

1000CATUSDTHMT v1.0 spotted. Looking good with previous wave up with increasing volume and momentum.
- BOS (Breaks of Structure) at @ 0.04324-0.04530 level
- Trending slow and steady if able to hold above the BOS level
It is at extremely good reward to risk level.

1000CAT/USDT - Head and Shoulders Pattern Confirmed?🔻 1000CAT/USDT - Head and Shoulders Pattern Confirmed?
Timeframe: 1H
Current Price: 0.0348 USDT
Trade Type: Potential Short Setup
Chart Analysis: The 1000CAT/USDT chart is showing a Head and Shoulders formation, a common bearish reversal pattern.
Pattern Structure: A left shoulder, a higher peak as the head, and a right shoulder are visible, with the neckline currently aligned near 0.0340.
Support Levels: The neckline support around 0.0340 is key for confirming the pattern. A break below this level would signal potential downside momentum.
Volume Profile: Higher volume on the head’s peak and reduced volume on the right shoulder suggests weakening buying pressure.
Trade Setup:
Entry Point: Consider a short position if price breaks below 0.0340.
Stop Loss: Position stop-loss just above the right shoulder at around 0.0355 to manage risk.
Take Profit: Target support around 0.0300, which aligns with previous consolidation areas and the pattern's potential completion.
Conclusion: A breakdown below the neckline would confirm the bearish reversal pattern. The setup offers a solid risk-to-reward ratio if the pattern completes, but watch closely for confirmation before entering.
Trade Carefully!

Do 1000cat want to jump down?
This asset is very capricious, but can now jump. There is a triangle. There is an arc. There are several H&S peaks.
I'm trying to sell with RR 2. The risk per transaction is 4% of the balance.
