Short term aave targets Bullish channel with multiple higher highs and higher lows along with regional support. Breakout already ensued.
AAVEUSD trade ideas

Do NOT Sleep On This ALT Market MartyBoots here. I have been trading for 14 - 15 years and I am here to share my ideas with you to help the Crypto space.
ALT Coins are Setting up for a HUGE bounce and we in CryptoCheck intend to make lifechanging money
------------------------------------------------------------------------------------------------------------------------------------------------------------
If you want help trading Bitcoin or any other ALT coins hit me up , We will improve your trading . Have a look at the link below
------------------------------------------------------------------------------------------------------------------------------------------------------------

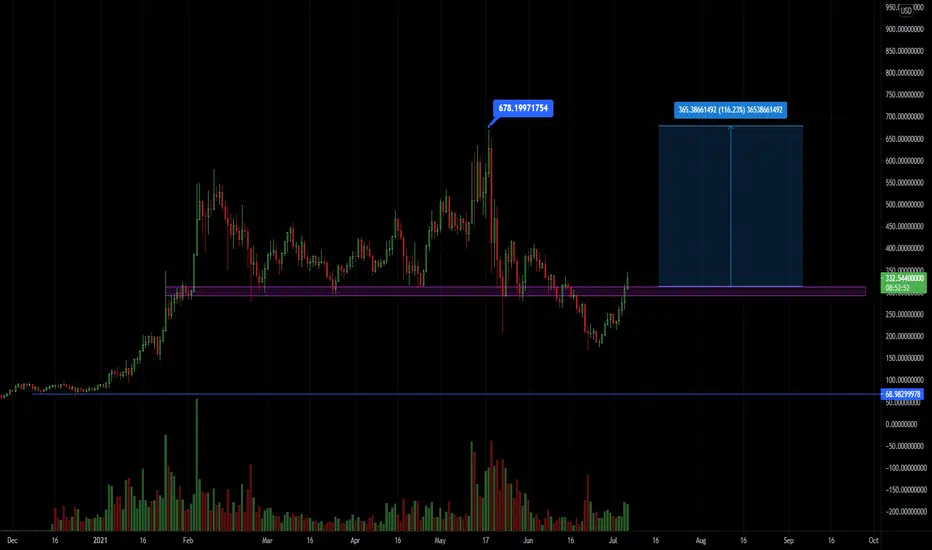
AAVE turning bullish again. Possible run to ATHAAVE broke through the $300 support level that has been building since Feb. Now trading back above the level it is time to look for longs into ATH as there is now a clearly defined risk to reward set up that we can follow.
Generally when support breaks and trades under price should have a difficult time getting back above that level as sellers are now more aggressive at those levels. Now that buyers are stepping in AAVE should be able to trade higher.
COINBASE:AAVEUSD

AAVE, on rising wedge.AAVE, currently on rising wedge and possible completion of head and shoulders.

Aave (AAVE) - June 30Hello?
Welcome, traders.
If you "follow", you can always get new information quickly.
Please also click "Like".
Have a good day.
-------------------------------------
(AAVEUSD 1W Chart)
It must move above the 300.459751 point to continue the uptrend.
(1D chart)
We will have to wait and see if we can sustain the price in the 253.495357-337.451626 range to turn into an upward trend.
In particular, you need to watch to see if it moves along an uptrend line.
If it goes down, you should check to see if it finds support at the 126.926372-169.539088 zone.
-------------------------------------
(AAVEBTC 1W chart)
If the price holds above the 0.002829-0.004956 range, we expect the uptrend to continue.
(1D chart)
We should see support at the 0.006625 point and see if we can move higher.
In particular, if the price is maintained in the range of 0.006625-0.008812, it is expected to turn into an uptrend.
You need to break out of the downtrend line to accelerate the uptrend.
If it goes down, you should check to see if it finds support in the 0.003343-0.004437 range.
------------------------------------------
We recommend that you trade with your average unit price.
This is because, if the price is below your average unit price, whether it is in an uptrend or in a downtrend, there is a high possibility that you will not be able to get a big profit due to the psychological burden.
The center of all trading starts with the average unit price at which you start trading.
If you ignore this, you may be trading in the wrong direction.
Therefore, it is important to find a way to lower the average unit price and adjust the proportion of the investment, ultimately allowing the funds corresponding to the profits to regenerate themselves.
------------------------------------------------------------ -----------------------------------------------------
** All indicators are lagging indicators.
Therefore, it is important to be aware that the indicator moves accordingly as price and volume move.
However, for the sake of convenience, we are talking in reverse for the interpretation of the indicator.
** The wRSI_SR indicator is an indicator created by adding settings and options to the existing Stochastic RSI indicator.
Therefore, the interpretation is the same as the traditional Stochastic RSI indicator. (K, D line -> R, S line)
** The OBV indicator was re-created by applying a formula to the DepthHouse Trading indicator, an indicator disclosed by oh92. (Thanks for this.)
** See support, resistance, and abbreviation points.
** Support or resistance is based on the closing price of the 1D chart.
** All descriptions are for reference only and do not guarantee a profit or loss in investment.
Explanation of abbreviations displayed in the chart
R: A point or section of resistance that requires a response to preserve profits.
S-L: Stop Loss point or section
S: A point or section where you can buy to make a profit as a support point or section.
(Short-term Stop Loss can be said to be a point where profit and loss can be preserved or additional entry can be made through split trading. It is a short-term investment perspective.)
GAP refers to the difference in prices that occurred when the stock market, CME, and BAKKT exchanges were closed because they are not traded 24 hours a day.
G1 : Closing price when closed
G2: Opening price
(Example) Gap (G1-G2)

AAVE/USD push up in wave (V) target 830AAVE/USD - Technical analysis
context: AAVE/USD is progressing with a clear impulsive elliot waves upside move. After a long period stuck in a range AAVE is progressing towards new ATH in wave (V) with a standard target at 830.
Key element (Daily chart - log)
- MM are support at 470 (55)
- RSI is above 50%
- Graphical pull back triggered (green line)
- Elliot wave key support 470 and Target 830/905/1070
Conclusion:
No reason to don't see new ATH with this kind of configuration - however keep in mind with have a lack of data history, not easy to collect fibo accumulation.
The standard analysis of the elliot wave told us to take care approching 830 (perfect exit level before sell off), but as mentioned the lack of data can also conduct the conclusion to anticipate a larger move in extension till 905 and 1070
On our side we will exit at 820 (we bought AAVE the 30 November 2020 in the setback on MM)

Aave Potential Double Bottom with Bullish DivergenceAave potential double bottom with bullish divergence on the 4 hour RSI and MACD with the first bottom being on May 23rd at about 205.


AAVE following the General trend AAVEUSDFollowing what most cryptos are doing right, AAVE seems to wan to go lower locally. We are noting Wave A of the next ABC fractal forming. Not much to note here - other than that the Fibonacci goals is in green, cancellation/setup rejection is in red. This is not some kind of financial advice for your portfolios, so do your own research and make your own decisions about your trading or investment related moves.

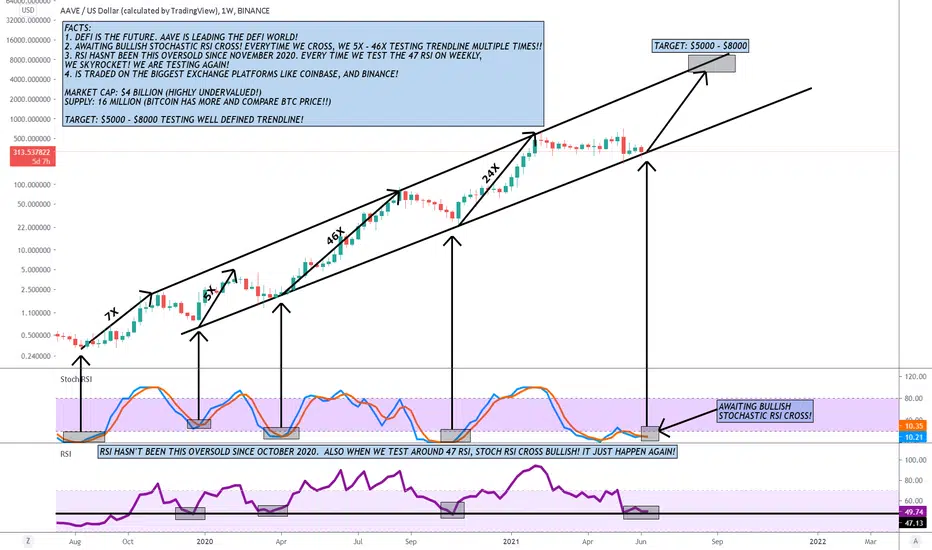
AAVE - BULLISH STOCHASTIC RSI CROSS ABOUT TO HAPPEN AGAIN!FACTS:
1. DEFI IS THE FUTURE. AAVE IS LEADING THE DEFI WORLD!
2. AWAITING BULLISH STOCHASTIC RSI CROSS! EVERYTIME WE CROSS, WE 5X - 46X TESTING TRENDLINE MULTIPLE TIMES!!
3. RSI HASNT BEEN THIS OVERSOLD SINCE NOVEMBER 2020. EVERY TIME WE TEST THE 47 RSI ON WEEKLY,
WE SKYROCKET! WE ARE TESTING AGAIN!
4. IS TRADED ON THE BIGGEST EXCHANGE PLATFORMS LIKE COINBASE, AND BINANCE!
MARKET CAP: $4 BILLION (HIGHLY UNDERVALUED!)
SUPPLY: 16 MILLION (BITCOIN HAS MORE AND COMPARE BTC PRICE!!)
TARGET: $5000 - $8000 TESTING WELL DEFINED TRENDLINE!
I usually don't follow fundamentals, but AAVE has one of the most promising projects out there!
TARGETS THIS YEAR:
Target this year: $5000-8000
Good Luck!
"If you can't beat the fear, do it scared!"
"Be fearful when others are greedy, and greedy when others are fearful!" - Warren Buffet.
"Markets are a device for transferring money from the impatient to the patient. - Warren Buffet
"Show me the charts, and I'll tell you the news." - Bernard Baruch
AAVE - $982AAVE is currently trading above the support of $292 and close to the resistance of $341. If it can break this resistance, we could see a move towards $366, $431, $484 and $536. If it can flip the $536 area to support, we could see a move towards $611, $707 and $982.

Easy Long...Correction probably over buying now and coming back in 6-12months... I expect to see this 4 figures.


AAVEAAVE - Great looking set up if we tow the line. bidding the low in hopes of catching a wick. I personally see the support holding and being a key area of positive order demand

Aave (AAVE) - June 9Hello?
Welcome, traders.
By "following", you can always get new information quickly.
Please also click "Like".
Have a good day.
-------------------------------------
(AAVEUSD 1W Chart)
If the price holds above the uptrend line (1), then the uptrend is expected to continue.
(1D chart)
The 337.451626-379.429759 section needs to be supported and move up in order to continue the uptrend.
If it goes down from the 300.459751 point, it can touch the 169.539088 point and move up along the uptrend line, so you need to trade cautiously.
-------------------------------------
(AAVEBTC 1W chart)
Since we have created a Double Top, we expect a downtrend if we do not cross the downtrend line.
However, if it finds support at the 0.007865 point, it is expected to renew its highs.
If the price holds above the 0.004956 point, it is expected that the uptrend will continue.
If it rises along the uptrend line (1), it is expected to be a buying opportunity.
(1D chart)
It remains to be seen if the 0.008812-0.009906 zone can find support and move up.
If it falls from the 0.006625 point, you need a Stop Loss to preserve your profit.
------------------------------------------
We recommend that you trade with your average unit price.
This is because, if the price is below your average unit price, whether it is in an uptrend or in a downtrend, there is a high possibility that you will not be able to get a big profit due to the psychological burden.
The center of all trading starts with the average unit price at which you start trading.
If you ignore this, you may be trading in the wrong direction.
Therefore, it is important to find a way to lower the average unit price and adjust the proportion of the investment, ultimately allowing the funds corresponding to the profits to regenerate themselves.
------------------------------------------------------------ -----------------------------------------------------
** All indicators are lagging indicators.
Therefore, it is important to be aware that the indicator moves accordingly with the movement of price and volume.
However, for the sake of convenience, we are talking in reverse for the interpretation of the indicator.
** The wRSI_SR indicator is an indicator created by adding settings and options to the existing Stochastic RSI indicator.
Therefore, the interpretation is the same as the traditional Stochastic RSI indicator. (K, D line -> R, S line)
** The OBV indicator was re-created by applying a formula to the DepthHouse Trading indicator, an indicator disclosed by oh92. (Thanks for this.)
** See support, resistance, and abbreviation points.
** Support or resistance is based on the closing price of the 1D chart.
** All descriptions are for reference only and do not guarantee a profit or loss in investment.
Explanation of abbreviations displayed in the chart
R: A point or section of resistance that requires a response to preserve profits.
S-L: Stop Loss point or section
S: A point or section where you can buy to make a profit as a support point or section.
(Short-term Stop Loss can be said to be a point where profit and loss can be preserved or additional entry can be made through split trading. It is a short-term investment perspective.)
GAP refers to the difference in prices that occurred when the stock market, CME, and BAKKT exchanges were closed because they are not traded 24 hours a day.
G1 : Closing price when closed
G2: Opening price
(Example) Gap (G1-G2)

AAVE 2hr, $255 support levelAave has an intriguing lending and staking function. Yet the current FUD.


$2400 AAVE COMING!Though $1000 might be the safe EXIT point......it wouldn't surprise me if $2500ish is actually reached by the end of this year!
this is an IMMACULTE setup with all the right structure, time symmetry, fibonacci pullbacks & extensions!
I hope you bought the $300 DIP!

AAVE ~ Post-capitulation buy-in zonesAAVE showed incredible strength during the last bull run up.
It is in the top 3 of all DeFi protocols and the TVL just keeps going up: people want to keep their finances in AAVE more and more.
I was a late comer to the AAVE coin. I only started investing in it about 8 months ago. Most of my gains were wiped out in the capitulation but there is a clear 100% gain for AAVE ahead in its trip back to its ATH.
I have a strong feeling that many people will be "taking profits" on the way back up; fearful that the bull market is over; because there is such a huge media campaign trying to convince new-comers to crypto that it is....
But the bull run is far far far from over.
A good buy-in around these price levels is the same price you could have gotten into AAVE at 3-4 months ago, so its giving you this gift one more time, with 100% upside back to ATH as a potential trade, then rebuy the dip as well.
My strategy is much simpler: BUY and HODL to the end of the bullrun. AAVE is an interesting project that could see another 800% or 400%. I'm not sure where it will land, and it depends allot on whether "DEFI summer 2.0" happens, or if its more of a fizzle this year compared to last.
If we do have another defi summer, which I strongly expect, then AAVE is at the center of that and is going to pump extremely well so I wouldnt be surprised at another 10x (900%) pump from where we are at right now.
As always, DYOR, and invest in real projects.
Capitulations like this are necessary to kill the shitcoins and get rid of the degen hype tiktok WSB r-tards out of the market.

AAVE may re-test low 300'sWe shot up too fast IMO, may re-test support levels, possibly around low 300's. Bounce around the support levels for accumulation and shoot upwards later on.
