Alchemy Pay 2025 All-Time High Potential Explored (2,400%+)It is very interesting to look at Alchemy Pay (ACHUSDT) in 2021, its bull-market bull-run lasted only two weeks, while we know many pairs and projects that grew for years and some for many months... It goes to show that there are always strong variations across the Crypto-space.
Good day my fellow trader, I am happy to write again for you today.
👉 Total growth in 2021 amounted to 15,133%; absolutely astonishing.
This trading pair continues strong after a solid bear-market. The bear-market is followed by a bullish consolidation pattern, a long-term one. We have higher lows for sure because it would be almost impossible to delete that 15,000% growth phase.
A higher high, aka. new All-Time High, seems possible and quite easy actually. There is nothing in this chart that says it can't be done. On the other hand, we have signals that are pointing toward long-term growth.
Alchemy Pay bottomed in December 2022 and has been going up and sideways and is getting ready to move ahead. The same warning repeated over and over —here we go again; there can be strong shakeouts, price swings, corrections, one final drop, etc., before the major bull-market shows up. But it is safe to start accumulating thinking of the long-term; our strategy? Buy and hold.
➖ The first ATH projection leads to $0.320 which gives us around 1,506% growth potential.
➖ The main ATH projection sits at $0.512, and this one look/feels/sounds better and goes to 2,471% or around 25X.
It is definitely not the same as 15,000%+ (more than 150X) but it is still incredible and amazing if it comes to pass.
Will it come to pass?
For this answer, we have to wait.
Patience is key... But, the Altcoins are starting to grow and 2024 is not even over, so we will do great in 2025, that's for sure.
Namaste.
ACHUSDT trade ideas

$ACH Poised for Bullish Reversal: Falling Wedge Setup!FWB:ACH (Alchemy Pay) is forming a falling wedge pattern on the 1D chart, which is typically a bullish reversal pattern.
📈 Entry Point: $0.0180 to $0.0190
🎯 Targets: $0.0250 $0.0300 $0.0400
🔄 Trading Options: FWB:ACH is available for trading on multiple exchanges. Consider setting a stop-loss at $0.0150 or if the price drops below the wedge support line.
📊 About FWB:ACH :
Alchemy Pay (ACH) is a leading payment solution provider, bridging the gap between fiat and crypto. With growing adoption and partnerships, it aims to make crypto payments seamless and accessible worldwide.
📢 DYOR, NFA
#Crypto

ACHUSDT Daily Chart Analysis.ACHUSDT Approaches Resistance:
Bullish Breakout PotentialACHUSDT on the daily chart has been trading within a descending wedge, a pattern typically seen as a bullish reversal indicator. After a prolonged downtrend, the price is currently testing the upper boundary of this wedge.
The key resistance level is around $0.026, and a breakout above this level could signal a strong upward movement. If ACHUSDT manages to break out of the descending wedge, we could see a significant bullish run, potentially targeting the $0.05 level.

#ACHUSDT 4H luck goodACH is a well-valued currency during this period, so check the chart and plan your trades

ACHUSDT Falling Wedge Pattern!ACHUSDT Technical analysis update
ACH has formed a falling wedge pattern on the daily chart, with the price moving towards the wedge's resistance line for a breakout. If the price breaks the wedge pattern, we can expect a strong move in ACH.
Buy Level: $0.0265
Stop Loss:$0.021
regards
Hexa

ACHUSDT(Alchemy Pay) Daily tf Range Updated till 03-07-24ACHUSDT(Alchemy Pay) Daily timeframe range. pretty simple chart its surviving right now. stuck between 0.02143-0.02849. if it cant break 0.02143 it will reach 0.02849 eventually. breaking 0.02849 will give it more breathing space.

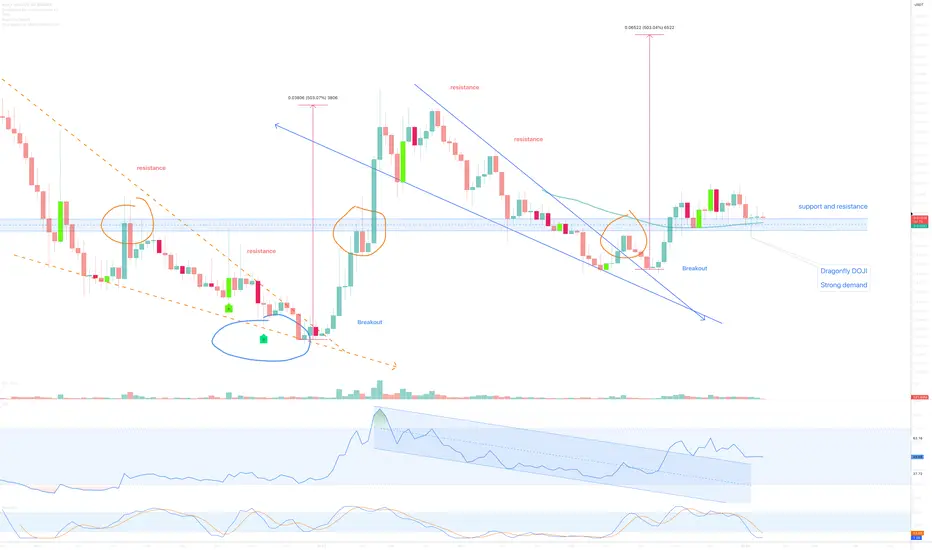
Alchemy Pay (ACH)On the above 5-day chart price action has corrected almost 80% since the 500% move from the previous idea. Now is a good opportunity to go long. Why?
1) Price action and RSI resistance breakouts.
2) Trend reversal, higher highs and higher lows replace lower highs and lower lows.
3) Price action finds strong demand on past resistance. Orange circles. Look left.
4) Dragonfly DOJI candle print. On this timeframe, you don’t ignore.
5) There is something else, will share elsewhere.
Is it possible price action could fall further? Sure.
Is it probable? No.
Ww
Type: trade
Risk: <=6% of portfolio
Timeframe for long: Now
Return: 300%
ACHUSDT TECHNICAL ANALYSIS DAILY TIMEFRAMEThis technical analysis chart depicts the price action of ACH/TetherUS on a 4-hour timeframe, using data from Binance. The chart shows several key levels, trends, and projected movements:
Breakout Zone (BREAKE):
A significant support level around 0.02362, marked as the breakout zone. If the price sustains above this level, it indicates potential bullish momentum.
Targets:
Target 1: The first target level is around 0.03292. The price is expected to reach this level as an initial goal following a breakout.
Target 2: The second target level is around 0.03835, representing a further potential upside after reaching and possibly consolidating around Target 1.
Stop-Loss:
A stop-loss is set at 0.01956, indicating the level at which the trade should be exited to prevent further losses if the price moves against the expected direction.
Risk/Reward Ratio:
The chart includes a risk/reward ratio of 5.86, suggesting a favorable trade setup with high reward potential compared to the risk taken.
Projected Price Movement:
The price is expected to rise, potentially encountering some resistance around Target 1, then possibly breaking above this level to reach Target 2.
There is an indication of the price moving in an upward trend after confirming the breakout above the 0.02362 level.

MACRO ASCENDING TRIANGLEI like to find the trends before they start. Entered on bottom of this weekly ascending triangle. You know what they say, the longer it consolidates, the bigger the move. This is one big triangle and when it breaks, ACH should have its bull season. Refer to HARMONY ONE and the bull season in 2020/21 for reference as the measured moves are very similar. Also very similar assets. Time to hodl this coin IMO as I believe BTC ready for bull run as well.

ACHUSDTRecently made a bearish divergence on rsi. could possibly come down.lets see how it plays out

ACH/USDTThe chart of ACH appeared bullish, IMO trend will continue while Invalidation is when price goes below lower trend line.

Market Analysis:ACH Coin Breakdown🔍 Let's dive into today's analysis. The market shows a bearish momentum, and the coin we are analyzing today has the potential for a sharp drop in the 4-hour timeframe.
Bitcoin Analysis
📉 Starting with Bitcoin in the 1-hour timeframe, the support level discussed yesterday has been broken. The price has now reached the trigger at 65197 and may start correcting and resting.
📉 If this trigger is broken, we can move towards the 64429 support, which could be the next target.
📈 Breaking 25.23 in the RSI could bring even more momentum into the market, potentially targeting levels like 63356.
⚠️ A crucial point to note is the significantly increasing selling volume, indicating the strength of the downward trend.
🔻 Overall, I consider Bitcoin's downtrend more likely than an uptrend and will be looking for short positions in the market today.
ACH Coin Analysis
🔍 Now, let's look at the ACH project. I haven't researched it extensively, but I know it's a bridge for converting fiat currencies to crypto. If you'd like a comprehensive analysis of this project, let me know in the comments, and I'll do that for you.
ACH Coin Chart Analysis
📉 As seen on the chart, ACH has experienced a very sharp decline and is moving towards the support at 0.2168. This support is significant as it aligns with the 0.786 Fibonacci level of the 1-day timeframe wave and the 1 fibo extension point, making this area even stronger.
⚠️ However, never underestimate the power of momentum. If the RSI stabilizes below 24.29, the bearish momentum will increase, and we might see lower prices like 0.02034. Therefore, despite the significant drop without a correction, I recommend opening a position with low risk and small volume if the RSI breaks 24.29.
📉 The volume of ACH is also increasing, indicating the strength of the bearish momentum.
Daily Timeframe Quick Check
📅 Lastly, let's quickly check the daily timeframe. As shown, the price is in the 0.707 to 0.786 Fibonacci range. If this range breaks to the downside, the price could even correct to the 0.01761 area.
📝 In conclusion, both Bitcoin and ACH coin are exhibiting strong bearish signals. Bitcoin's support levels and RSI indicators suggest potential further declines, while ACH coin's sharp drop and increasing volume indicate a strong bearish momentum. Caution is advised, and for those looking to open positions, it's crucial to monitor RSI levels and volume indicators closely. Always manage risk appropriately, especially in volatile markets like these.
🧠💼 Always remember the inherent risks in futures trading, with the potential for margin calls if risk management is neglected. Stick to strict capital management principles and use stop-loss orders, ensuring an initial target with a risk-to-reward ratio of 2.
🫶 If you found this analysis helpful and want to support me, please boost this analysis. Feel free to leave a comment or suggest a coin you'd like me to analyze next.

ACHUSDTACHUSDT is in strong bullish trend.
As the market is consistently printing new HHs and HLs.
currently the market is retracing a bit after last HH, which is 50% Fib retracement level and local support as well. if the market successfully sustain this buying confluence the next leg up could go for new HH.
What you guys think of this idea?

ACH/USDT Ready to Breakout of a Symmetrical Triangle 💎#ACHUSDT is on the brink of a dynamic shift and moving to challenge the upper edge of a symmetrical triangle. Positioned at the crucial support of $0.0284, the asset is primed for a potential breakout. Holding this momentum could significantly propel it past the channel’s boundary, setting the stage for substantial upward moves.
💎Conversely, if #AlchemyPay cannot sustain this level and slips below $0.0284, it may signal a downtrend extension, eyeing the next vital demand zone at $0.0241. This area is renowned for its liquidity depth, having historically catalyzed notable recoveries.
💎Should FWB:ACH revisit this zone, ensuring a robust rebound is vital for maintaining foundational support. A lack of recovery could intensify bearish trends, deteriorate investor sentiment, and potentially precipitate extended price falls.
💎Keep your strategies flexible and your eyes peeled, Paradisers. Your ParadiseTeam is diligently monitoring and ready to guide you through the evolving dynamics of the #AlchemyPay market.
MyCryptoParadise
iFeel the success

ACH/USDT Breakout ACH/USDT breakout:
The ACH/USDT pair has confirmed a breakout from a triangle pattern. The price may retest the breakout level again. I am anticipating a strong bullish move in the short term if the price retests successfully. This is not financial advice, so please do your own research (DYOR) before making any decisions.

Alchemy Pay Technical Analysis Here is a potential price target for ACH should it be bullish. It has been keeping above .1 for about 50days now and that should be a sign of support (at least one can hope it is).
Let's see how this prediction plays out with time.

Will $ACH rocket?#ach has tried a fake out after w bounce in LTF and Also price formed bullish flag in mid term. A breakout may be expected due to #btc ,the king. Not financial advice.

ACHUSDT signaled LONG amidst Bitcoin uncertaintyEven with the uncertainty of BTCUSD direction, EnF Breakout Strategy signaled a LONG on ACHUSDT. The trade technically has already opened but is back inside the entry zone. Wait for a new breakout before entering the market.
See idea for breakout entry, targets and stoploss
Only enter the trade when the price break out above the entry
Check out more on the script:
To get access to this script, DM me

Alchemy Pay Unveils A Web3 Digital Bank, $ACH Price Spikes 10%Alchemy Pay, a prominent player in the fiat-crypto payment solutions arena, has announced the launch of its new venture, the Web3 Digital Bank, which aims to revolutionize cross-border payments. The initiative is set to revolutionize multi-fiat account opening and operation, streamline cash flows, and enable seamless conversions between fiat and cryptocurrency for global Web3 businesses. ACH, the native token of Alchemy Pay, has rallied nearly 10%, captivating crypto investors' attention worldwide.
The bank's mission is inspired by Ripple's model for cross-border payments, which aims to address challenges while fostering innovative solutions. Alchemy Pay is poised to introduce online payment and banking solutions for businesses within regulatory jurisdictions, integrating Alchemy Pay's products and banking offerings to mandate seamless conversions between fiat and cryptocurrencies within a single bank account.
Alchemy's Web3 Digital Bank also offers aid to Web2 companies looking to venture into the realm of crypto industry investments. The firm claims to serve as the bridge between fiat and crypto global economies, promoting a more inclusive and equitable financial landscape.
FWB:ACH 's price chart has shown gains worth 10.44% in the past 24 hours, currently trading at $0.0322. Coinglass data revealed an 18.53% increase in the token's Futures and Options OI, reaching $11.34 million, followed by a derivatives volume upswing of 81.03% to $38.73 million. This data underscores a strong market uptrend for FWB:ACH at press time, further aligning with the optimism from the announcement.

ACHUSDT 12H#ACH is moving inside a symmetrical triangle. We have a heavy resistance at the $0.02983 level. In case of a breakout of this level, the targets are:
$0.03399
$0.03816
$0.04332
$0.05165

ACH LOOKS BEARISHThe price has hit an important supply.
It seems to drop towards the targets indicated on the chart to complete the timing of the d wave from our hypothesized diametric.
Closing a daily candle above the invalidation level will violate the analysis
For risk management, please don't forget stop loss and capital management
When we reach the first target, save some profit and then change the stop to entry
Comment if you have any questions
Thank You

ACHUSDTEnF Breakout Strategy is painting a SHORT on ACHUSDT
See idea for breakout entry, targets and stoploss
Check out more on the script:
To get access to this script, DM me

a patternIn the chart, we can see that it is currently fluctuating in a green pattern.
So now we have to wait for a strong exit from this pattern at the red resistance point.
Going out of the pattern can give good profit
