Anticipating DJIOn the daily timeframe, the current position of the Dow Jones Industrial Average (DJI) is projected to follow one of three possible scenarios:
Scenario 1 (Black Label):
DJI is currently in the process of forming Wave iv of Wave , implying that any short-term rebound is likely to be limited. The index may test the resistance area between 43,953–44,142, but remains vulnerable to further downside correction thereafter.
Scenario 2 (Red Label):
In this scenario, Wave 4 is considered complete, allowing DJI to resume its upward momentum. A breakout would signal the start of Wave 5, targeting the 45,324–46,465 range for a potential new higher high.
Scenario 3 (Blue Label):
Here, DJI is assumed to be in the midst of Wave 4 of Wave (5). A corrective move is expected first, potentially revisiting the support zone around 42,262–43,028, before continuing its bullish trend to form a new higher high.
USAIND trade ideas

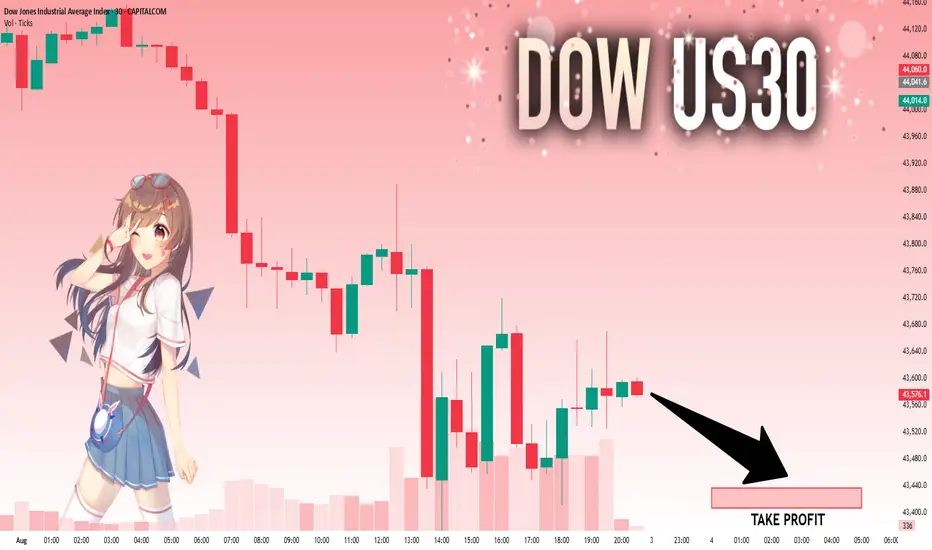
Dow Jones August GameplanNow that the first trading day of August has printed, can one reliably forecast the possible month based on just the first day? I am inclined to believe that one can with a small amount of accuracy. Not perfect.
There are two types of monthly cycles when the first traded day is a bearish candle right from the open of the month.
Type 1 is a bearish trending cycle that trends lower and lower. It is then followed up by small number of bullish pullbacks halfway through the month before rolling back over and closing near the lows.
Type 2, more common, is when the first traded day is bearish right from the get-go as well, trades lower but reverses near the beginning of the month before trading higher than the open and forming a bullish bar.
So, in my opinion, there are only two probably outcomes for August.
Type 1:
Type 2:

US30US30 was expected to drop last week which is what market has done. This week we need upside correction or impulse.
Disclosure: We are part of Trade Nation's Influencer program and receive a monthly fee for using their TradingView charts in our analysis.
US30: Will Go Down! Short!
My dear friends,
Today we will analyse US30 together☺️
The recent price action suggests a shift in mid-term momentum. A break below the current local range around 47,577.1 will confirm the new direction downwards with the target being the next key level of 43,436.6 .and a reconvened placement of a stop-loss beyond the range.
❤️Sending you lots of Love and Hugs❤️
US30 Swing Short!
HI,Traders !
#US30 keeps falling down
And the index broke the
Key wide horizontal level
Around 43924.6 which is now
A resistance and the breakout
Is confirmed so we are very
Bearish biased and we will
Be expecting a bearish
Continuation on Monday !
Comment and subscribe to help us grow !

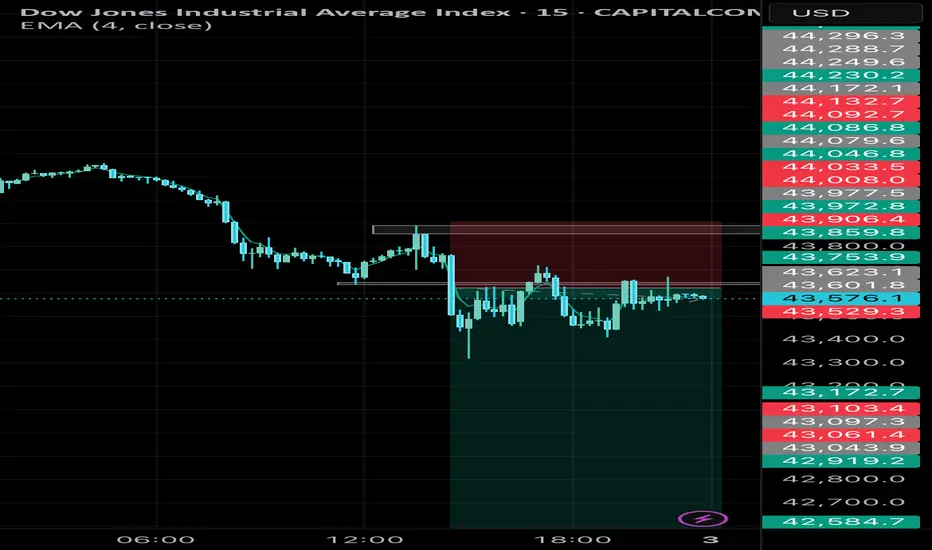
US30 (15M) – Bearish Reversal Setup, Short Opportunity📊 Analysis:
The US30 index on the 15-minute chart is showing signs of a bearish reversal after a recent upward push. Key technical observations:
1. Price Action & Structure
* US30 has been trading in a minor uptrend, but momentum is weakening.
* The latest 15M candles show lower highs forming near resistance, suggesting exhaustion in buying pressure.
2. Resistance Zone
* The price is rejecting a strong intraday resistance zone near 43641.90.
* Multiple failed attempts to break above this level reinforce it as a key barrier.
3. Target Levels
* First support target: 43206.96 – a minor support from previous structure.
* Secondary target: 41911.76.
4. Risk Management
* Suggested stop-loss: Above the recent swing high.
* Risk/reward ratio: Aim for at least 1:2 to ensure proper trade efficiency.
✅ Summary:
US30 on the 15-minute chart is showing a bearish setup.
⚠️ This analysis is for educational purposes only and not financial advice. Always use proper risk management.
DowJones The Week Ahead Key Support and Resistance Levels
Resistance Level 1: 44390
Resistance Level 2: 44720
Resistance Level 3: 45100
Support Level 1: 43360
Support Level 2: 43140
Support Level 3: 42800
This communication is for informational purposes only and should not be viewed as any form of recommendation as to a particular course of action or as investment advice. It is not intended as an offer or solicitation for the purchase or sale of any financial instrument or as an official confirmation of any transaction. Opinions, estimates and assumptions expressed herein are made as of the date of this communication and are subject to change without notice. This communication has been prepared based upon information, including market prices, data and other information, believed to be reliable; however, Trade Nation does not warrant its completeness or accuracy. All market prices and market data contained in or attached to this communication are indicative and subject to change without notice.

Dow Jones Wave Analysis – 1 August 2025
- Dow Jones broke the support zone
- Likely to fall to support level 43000.00
The Dow Jones index broke the support zone between the support level 44000.00 and the 38.2% Fibonacci correction of the upward impulse from June.
The breakout of this support zone accelerated the active short-term correction iv.
Dow Jones index can be expected to fall to the next support level at 43000.00 (target for the completion of the active correction iv and the former resistance from May and June).
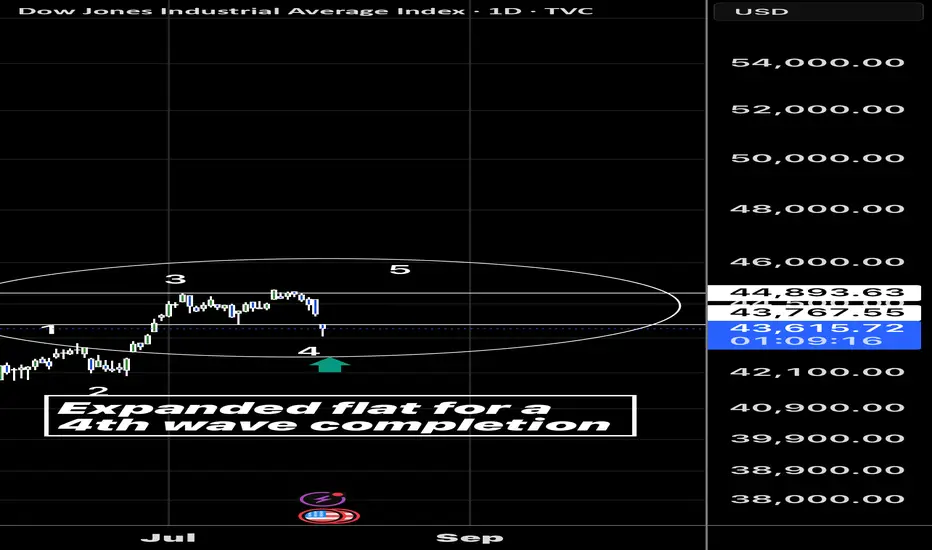
Expanded flat on the Dow for 4th wave completion? If it is we can see some new highs… a close back above 43760 today would set it up
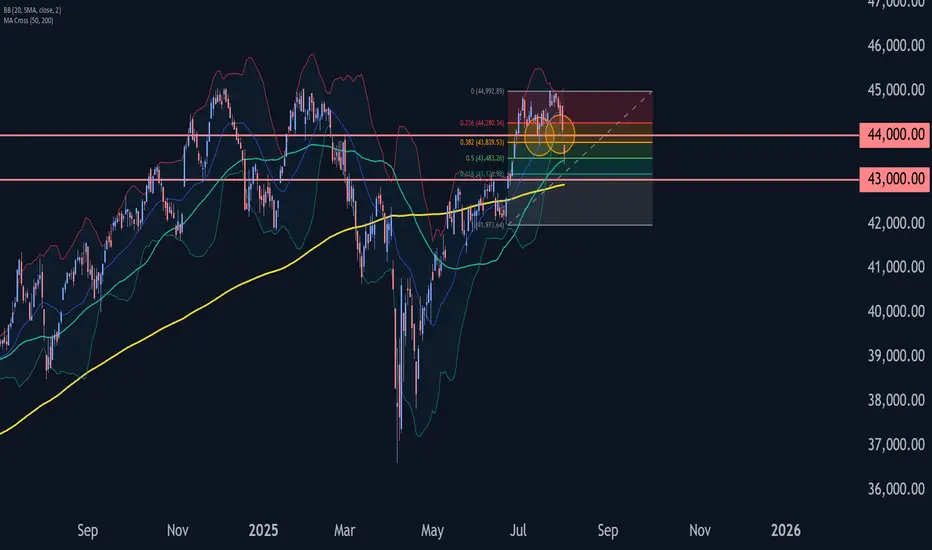
Dow Jones Triple Top & Critical Trendline Break - Buy The Dip?Potential Tripple Top formation spotted on the Dow. This would represent a full fibonacci retracement, which leads me to believe a 38.2 retest is likely. If this 23.6 level can hold support and price does not close below the fib band (orange channel), then the bullish continuation to new all time highs can still happen in Q3/Q4 of this year. The clear trendline break dating back to April is very concerning (white line), leading me to believe more downside in the coming weeks.
Let me know what you think in the comments!
Thanks

Shakeout On The WayUnlike the SPX, the DJI didn't make a higher-high. Why is this? I think partially because it's price weighted as opposed to market cap weighted like the Nasdaq or SPX. The other part would be CPI numbers.
So what's next for the DJI? I see hidden bullish divs long term and hidden bearish divs short term, this a common shake out tactic I see to liquidate longs and shorts. I'll be looking to load up on the trade at the bottom of the channel and play the range as it develops.
As always: stay calm, don't panic, and don't forget you can always use a stop loss
The fear and green index is at 74, when people are greedy be fearful.

US30 Bullish Bias!
HI,Traders !
#US30 went down and
Retested a horizontal
Support of 43775.2 from
Where we are seeing a
Bullish rebound so as we
Are bullish biased and we
Will be expecting a further
Bullish move up !
Comment and subscribe to help us grow !


US30 Faces Pressure Below 44610US30 Overview
Technical Outlook:
US30 is showing bearish momentum while trading below the pivot zone at 44610. As long as the price remains under this level, downside pressure may continue toward 44360, with further support at 44180.
However, a confirmed breakout above 44720 would shift the bias to bullish, opening the path toward 44910 and potentially 45100.
Support Levels: 44480 • 44360 • 44180
Resistance Levels: 44720 • 44910 • 45100
Bias: Bearish below 44610, Bullish above 44720

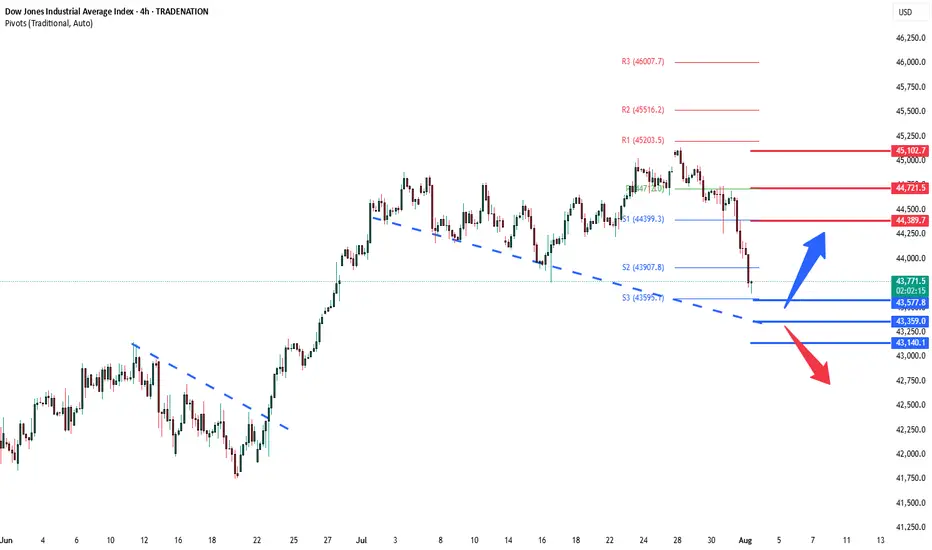
DowJones ahead of US Employment dataKey Support and Resistance Levels
Resistance Level 1: 44390
Resistance Level 2: 44720
Resistance Level 3: 45100
Support Level 1: 43580
Support Level 2: 43360
Support Level 3: 43140
This communication is for informational purposes only and should not be viewed as any form of recommendation as to a particular course of action or as investment advice. It is not intended as an offer or solicitation for the purchase or sale of any financial instrument or as an official confirmation of any transaction. Opinions, estimates and assumptions expressed herein are made as of the date of this communication and are subject to change without notice. This communication has been prepared based upon information, including market prices, data and other information, believed to be reliable; however, Trade Nation does not warrant its completeness or accuracy. All market prices and market data contained in or attached to this communication are indicative and subject to change without notice.
US30 Robbery Blueprint: Breakout, Pullback, Escape Setup💎 Dow Jones Robbery Blueprint: The US30 Vault Crack Plan 💎
(Maximized for reach — within TradingView title limit)
🌟Hi! Hola! Ola! Bonjour! Hallo! Marhaba!🌟
Dear Market Robbers & Money Movers 🕵️♂️💰🚨
This ain't your average analysis — it’s a Thief Trader-style 🔥tactical mission🔥 aimed at the mighty "US30/DJI" (Dow Jones Industrial Average). We're talkin' about a precision heist with a full blueprint: entry zones, trap setups, and escape exits. Read carefully — this ain’t for the faint-hearted traders! 🧠🦾
🧠 Entry Zones (The Break-In) 📈
🛠 ENTRY 1: Crack the wall near 44700.00 – that’s the resistance gate. Wait for confirmation.
🎯 ENTRY 2: Sneak in at the Market Makers’ Trap around 43500.00 – a dirty zone where retailers get baited. Perfect time to strike long!
🧱 DCA/Layering strategy recommended. Stack those buy orders like a thief layering explosives on a safe. 💣💸
🛑 Risk Levels (Escape Routes/Stop Loss)
🔊 "Listen up, vault raiders! Never drop your SL until breakout is confirmed. If you jump early, you might land in a bear trap! 🪤"
🔐 Stop Zones (Based on Strategy):
📌 Swing Buy SL (2H TF): Place at 44100.00 for the stealth buy.
🏦 Institutional SL (Swing Zone): Drop it around 43000.00
🔐 Max Risk SL (3H TF): If you're deep, your last stand is at 39200.00
☝️ SL depends on your position sizing, number of entries, and risk appetite. Trade like a thief, not a gambler.
🎯 Heist Target (Profit Exit)
🏁 Escape Point: 46200.00 — or exit before heat rises! Don’t be greedy. Rob and vanish. 💨💰
🔥 Market Mood: Why the Heist Is On
"US30/DJI" is bullish AF — thanks to:
📊 Macro-Economic Wind at Our Back
📈 Institutional momentum
📰 Strong sentiment and intermarket flows
Check your chart radar: Fundamentals + technicals aligning = green light for robbery! 🟢
⚠️ Tactical Reminder: News Can Jam the Plan
📵 Avoid new entries during major economic releases
🛡 Use trailing SLs to protect running trades
Stay alert, stay alive. 💡
❤️ Support the Robbery Crew
Hit that 💥BOOST💥 — your love fuels our next mission.
Join us and ride daily heist plans with Thief Trading Style 🏴☠️🚀💰

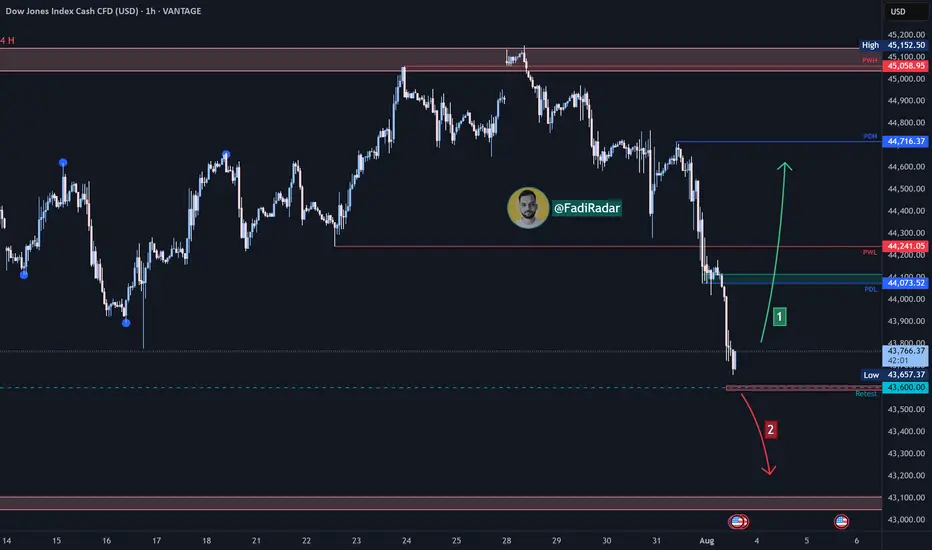
Dow Jones Index Analysis (US30 / Dow Jones):🔹 The Dow Jones index has seen a sharp decline over the past two days, approaching the 43,590 USD support zone.
1️⃣ If the price rebounds from this level and bullish momentum leads to a break and close above 44,100 USD, the index may retest the 44,700 USD area.
2️⃣ However, if the price breaks below 43,600 USD and holds, further downside is likely, with a potential move toward 43,100 USD.
⚠️ Disclaimer:
This analysis is not financial advice. It is recommended to monitor the markets and carefully analyze the data before making any investment decisions.
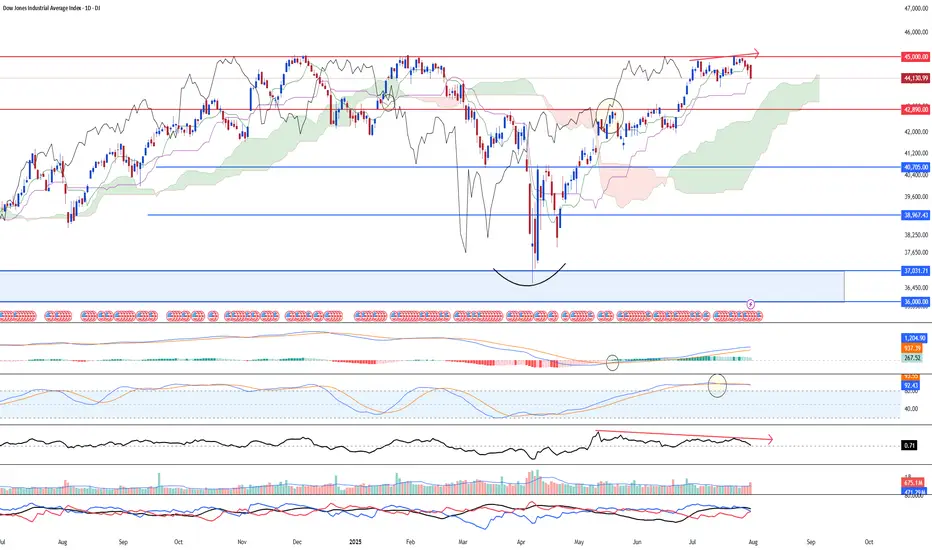
Correction ahead for DJIA, attributed to weak momentumDJ:DJI saw strong potential of a larger degree correction targeting 42,890 or lower support at 41,935. Reason being that there's a bearish divergence between the price chart and 23-period ROC. Furthermore, mid-term stochastic has shown bearish overbought signal. Another worthy price action signal showing weakness is that the index has fail to break above the high at 45,000 psychological level.
Despite the weak outlook, we are looking at a long-term upside targeting 46,200 (6 months and beyond)
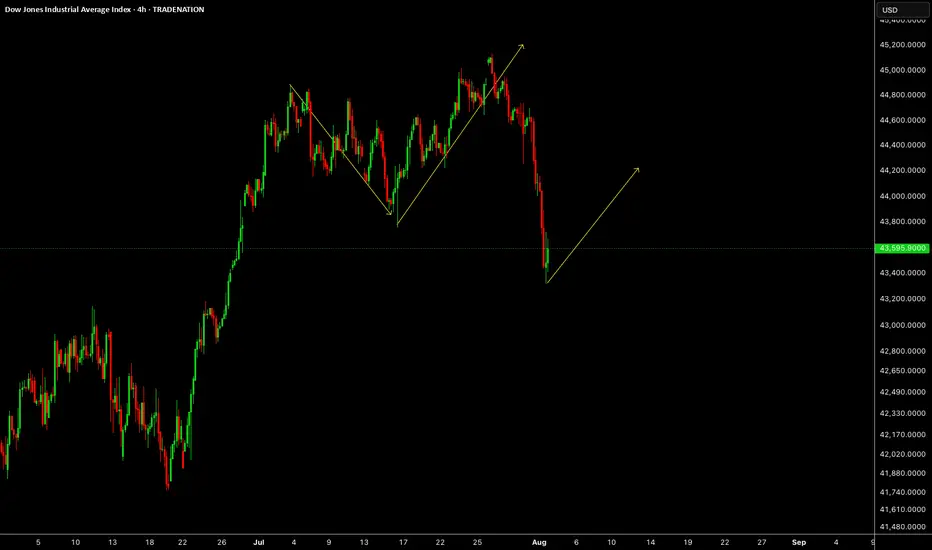
Dow Jones US30 Trend Analysis and Trade Plan Breakdown📈 US30 (Dow Jones) is currently in a strong bullish trend 🔥. This is clearly visible on the 4H chart, where we’re seeing a consistent pattern of higher highs and higher lows 🔼🔼.
👀 I’m watching for a potential long opportunity, especially since the higher timeframes remain firmly bullish 🟢.
🎥 In the video, we break it down:
A quick overview of the 4-hour structure
Then dive into a potential trade setup on the 30-minute chart ⏱️🔍
🧠 This is for educational purposes only and not financial advice ⚠️📚


DOW?
Hi
Decision timee
If you're buyers
WAIT
If you're sellers
WAIT
This week would give a clearer direction
I will have patience.
I am incline to be bullish
All the best
Not a guru

US30 Bearish Breakout!
HI,Traders !
#US30 made a bearish
Breakout of the key horizontal
Level of 44822.3which also
Seems to have been a neckline
Of the small H&S pattern so
We are locally bearish biased
And we will be expecting a
Further bearish move down !
Comment and subscribe to help us grow !
