US30 BuyUS30 displaying an uptrend, and price retraced back to an AOI
Targeting the last high created. let's see if price proceeds accordingly
Like & comment your thoughts
Follow for more ideas
USAIND trade ideas


US30 | Geopolitics in Focus – Key Pivot at 44950US30 Overview
Geopolitics dominates before the Fed takes the stage.
Putin’s position remains that Ukraine should cede all territory Russia has occupied — and even areas it has failed to capture in more than three years of fighting. This has been firmly rejected by Zelenskiy and European leaders, who will be alongside him in Washington when he meets Trump later today.
Technical Outlook:
The price holds bearish momentum toward 44720 and 44610 as long as it trades below 44950.
A 4H close above 44950 would shift the bias bullish toward 45100 and 45285.
Support: 44720, 44610, 44470
Resistance: 45100, 45285
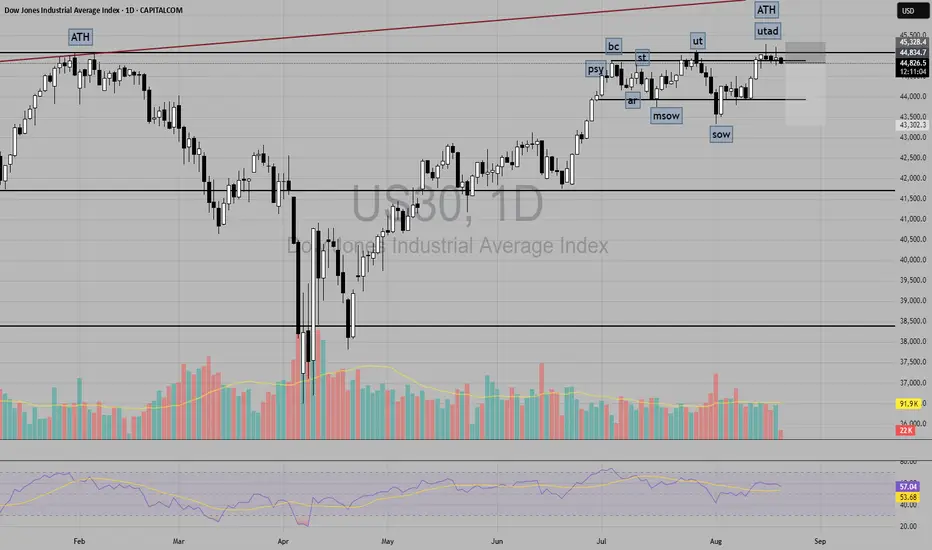
US30 - Market Structure, Confluence & FIBDear Friends in Trading,
How I see it,
Keynote:
Potential for price action to remain in limbo till Friday remains high.
Decisive breakouts required either way.
Just sharing my thoughts - (I have no evidence to back this up)
I'm keeping an eye on this one, maybe it's lagging behind NASDAQ.
Let me know if anything is unclear.
I sincerely hope my point of view offers a valued insight.
Thank you for taking the time study my analysis.
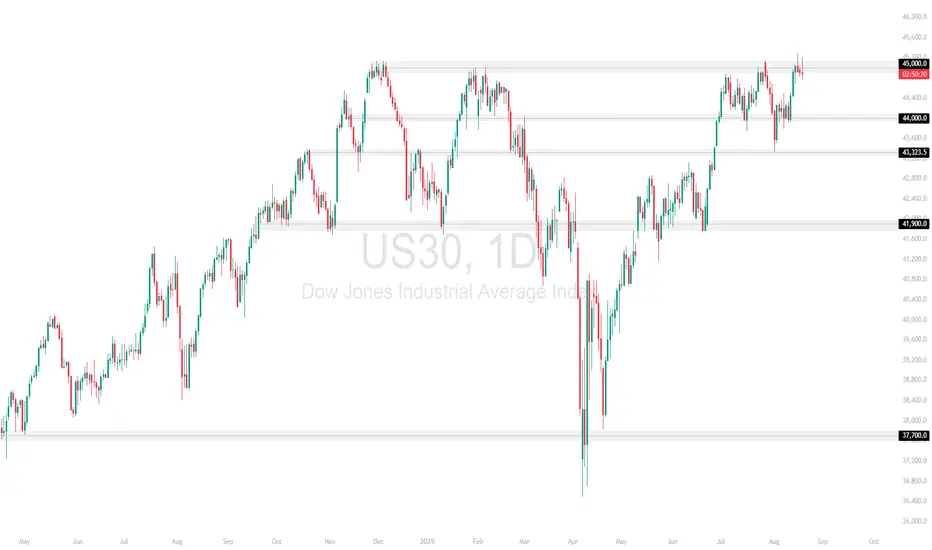
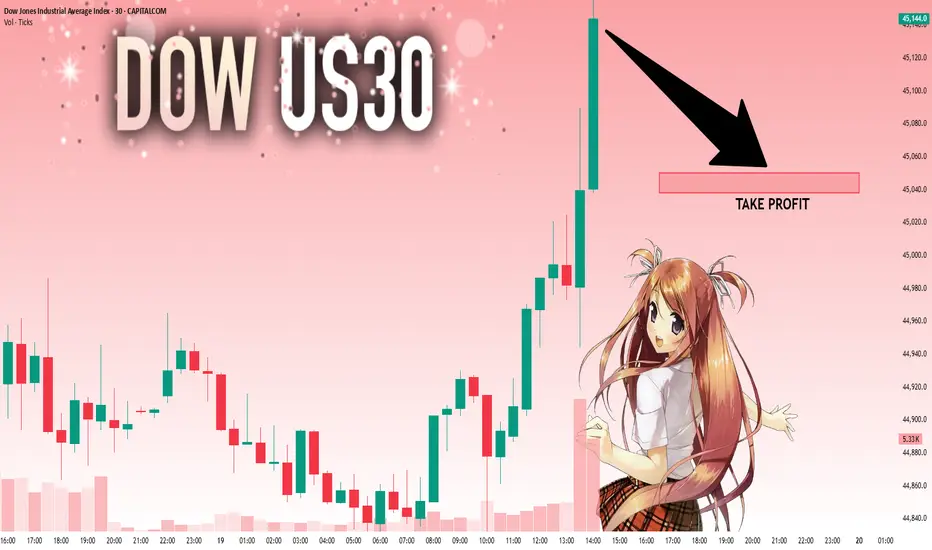
US30 Holding 45,000 – Key Zone in PlayUS30 is consolidating just under the 45,000.0 level after a strong rally, showing indecision at this resistance.
Support at: 44,000.0 🔽 | 43,323.5 🔽 | 41,900.0 🔽 | 37,700.0 🔽
Resistance at: 45,000.0 🔼
🔎 Bias:
🔼 Bullish: A breakout and close above 45,000.0 could extend upside momentum.
🔽 Bearish: Failure to hold may trigger a pullback toward 44,000.0 and 43,323.5.
📛 Disclaimer: This is not financial advice. Trade at your own risk.
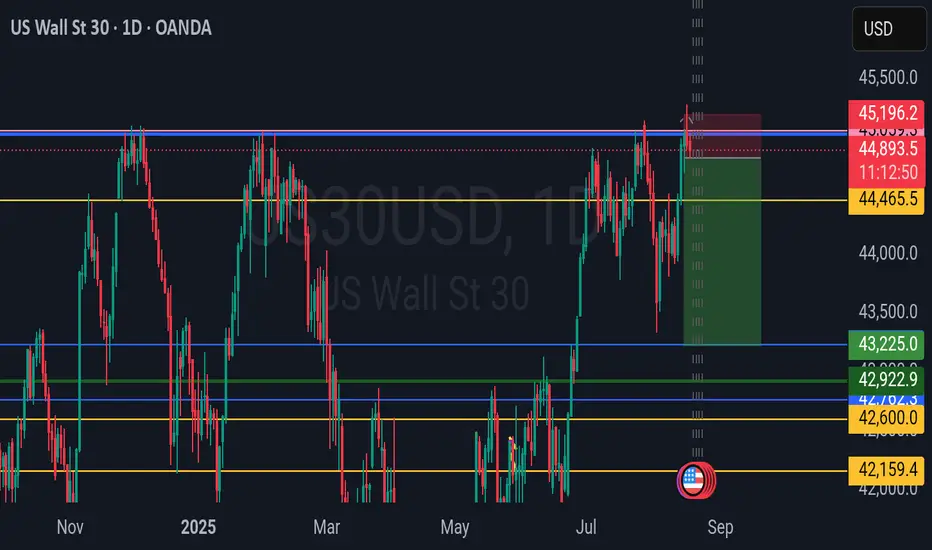
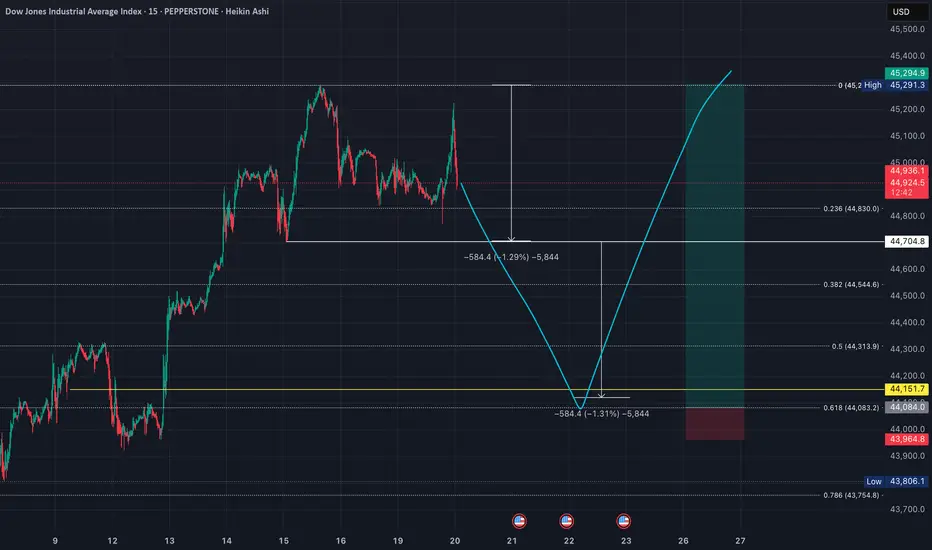
US30 (DOW): Equal Leg Projection Meets Fibonacci - Long SetupSharing my outlook on the Dow, which aligns with my NASDAQ analysis but with a specific mathematical approach. 📊
**🎯 The Setup:**
I'm targeting a long position based on an equal leg projection. Taking the range from the recent low to the all-time high, I expect a decline equal to that same distance. This projection perfectly coincides with the 0.618 Fibonacci level - a powerful confluence. 🎯
**📍 Entry Strategy:**
The beauty of this setup is the mathematical precision: the equal leg down from the high lands exactly at the 0.618 Fib level. This confluence gives me high confidence in this support zone for a potential long entry. ✅
**⚠️ Risk Management:**
Stop loss would be placed below the projected low, targeting new all-time highs. Clean entry, clear invalidation level. 🛑
**🧠 Why This Works:**
Equal leg projections are powerful tools in market analysis. When combined with key Fibonacci levels, they create high-probability reversal zones. The market often respects these mathematical relationships. 📐
**🔄 Bigger Picture Alignment:**
This setup aligns with my broader market view - expecting one final push higher before any significant correction. The Dow's equal leg projection gives us a precise entry point for this bullish thesis. 📈
**💡 Key Insight:**
When geometric projections align with Fibonacci levels, it creates what I call "mathematical harmony" in the markets. These setups often provide the best risk-adjusted opportunities. 🎵
📈 **This trade setup offers a risk-to-reward ratio of 10:1.** Without including fees, the breakeven win rate for this trade would be approximately 9.09%. Knowing these figures in advance helps me avoid emotional trading. 🧠
💡 **Pro Tip**: If you often find yourself trading based on emotions, I recommend doing this type of pre-planning and quantifying your setups before execution — it can be a simple yet highly effective improvement. ✅
---
**Trading is simple.** You don't need multiple indicators or dozens of lines on your chart. A clean and simple chart often works best — it keeps your decisions consistent and reduces uncertainty. Sure, it might not look flashy, and my analysis may seem a bit "plain" compared to others… but that's how I like it. If you find this analysis useful, feel free to follow me for more updates.
---
*Disclaimer: This post is for general informational and educational purposes only. It does not constitute financial advice, investment recommendation, or a service targeting specific investors, and should not be considered illegal or restricted information in any jurisdiction.*
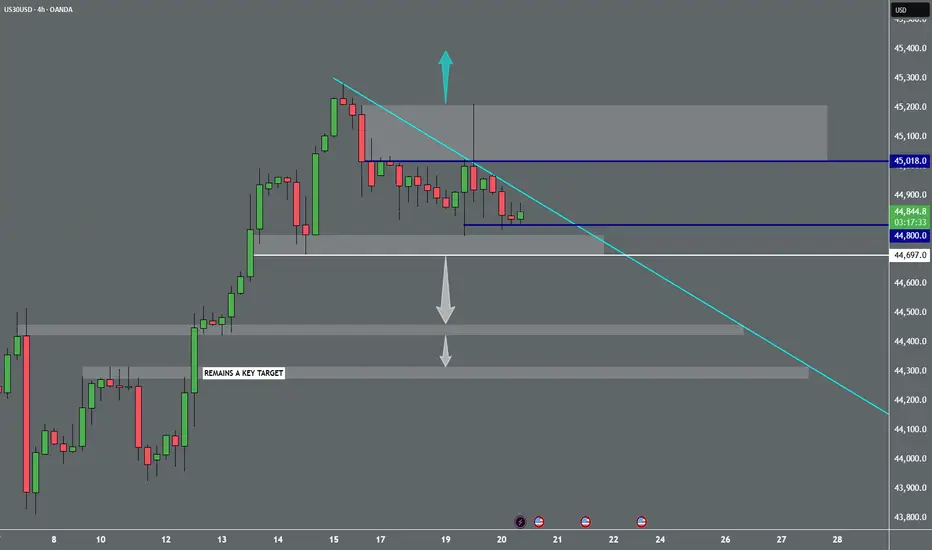
US30 (Dow Jones) 4H Chart AnalysisPotential Head & Shoulders Breakdown
Pattern: Head and Shoulders
Breakout Zone: ~44,796
Retest Expected before potential continuation lower
Entry: After confirmed rejection near 44,796 (retest zone)
Target: 43,738 (TP zone based on previous support)
Stop Loss: Above recent high (~44,837)
📉 If price respects the neckline and fails to break back above, I’ll be looking for short opportunities with favorable risk-reward.

US30: Next Move Is Down! Short!
My dear friends,
Today we will analyse US30 together☺️
The recent price action suggests a shift in mid-term momentum. A break below the current local range around 45,140.8 will confirm the new direction downwards with the target being the next key level of 45,050.1 and a reconvened placement of a stop-loss beyond the range.
❤️Sending you lots of Love and Hugs❤️
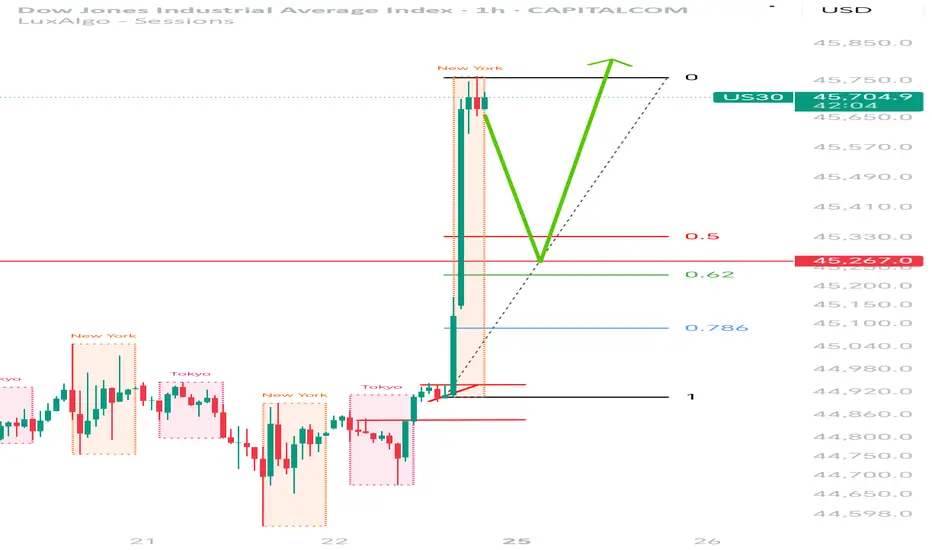
US30 New Record HighUS30 has registered a new record high.
I'm anticipating price to retrace towards the previously broken resistance level, which could act as a new support zone upon retest. I've pulled out my Fibonacci retracement tool📉📊, with particular attention to the golden ratio levels (0.618–0.65) as potential areas of interest for trade execution.🚀🎯🔥

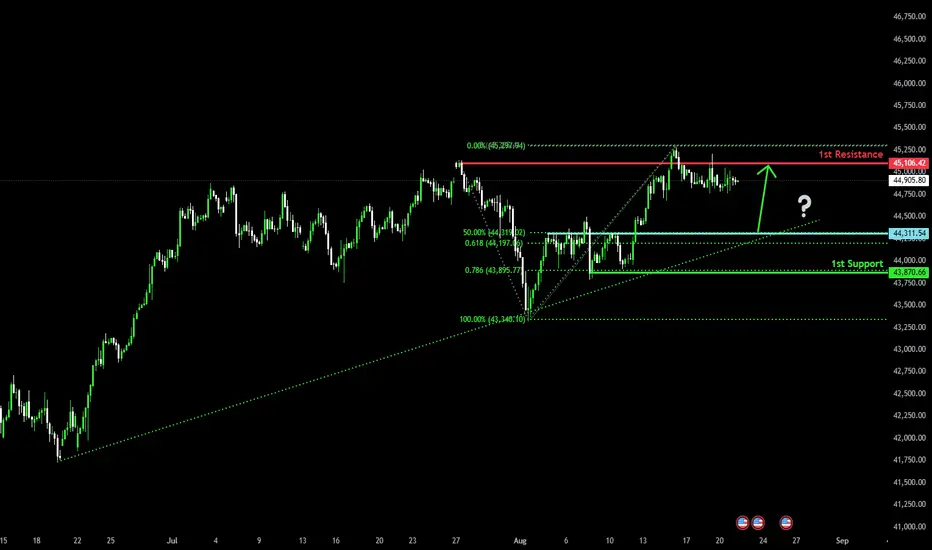
Could we see a bounce from here?Dow Jones (US30) is falling towards the pivot, which acts as a pullback support and could bounce to the 1st resistance, which is a multi-swing high resistance.
Pivot: 44,311.54
1st Support: 43,870.66
1st Resistance: 45,106.42
Risk Warning:
Trading Forex and CFDs carries a high level of risk to your capital and you should only trade with money you can afford to lose. Trading Forex and CFDs may not be suitable for all investors, so please ensure that you fully understand the risks involved and seek independent advice if necessary.
Disclaimer:
The above opinions given constitute general market commentary, and do not constitute the opinion or advice of IC Markets or any form of personal or investment advice.
Any opinions, news, research, analyses, prices, other information, or links to third-party sites contained on this website are provided on an "as-is" basis, are intended only to be informative, is not an advice nor a recommendation, nor research, or a record of our trading prices, or an offer of, or solicitation for a transaction in any financial instrument and thus should not be treated as such. The information provided does not involve any specific investment objectives, financial situation and needs of any specific person who may receive it. Please be aware, that past performance is not a reliable indicator of future performance and/or results. Past Performance or Forward-looking scenarios based upon the reasonable beliefs of the third-party provider are not a guarantee of future performance. Actual results may differ materially from those anticipated in forward-looking or past performance statements. IC Markets makes no representation or warranty and assumes no liability as to the accuracy or completeness of the information provided, nor any loss arising from any investment based on a recommendation, forecast or any information supplied by any third-party.

DJIA bull flagging ahead of 45KThe Dow has opened lower, but with all eyes on the Fed's Powell tomorrow the weakness can be explained away in part by profit-taking. Whether this turns into something more signifcant remains to be seen.
For now, the bullish trend is intact. The 45,000 level has been tested multiple times since November 2024, and this level has held as resistance every single time. Most recently, it was Friday when it finally looked like the bulls were given the all-clear. But the index turned lower to close below that hurdle and again frustrated the bulls.
So far, though, the downside has been limited on this latest failed breakout attempt. This suggests that the index is still gearing up for a potential breakout.
Short-term support at 44,750 has held so far this week, and was being tested again at the time of writing. Below here, 44,500 and then 44,300 are the next key short-term support levels. Even if we see renewed weakness here, so long as the long-term support in the range between 42,800 to 43,150 holds, the path of least resistance would still remain to the upside in so far as the slightly longer-term is concerned. Here, we also have the 200-day average residing.
By Fawad Razaqzada, market analyst with FOREX.com

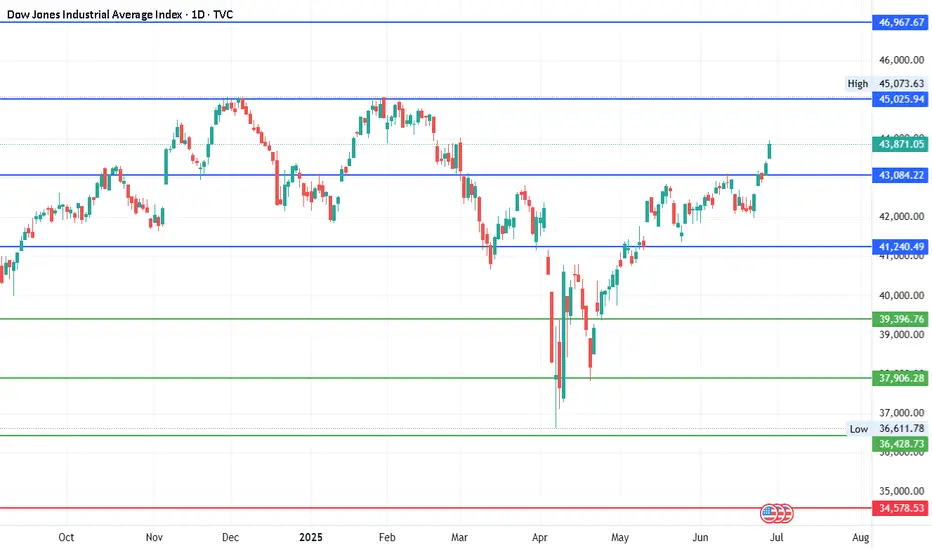
#DJI - 5000 Pts already moved out of 8000 points..Date: 27-06-2025
#DJI - 5000 Pts already moved out of 8000 points as posted on 22nd April. Another 3000 points to cover. we have different pivot for the next level up and it will be shared soon.
Old levels are as follows.
#DJI Upside Targets: 41240.49, 43084.22, 45025.94 and 46967.67
#DJI Downside Targets: 34578.53, 32728.34, 30786.61 and 28844.88
Current price is around 43,870 at the time of this post.


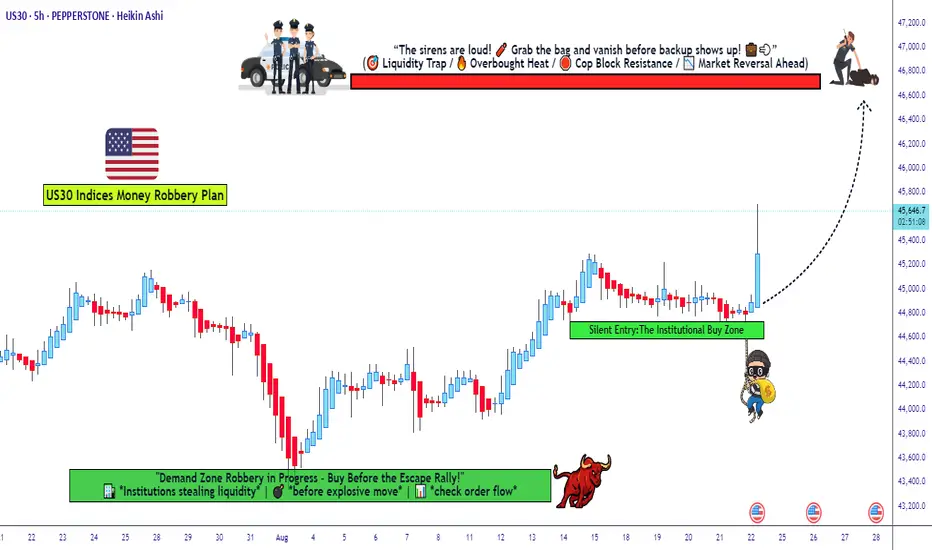
Dow Jones Bulls Preparing Another Robbery — Are You In?🚨💰 US30/DJ30 Index CFD Market Heist Plan 🏦🎭
🕵️ Dear Thief OG’s, Ladies & Gentlemen of the robbery squad… the vault is wide open again! This time we’re sneaking into the Dow Jones (US30) for a Bullish Day/Swing Heist. 🔥
🎯 Robbery Blueprint
Asset: US30/DJ30 Index CFD (Day/Swing Trade)
Plan: Bullish 📈
Entry (Thief Style):
The thief never knocks once… we layer the doors! Multiple buy limit orders 🔐:
Layer 1 → 45,600.0
Layer 2 → 45,400.0
Layer 3 → 45,200.0
(You can expand the layers depending on your risk appetite 🕳️)
Stop Loss (SL) 🛑:
📍 Thief SL @ 44,600.0
(Adjust based on your own risk & startergy – remember, survival is key in every robbery 🏃💨)
Target (TP) 🎯:
🚓 Police barricade spotted @47,000.0! Our sweet escape is planned at 46,800.0 before sirens catch us. 💰
🏆 Thief Strategy
Multiple limit order entries (layering method / scaling in).
Enter at any price level if you’re fast, but layering is the OG Thief move.
Manage your SL & risk like a pro robber – no reckless moves, or you’ll end up behind market bars! 🚔
💡 Why This Heist? 💡
The US30/DJ30 is primed for a bullish run 📈, driven by real-time market signals:
Technical Analysis: Strong support levels holding firm, momentum indicators screaming bullish! 📊
Fundamental Outlook: Check global market data, COT reports, and sentiment analysis for confirmation. 🔗👉
Volatility Watch: Stay sharp for news releases that could spike volatility. 📰⚠️
⚠️ Thief’s Risk Management ⚠️
News Alert: Avoid new trades during major news drops to dodge wild price swings. 🚫
Position Management: Use trailing stops to lock in those sweet profits. 🔐
Risk Control: Adjust lot sizes and SL based on your layered entries and risk profile. 📉
🏆 Join the Heist! 🏆
💥 Hit the Boost Button 💥 to power up our Thief Trader crew! 🚀 Let’s make bank with ease using the Thief Trading Style! 💸😎 Stay tuned for the next heist plan, and let’s keep robbing the markets! 🤑🐱👤
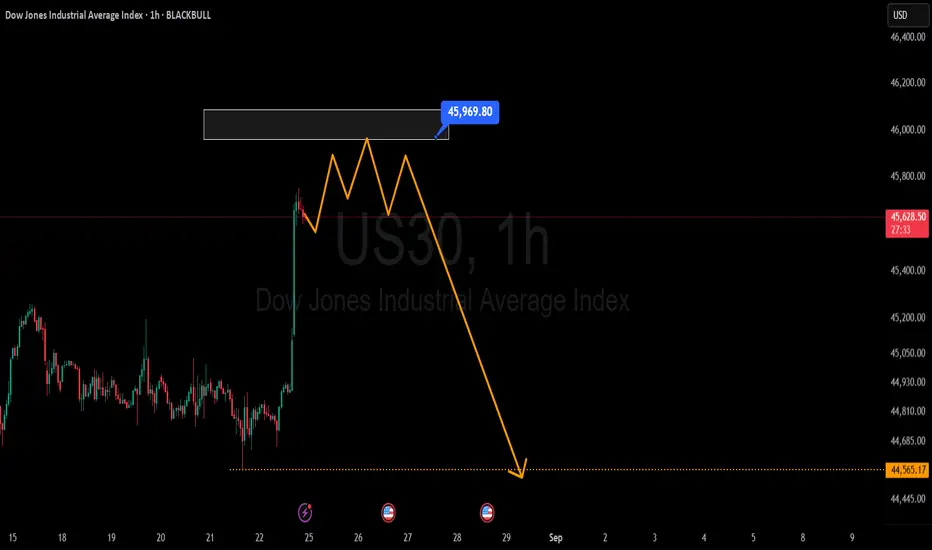
Breaking: Dow Jones's Overbought RSI Signals Correction Risk
Current Price: $45631.74
Direction: SHORT
Targets:
- T1 = $45150.00
- T2 = $44500.00
Stop Levels:
- S1 = $46000.00
- S2 = $46350.00
**Wisdom of Professional Traders:**
This analysis synthesizes insights from thousands of seasoned traders and market experts who closely monitor the Dow Jones. Leveraging collective intelligence, this approach identifies exaggerated momentum trends and potential reversal points. Many professionals agree that while the Dow Jones has gained significant ground, conditions such as overbought RSI and failing momentum indicators suggest a high-probability corrective phase.
**Key Insights:**
The Dow Jones has surged in value over the past weeks amid increased optimism regarding economic resilience and robust earnings reports from major corporates. However, key technical indicators are flashing warning signs. The Relative Strength Index (RSI) shows extreme overbought conditions above 70, historically a precursor to price stagnation or correction. Volume analysis also reveals weakness in buying pressure, further supported by bearish divergence across key oscillators.
The macroeconomic landscape remains a potential catalyst for volatility, with central banks globally hinting at further tightening amid stubborn inflation. Traders are advised to remain cautious as equity indices like the Dow Jones frequently react sharply to rate hikes or hawkish policy outlooks.
**Recent Performance:**
The Dow Jones has rallied more than 8% in the past month, driven by improving sentiment around corporate profitability and relief over lighter-than-expected economic data. However, upward momentum appears to be stalling at key resistance levels, as price activity creates narrowing candles, indicative of indecision. Furthermore, recent sessions have seen increased intraday failures to hold higher price levels, signaling weakening upside conviction.
**Expert Analysis:**
Prominent financial analysts are flagging concerns about the Dow's sustainability in this high-price zone. Market technicians observe multiple bearish technical patterns forming, including divergence on the MACD and a thinning Bollinger Band width indicating lower volatility ahead. These signals, combined with declining buyer enthusiasm, make the current trading environment ripe for a potential pullback. On the fundamental side, persistently elevated interest rates and looming recessionary fears may continue to weigh on valuation multiples.
**News Impact:**
Recent news surrounding geopolitical instability and renewed supply chain disruptions may add pressure on sentiment, fueling a risk-off environment. Additionally, upcoming earnings reports could spark further volatility as the market adjusts to existing macroeconomic headwinds. While some major companies have outperformed expectations, overall guidance leans cautious, emphasizing the need for traders to tread carefully.
**Trading Recommendation:**
Given the overextended technicals and diminishing buying momentum, taking a SHORT position on the Dow Jones presents a sensible choice. Price action and technical indicators suggest a correction phase is plausible, offering opportunities to capitalize on expected downside movements. Setting tight stop-losses around $46350 ensures protection in case the index defies odds and breaches resistance levels further. Maintain vigilance against macroeconomic updates that could cause abrupt sentiment changes.
Do you want to save hours every week? Register for the free weekly update in your language!

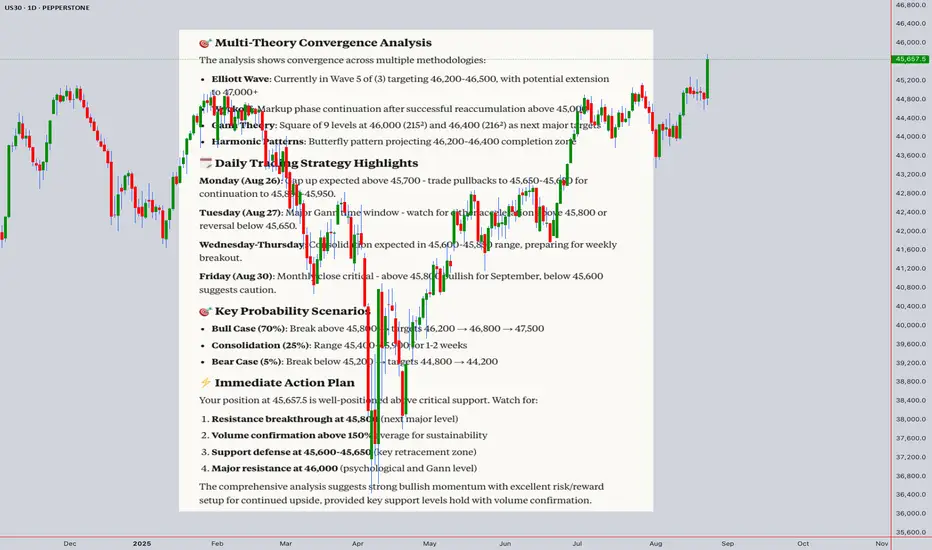
US30 Comprehensive Technical Analysis & Daily Trading Strategy# US30 Comprehensive Technical Analysis & Daily Trading Strategy
**Current Position**: 45,657.5 (Aug 23, 2025, 12:50 AM UTC+4)
* 🎯 Executive Summary
US30 positioned above critical 45,000 resistance turned support, showing bullish momentum with multiple theory convergence suggesting continuation toward 46,200-46,800 zone, with 70% upside probability.
---
# 📊 MULTI-TIMEFRAME TECHNICAL ANALYSIS
*INTRADAY ANALYSIS (5M - 4H)**
*5-Minute Timeframe Analysis**
*# Candlestick Patterns
*Current Formation**: Bullish flag consolidation after breakout
*Key Patterns**:
*Hammer/Doji near 45,600**: Bullish continuation signal
*Shooting Star above 45,750**: Take profit/reversal warning
*Volume Confirmation**: Required above 150% average for sustainability
*# Technical Indicators
*RSI(14)**: 58-62 (Bullish momentum zone)
*VWAP**: 45,635 ± 25 (Dynamic support/resistance)
*Bollinger Bands**: Upper band test at 45,720, expansion phase active
*EMA(20)**: 45,610 (immediate dynamic support)
*# Entry/Exit Signals
*Long Entry**: Break above 45,680 with volume
*Stop Loss**: Below 45,580 (100 point risk)
*Target 1**: 45,780 (R:R 1:1)
*Target 2**: 45,850 (R:R 1:1.7)
*15-Minute Timeframe Analysis**
*# Harmonic Patterns
*Active Pattern**: Bullish ABCD completion at 45,200-45,250
*Butterfly Extension**: Target projection 46,200-46,400
*Fibonacci Confluence**:
- 61.8% extension at 46,180
- 78.6% extension at 46,450
*# Wyckoff Analysis
*Phase**: Markup phase after successful reaccumulation
*Character of Movement**: Strong hands accumulating
*Volume**: Increasing on advances (bullish confirmation)
*Next Expected**: Continued markup to distribution zone
*# Entry Strategy (15M)
*Pullback Entry**: 45,580-45,620 support zone
*Stop Loss**: Below 45,520 (60-100 point risk)
*Target**: 45,820-45,900
*Risk/Reward**: 1:2.5
*30-Minute Timeframe Analysis**
*# Elliott Wave Count
*Primary Count**: Wave 5 of (3) in progress
- Wave 1: 44,500 → 45,200
- Wave 2: 45,200 → 44,900
- Wave 3: 44,900 → 45,650 (current)
- Wave 4 Expected: 45,400-45,500
- Wave 5 Target: 46,200-46,500
*# Alternative Count
*Wave (3) Extension**: Current move as wave 3 of 5
*Target**: 46,800-47,200
*Invalidation**: Below 45,200
*# W.D. Gann Analysis
*Square of 9**:
- 45,600 = 214² ÷ 10 (current support)
- 46,000 = 215² ÷ 10 (next major resistance)
- 46,400 = 216² ÷ 10 (extended target)
*Time Theory**: Next major turn window Aug 27-29
*Angle Theory**: 1x1 Gann line at 45,200 (major support)
*1-Hour Timeframe Analysis**
*# Ichimoku Kinko Hyo
*Tenkan-sen (9)**: 45,640 (current support)
*Kijun-sen (26)**: 45,480 (strong support)
*Kumo Cloud**: 45,200-45,400 (support zone)
*Chikou Span**: Clearly above price (bullish)
*Future Cloud**: Bullish twist confirmed for next 26 periods
*# Moving Averages Matrix
*SMA(20)**: 45,520
*EMA(20)**: 45,580
*SMA(50)**: 45,320
*EMA(50)**: 45,410
*SMA(200)**: 44,800
*Golden Cross Status**: All short-term MAs above long-term (bullish)
*# 1H Trading Setup
*Bull Flag Pattern**: Breakout above 45,700
*Entry**: 45,720 with volume confirmation
*Stop**: 45,550 (170 point risk)
*Target 1**: 45,950 (R:R 1:1.35)
*Target 2**: 46,200 (R:R 1:2.8)
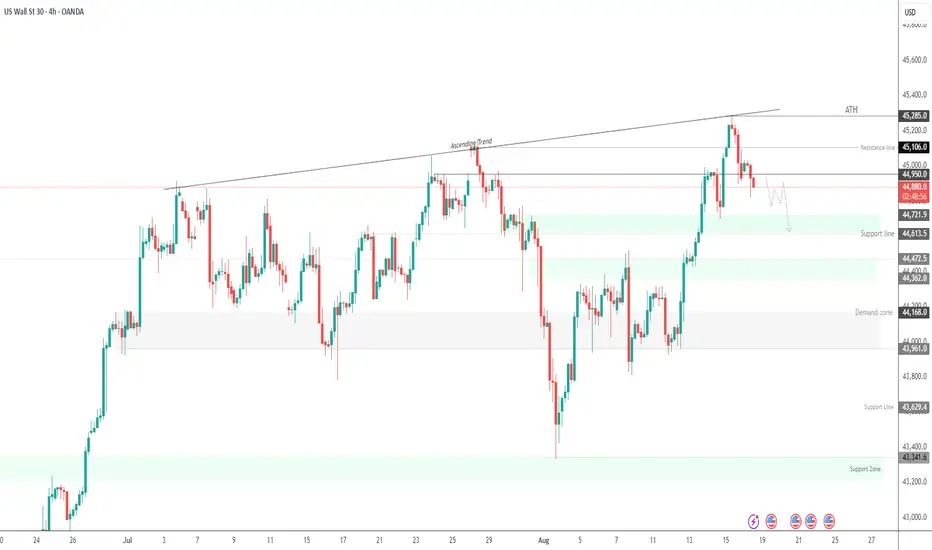
*4-Hour Timeframe Analysis**
*# Advanced Pattern Recognition
*Cup & Handle**: Handle formation in progress
*Ascending Triangle**: Base at 45,000, apex at 45,750
*Volume Profile**: Point of Control at 45,400
*Key Levels**:
*Major Support**: 45,000-45,200
*Minor Support**: 45,400-45,500
*Minor Resistance**: 45,750-45,800
*Major Resistance**: 46,000-46,200
*# 4H Swing Strategy
*Pattern**: Bullish continuation after consolidation
*Entry Zone**: 45,500-45,600 on pullbacks
*Stop Loss**: Below 45,200 (300-400 point risk)
*Target 1**: 46,200 (R:R 1:1.5)
*Target 2**: 46,800 (R:R 1:3)
*Target 3**: 47,200 (R:R 1:4)
---
# 📈 SWING ANALYSIS (4H - Monthly)
*Daily Timeframe**
* Elliott Wave Structure
*Supercycle**: Wave (V) from 2020 lows in progress
*Cycle**: Wave 3 of (V) extension phase
*Primary**: Wave (3) of 3 targeting 47,000-48,000
*Intermediate**: Currently in wave 5 of (3)
* Long-term Wave Count
*Wave (1)**: 18,591 → 29,568 (COVID recovery)
*Wave (2)**: 29,568 → 24,681 (correction)
*Wave (3)**: 24,681 → current (in progress)
- Target: 50,000-52,000 (1.618 extension)
* Wyckoff Daily Analysis
*Phase**: Markup phase continuation
*Accumulation**: Completed between 40,000-42,000
*Character**: Professional money leading
*Distribution Signs**: None yet, markup continuing
* Gann Daily Forecasting
*Master Time Cycle**: 180-day cycle bullish through Q4 2025
*Price Squares**:
- 46,225 = 215² (immediate target)
- 47,524 = 218² (major target)
- 48,841 = 221² (extended target)
*Seasonal**: September-October historically strong for Dow
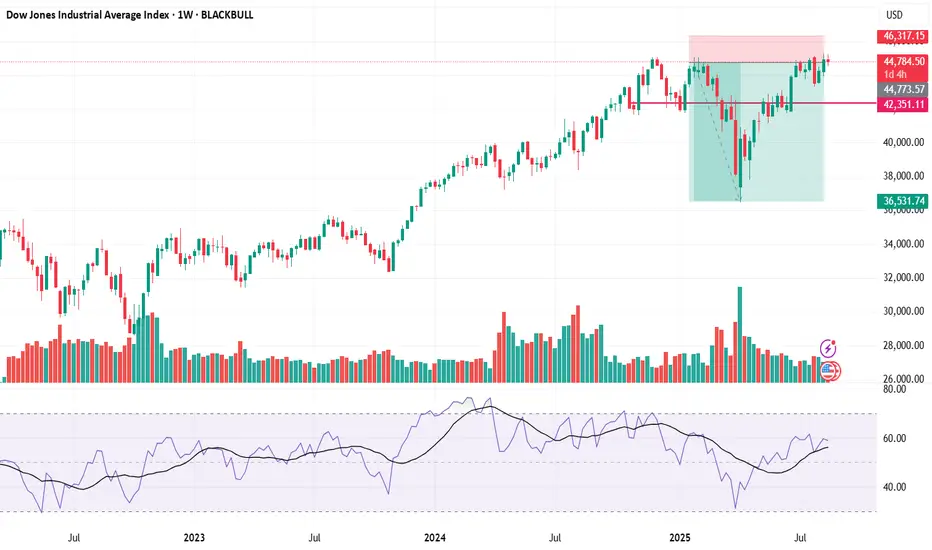
*Weekly Timeframe**
* Major Elliott Wave Structure
*Grand Supercycle**: Wave (III) from 1932 lows
*Supercycle**: Wave (V) of III in final stages
*Cycle**: Wave 3 of (V) - strongest part of bull market
* Weekly Harmonic Analysis
*Shark Pattern**: Completion target 47,500-48,000
*Crab Pattern**: Deep retracement only if below 42,000
*ABCD Extensions**: 1.272 at 46,800, 1.618 at 48,200
* Weekly Gann Analysis
*Annual Cycle**: Bullish through early 2026
*Master Numbers**:
- 47,000 (major psychological and Gann level)
- 48,000 (strong resistance zone)
- 50,000 (major long-term target)
*Monthly Timeframe**
* Macro Structure Analysis
*Primary Degree**: Wave (5) of V nearing completion
*Long-term Target**: 52,000-55,000 (final wave target)
*Timeline**: Peak expected 2026-2027
*Post-Peak Correction**: Potentially 30-40% decline
* Monthly Indicators
*RSI**: 65 (bullish but watch for divergence)
*MACD**: Strong bullish momentum
*Volume**: Confirming uptrend
*Seasonal Pattern**: Q4 typically strong for Dow Jones
---
# 📋 CRITICAL LEVELS & TARGETS
*Immediate Levels (24-48 Hours)**
* Resistance Zones
*R1**: 45,750-45,800 (immediate)
*R2**: 45,900-45,950 (minor)
*R3**: 46,050-46,100 (significant)
*R4**: 46,200-46,300 (major)
* Support Zones
*S1**: 45,550-45,600 (immediate)
*S2**: 45,400-45,450 (minor)
*S3**: 45,200-45,300 (significant)
*S4**: 45,000-45,100 (major/psychological)
*Short-term Targets (1-2 Weeks)**
* Bullish Scenario (70% Probability)
*Target 1**: 46,200-46,400
*Target 2**: 46,800-47,000
*Target 3**: 47,500-47,800
* Bearish Scenario (30% Probability)
*Target 1**: 44,800-45,000
*Target 2**: 44,200-44,500
*Target 3**: 43,500-43,800
*Medium-term Projections (1-3 Months)**
* Primary Uptrend Scenario
*Phase 1**: 46,500-47,000 (September)
*Phase 2**: 47,500-48,000 (October)
*Phase 3**: 48,500-50,000 (November-December)
* Correction Scenario
*Pullback Target**: 42,000-43,500
*Duration**: 4-8 weeks
*Recovery**: Q1 2026 new highs
---
# 📅 DETAILED DAILY TRADING STRATEGIES
*MONDAY, AUGUST 26, 2025**
* Pre-Market Analysis
*Gap Assessment**: Expected gap up 50-100 points
*Key Level**: Hold above 45,600 for continuation
*Volume Requirement**: >120% average for gap sustainability
*Morning Session (9:30 AM - 12:00 PM EST)**
*# Setup 1: Gap & Go Strategy
*Condition**: Gap up >45,700 with volume
*Entry**: First pullback to 45,650-45,680
*Stop Loss**: 45,580 (70-100 point risk)
*Target 1**: 45,850 (R:R 1:1.7)
*Target 2**: 45,950 (R:R 1:2.7)
*# Setup 2: Breakout Play
*Entry**: Break above 45,780 with volume >150% avg
*Stop Loss**: 45,680 (100 point risk)
*Target 1**: 45,920 (R:R 1:1.4)
*Target 2**: 46,080 (R:R 1:3)
*Afternoon Session (12:00 PM - 4:00 PM EST)**
*# Setup 3: Flag Pattern Continuation
*Setup**: Pullback to 45,620-45,650 support
*Entry**: Bounce with volume confirmation
*Stop**: 45,550 (70-100 point risk)
*Target**: 45,850-45,920
* Risk Management - Monday
*Max Position Size**: 2% account risk
*Max Daily Loss**: 3% of account
*News Watch**: Economic data releases, Fed officials
---
*TUESDAY, AUGUST 27, 2025**
* Market Context
*Gann Time Window**: Major turn date potential
*Technical Focus**: Momentum continuation vs. profit-taking
*Volume Expected**: Above average
*Trading Sessions**
*# Setup 1: Trend Continuation
*Bullish Follow-through**: If Monday closes >45,750
- Entry: Pullback to 45,700-45,730
- Stop: 45,620 (80-110 point risk)
- Target 1: 45,920 (R:R 1:2)
- Target 2: 46,150 (R:R 1:4)
*# Setup 2: Reversal Recognition
*Bearish Reversal**: If rejection from 46,000 area
- Entry: Break below 45,650
- Stop: 45,750 (100 point risk)
- Target 1: 45,450 (R:R 1:2)
- Target 2: 45,250 (R:R 1:4)
*# Setup 3: Range Trading
*Consolidation Range**: 45,600-45,850
*Buy Zone**: 45,600-45,630
*Sell Zone**: 45,820-45,850
*Stops**: 50 points outside range
---
*WEDNESDAY, AUGUST 28, 2025**
* Market Dynamics
*Mid-week Character**: Often consolidation day
*Pattern Development**: Triangle/flag completion expected
*Federal Reserve**: Watch for policy communications
*Strategy Focus**
*# Setup 1: Breakout Preparation
*Consolidation Pattern**: Symmetrical triangle
*Breakout Level**: Above 45,880 or below 45,550
*Volume Requirement**: >200% average for valid break
*Target Distance**: Equal to triangle height (~300 points)
*# Setup 2: Scalping Strategy
*Timeframe**: 5-15 minutes
*Range**: 45,650-45,750
*Entry Signals**: RSI oversold/overbought extremes
*Targets**: 25-50 point moves
*Stops**: Tight 20-30 points
* Risk Parameters - Wednesday
*Reduced Position Size**: Anticipating lower volatility
*Tighter Stops**: Market likely range-bound
*Multiple Small Trades**: Rather than swing positions
---
*THURSDAY, AUGUST 29, 2025**
* Technical Setup
*Elliott Wave**: Potential wave completion
*Harmonic Patterns**: Butterfly/Gartley completion zones
*Volume Pattern**: Building for Friday breakout
*Primary Strategies**
*# Setup 1: Pre-Breakout Positioning
*Accumulation Zone**: 45,600-45,700
*Distribution Zone**: 45,900-46,000
*Position Size**: Larger for Friday breakout
*# Setup 2: Pattern Completion
*Harmonic Entry**: 45,580-45,620 (Butterfly D point)
*Stop Loss**: Below 45,500
*Targets**: 45,900, 46,200, 46,500
*High probability setup**: Multiple confirmations
---
*FRIDAY, AUGUST 30, 2025**
* Weekly Close Significance
*Monthly Close**: Critical for long-term charts
*Options Expiration**: Increased volume and volatility
*Position Squaring**: Professional money adjusting
*End-of-Week Strategies**
*# Setup 1: Weekly Breakout
*Above 45,900**: Bullish for next week
- Target: 46,200-46,500
- Stop: 45,650
- Hold over weekend if strong close
*# Setup 2: Weekly Reversal
*Below 45,500**: Bearish warning
- Target: 45,200-45,000
- Stop: 45,650
- Consider closing before weekend
*# Setup 3: Month-End Positioning
*Strong Close >45,800**: Monthly bullish signal
*Weak Close <45,600**: Caution for September
*Volume Analysis**: Key for validation
---
# ⚠️ COMPREHENSIVE RISK MANAGEMENT
*Position Sizing Framework**
* Account Risk Models
*Conservative**: 1% risk per trade
*Moderate**: 2% risk per trade
*Aggressive**: 3% risk per trade (maximum)
* Dynamic Sizing Formula
```
Position Size = (Account Equity × Risk %) ÷ Stop Distance
```
* Volatility Adjustment
*High Volatility Days**: Reduce position size by 25-50%
*Low Volatility Days**: Standard position size
*News Event Days**: Reduce or avoid new positions
*Stop Loss Methodology**
* Technical Stops
*5M Chart**: Recent swing high/low + 20 points
*15M Chart**: Support/resistance + 30 points
*1H Chart**: Key levels + 50 points
*4H Chart**: Major levels + 100 points
* Time-Based Stops
*Scalping**: Maximum 1-2 hours in trade
*Day Trading**: Close all positions by 3:45 PM EST
*Swing Trading**: Re-evaluate every 48 hours
*Profit Taking Strategy**
* Scaling Out Method
*25% at Target 1**: Lock in profits early
*50% at Target 2**: Secure majority of gains
*25% at Target 3**: Let winners run
* Trailing Stops
*Initial**: 50% of original stop distance
*Progressive**: Tighten as profits increase
*Final**: Break-even + spread when possible
---
# 📊 WEEKLY PERFORMANCE FRAMEWORK
*Success Metrics**
* Primary KPIs
*Win Rate**: Target >60%
*Risk/Reward Ratio**: Minimum 1:2 average
*Maximum Drawdown**: Limit to 8% weekly
*Profit Factor**: Target >1.5
*Sharpe Ratio**: Measure risk-adjusted returns
* Trade Quality Assessment
*A-Grade Trades**: All confirmations present (>80% win rate)
*B-Grade Trades**: Most confirmations (60-70% win rate)
*C-Grade Trades**: Few confirmations (40-50% win rate)
*Avoid D-Grade**: Insufficient setup quality
*Weekly Review Protocol**
* Analysis Questions
1. **Setup Quality**: Were entry criteria consistently met?
2. **Risk Management**: Were stops appropriate for volatility?
3. **Market Context**: How did fundamental factors impact technicals?
4. **Execution**: Were entries and exits well-timed?
5. **Emotional State**: Did psychology affect trading decisions?
* Continuous Improvement
*Pattern Recognition**: Which setups worked best?
*Market Conditions**: Optimal volatility ranges for strategies
*Time of Day**: Most profitable trading hours
*News Impact**: How events affected technical levels
---
# 🚨 CRITICAL ALERTS & DECISION POINTS
*Immediate Alerts (Next 24-48 Hours)**
* Bullish Catalysts
*Break above 45,800**: Accelerated move to 46,200
*Volume spike >200%**: Confirms breakout validity
*Gap up >100 points**: Strong institutional interest
* Bearish Warnings
*Break below 45,400**: Correction deepening
*Volume spike on decline**: Distribution signals
*Multiple rejections at 46,000**: Resistance holding
*Weekly Watchpoints**
* Technical Invalidations
*Elliott Wave**: Below 45,200 invalidates bullish count
*Harmonic Patterns**: Failure at 45,580 negates butterfly
*Wyckoff**: Below 45,000 suggests distribution
* Confirmation Signals
*Volume Surge**: Above average on advances
*Breadth**: Individual Dow components participating
*Sector Rotation**: Industrial strength supporting index
*Monthly Considerations**
* September Seasonality
*Historical Tendency**: Weakest month for equities
*Strategy Adjustment**: More conservative positioning
*Hedging**: Consider protective puts if extended
* Federal Reserve Impact
*Policy Meetings**: September 17-18 FOMC
*Economic Data**: Employment, inflation reports
*Market Sensitivity**: Tech sector influence on Dow
---
# 🎯 SCENARIO PLANNING
*Base Case Scenario (70% Probability)**
* Bullish Continuation
*Next Week**: 46,200-46,500 target range
*September**: Consolidation 45,500-47,000
*Q4 2025**: New highs 47,500-50,000
*Catalysts**: Strong earnings, Fed dovishness
*Alternative Scenarios**
* Correction Scenario (25% Probability)
*Trigger**: Break below 45,000 with volume
*Target**: 43,500-44,500 (Fibonacci support)
*Duration**: 4-8 weeks
*Recovery**: Q1 2026 resumption
* Extended Rally (5% Probability)
*Trigger**: Break above 47,000 with strong volume
*Target**: 50,000-52,000 (Elliott Wave target)
*Timeline**: Q4 2025 - Q1 2026
*Risk**: Overextension, sharp correction follows
---
**⚡ EXECUTION SUMMARY**: US30 at 45,657.5 is positioned for continued upside with multiple technical confirmations. Key resistance at 45,800-46,000 must be cleared with volume for next leg higher. Strict risk management essential given elevated levels and potential for increased volatility.
For those interested in further developing their trading skills based on these types of analyses, consider exploring the mentoring program offered by Shunya dot Trade.(world wide web shunya dot trade)
I welcome your feedback on this analysis, as it will inform and enhance my future work.
Regards,
Shunya.Trade
world wide web shunya dot trade
⚠️ Disclaimer: This post is educational content and does not constitute investment advice, financial advice, or trading recommendations. The views expressed here are based on technical analysis and are shared solely for informational purposes. The stock market is subject to risks, including capital loss, and readers should exercise due diligence before investing. We do not take responsibility for decisions made based on this content. Consult a certified financial advisor for personalized guidance.