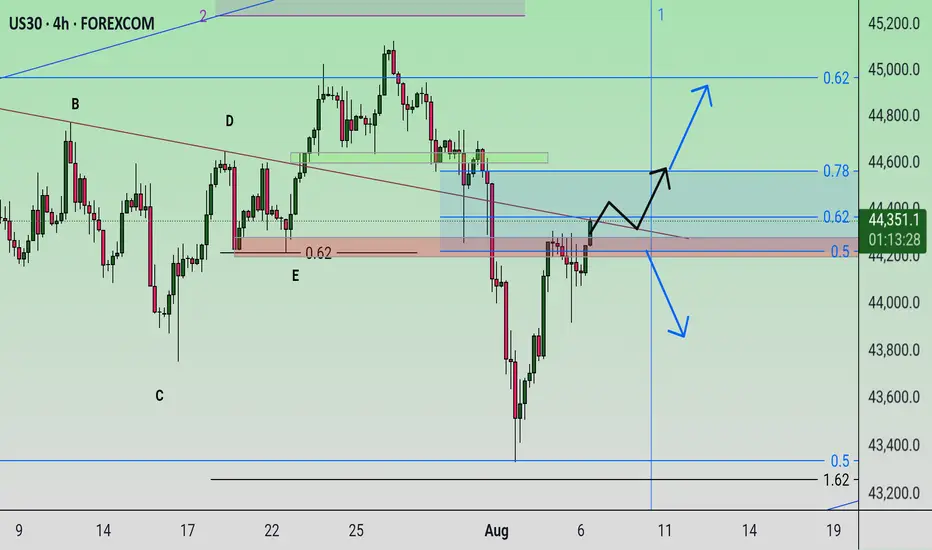
us30signal: sell (downtrend-H1)
setup: correction (wa to wb to wc)
confirmation:
1. fibo yes
2. snd yes
3. sbt yes
USAIND trade ideas
US30 with A/J strategy Not saying that mach please keep in mind we have to protect the capital and follow the trend move please read the candles and follow the moves we have strong high on 1hr and 4hr also quick shift when you look down 15m S/Lows

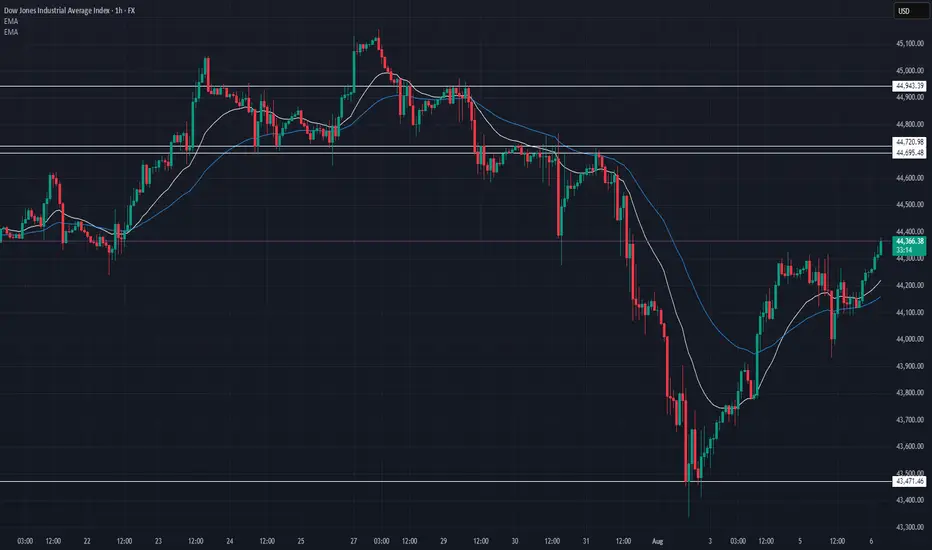
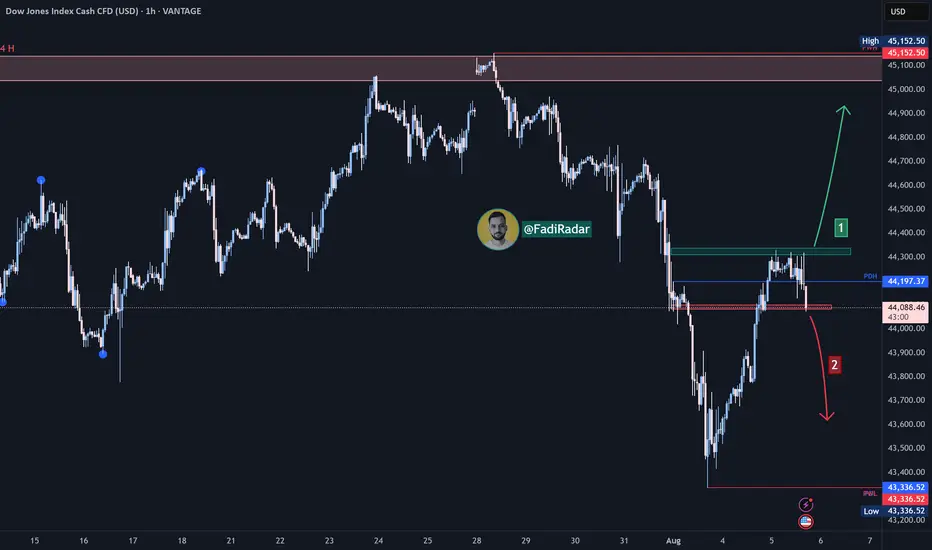
DowJones oversold bounce back supported at 44020Key Support and Resistance Levels
Resistance Level 1: 44708
Resistance Level 2: 44925
Resistance Level 3: 44128
Support Level 1: 44020
Support Level 2: 44760
Support Level 3: 43477
This communication is for informational purposes only and should not be viewed as any form of recommendation as to a particular course of action or as investment advice. It is not intended as an offer or solicitation for the purchase or sale of any financial instrument or as an official confirmation of any transaction. Opinions, estimates and assumptions expressed herein are made as of the date of this communication and are subject to change without notice. This communication has been prepared based upon information, including market prices, data and other information, believed to be reliable; however, Trade Nation does not warrant its completeness or accuracy. All market prices and market data contained in or attached to this communication are indicative and subject to change without notice.

Short Looking for major bearish momentum when market reaches 44,740 having multiple previous rejections at this level.

Dow Jones Index (US30 / Dow Jones) Analysis:The Dow Jones index opened the day with bullish momentum and is currently trading near 44,500.
🔻 Bearish Scenario:
If the price fails to break above 44,500 and selling pressure returns, a break below 44,200 could push the index back toward 44,000, which is a key support in the short term. A confirmed break below that level may open the way for a drop toward 43,700.
🔺 Bullish Scenario:
If the price breaks and holds above 44,500, which is the more likely scenario, we could see continued upside movement toward 44,700, followed by the strong resistance zone at 45,000.
⚠️ Disclaimer:
This analysis is not financial advice. It is recommended to monitor the markets and carefully analyze the data before making any investment decisions.
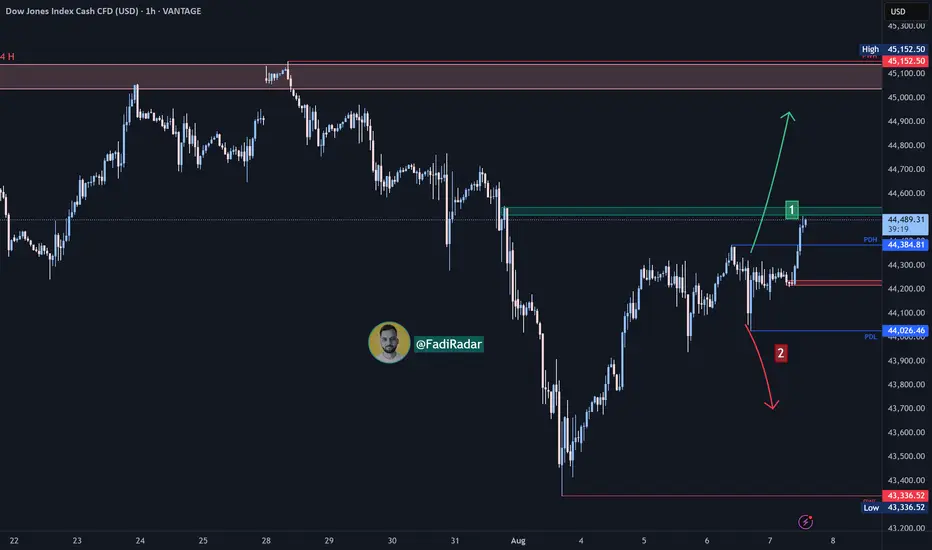
US30 Bullish Bias Builds on Fed and Earnings OptimismUS30 – Market Overview
The market is showing bullish momentum, supported by recent developments from the Federal Reserve and a strong corporate earnings season.
Technically, the price action suggests a continuation of the uptrend toward 44610.
🔻 However, bearish momentum may be triggered if the price breaks below 44170.
🔹 Resistance: 44360, 44610 – 44820
🔹 Support: 44170 – 43960 – 43630

DOW JONES INDEX (US30): Bear Trap & Bullish MovementWe see a clear example of a bear trap on 📈US30 on a 4H time frame
The market initially breached and closed below a crucial support level but then rebounded, and formed an ascending triangle.
A buy signal will be triggered by a bullish breakout above the pattern's neckline, leading us to expect further growth towards 44658.

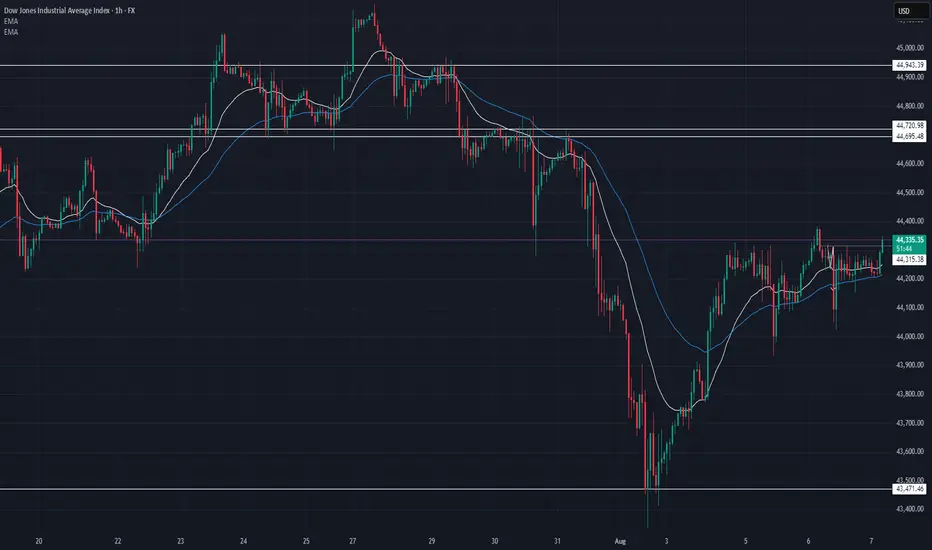
US30 Technical Breakdown – 08/07/2025📍 US30 Technical Breakdown – 08/07/2025
US30 is consolidating below 44,360, continuing to coil tightly after its bounce from 43,500. Bulls have defended the 44,150–44,200 support zone, but upside momentum is stalling ahead of the 44,600–44,720 resistance wall.
This tightening range signals that a breakout—or rejection—is imminent. Volume remains low, suggesting the market is waiting for a catalyst.
📊 Current Market Behavior:
🔄 Sideways chop between 44,200–44,360
📉 Lower volume, tightening price action
🧱 Bulls holding support but struggling to push higher
⚠️ Key resistance test likely in the next sessions
📌 Key Levels:
🔹 Resistance Zones:
44,360 → Immediate breakout pivot
44,600–44,720 → Major supply zone
44,943 → Swing high resistance
🔹 Support Zones:
44,200–44,150 → EMA & structure support
44,000 → Psychological round level
43,471 → Recent bottom
🧠 Bias:
🔄 Neutral Intraday
Range-bound with fading volatility. Watch for breakout above 44,360 or failure to hold 44,200.
4H Analysis of Dow Jones | Selling Pressure Below Key Resistance4H Analysis of Dow Jones
🔸 Price is currently trading below a key resistance level and has yet to break above it.
🔻 If weakness persists, a bearish reversal toward lower support levels is likely.
🔹 A confirmed breakout above the resistance could open the path for further upside.
✅ Price reaction to this resistance will determine the next market direction.
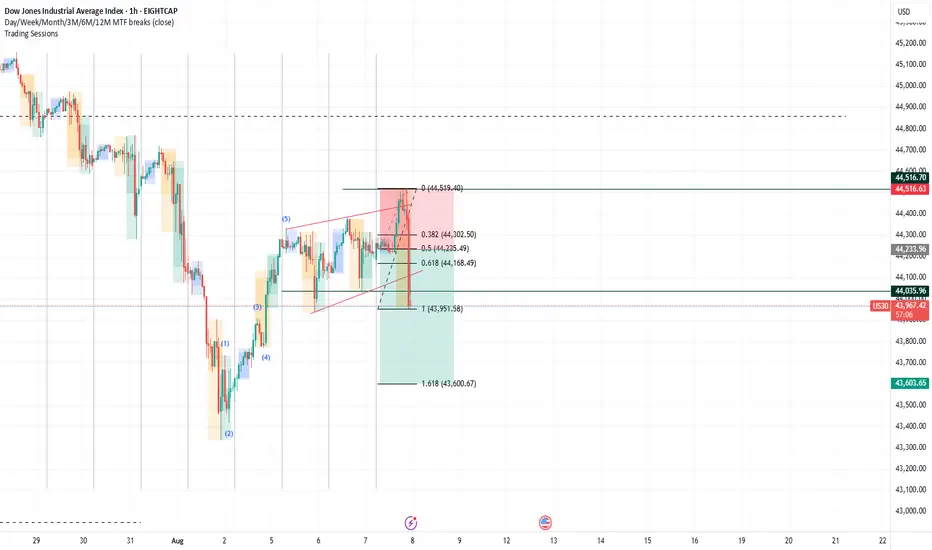
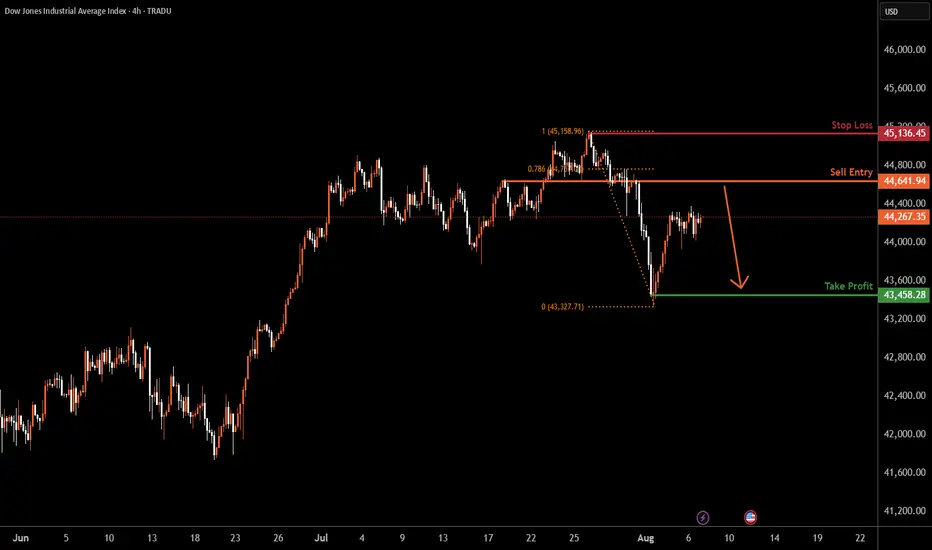
US30 H4 | Bearish reversalDow Jones (US30) is rising towards the sell entry which is an overlap resistance and could reverse to the downside.
Sell entry is at 44,641.94, which is an overlap resistance that is slightly below the 78.6% Fibonacci retracement.
Stop loss is at 45,136.45, which is a swing high resistance.
Take profit is at 43,458.28, which has been identified as a swing low support.
High Risk Investment Warning
Trading Forex/CFDs on margin carries a high level of risk and may not be suitable for all investors. Leverage can work against you.
Stratos Markets Limited (tradu.com ):
CFDs are complex instruments and come with a high risk of losing money rapidly due to leverage. 65% of retail investor accounts lose money when trading CFDs with this provider. You should consider whether you understand how CFDs work and whether you can afford to take the high risk of losing your money.
Stratos Europe Ltd (tradu.com ):
CFDs are complex instruments and come with a high risk of losing money rapidly due to leverage. 66% of retail investor accounts lose money when trading CFDs with this provider. You should consider whether you understand how CFDs work and whether you can afford to take the high risk of losing your money.
Stratos Global LLC (tradu.com ):
Losses can exceed deposits.
Please be advised that the information presented on TradingView is provided to Tradu (‘Company’, ‘we’) by a third-party provider (‘TFA Global Pte Ltd’). Please be reminded that you are solely responsible for the trading decisions on your account. There is a very high degree of risk involved in trading. Any information and/or content is intended entirely for research, educational and informational purposes only and does not constitute investment or consultation advice or investment strategy. The information is not tailored to the investment needs of any specific person and therefore does not involve a consideration of any of the investment objectives, financial situation or needs of any viewer that may receive it. Kindly also note that past performance is not a reliable indicator of future results. Actual results may differ materially from those anticipated in forward-looking or past performance statements. We assume no liability as to the accuracy or completeness of any of the information and/or content provided herein and the Company cannot be held responsible for any omission, mistake nor for any loss or damage including without limitation to any loss of profit which may arise from reliance on any information supplied by TFA Global Pte Ltd.
The speaker(s) is neither an employee, agent nor representative of Tradu and is therefore acting independently. The opinions given are their own, constitute general market commentary, and do not constitute the opinion or advice of Tradu or any form of personal or investment advice. Tradu neither endorses nor guarantees offerings of third-party speakers, nor is Tradu responsible for the content, veracity or opinions of third-party speakers, presenters or participants.
Us30S30 is currently respecting a key support zone, showing strong buyer interest. As long as this level holds, the bias remains bullish, with potential for price to push higher toward the next resistance levels.
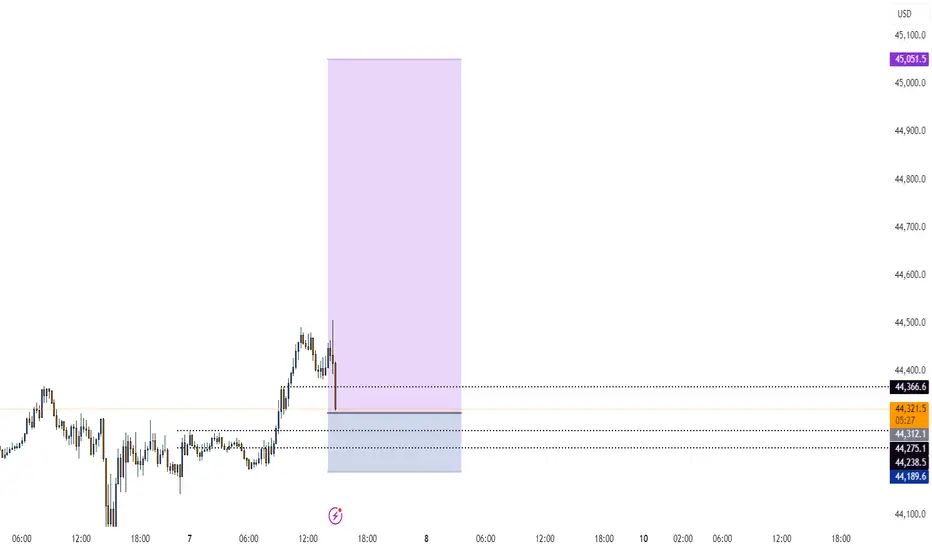
US30: Bulls Are Winning! Long!
My dear friends,
Today we will analyse US30 together☺️
The market is at an inflection zone and price has now reached an area around 44,197.65 where previous reversals or breakouts have occurred.And a price reaction that we are seeing on multiple timeframes here could signal the next move up so we can enter on confirmation, and target the next key level of 44,301.05.Stop-loss is recommended beyond the inflection zone.
❤️Sending you lots of Love and Hugs❤️

Dow Jones Index Analysis (US30 / Dow Jones):The Dow Jones index showed a slight improvement at today’s market open and is currently trading near 44,300 USD, attempting to break through a nearby resistance level.
🔻 Bearish Scenario:
If the price fails to break above 44,300 USD and selling pressure returns, a break below 44,000 USD could send the index back toward 43,350 USD, which is considered a critical support zone in the short term.
🔺 Bullish Scenario:
However, if the index breaks above 44,300 USD and holds — which is currently the more likely scenario — we may see continued bullish momentum toward 44,700 USD, followed by the key resistance at 45,000 USD.
⚠️ Disclaimer:
This analysis is not financial advice. It is recommended to monitor the markets and carefully analyze the data before making any investment decisions.

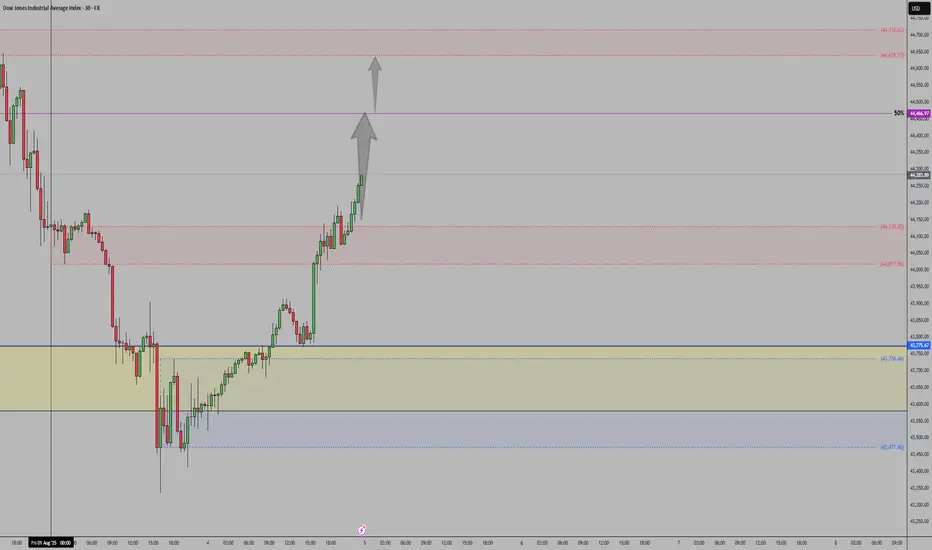
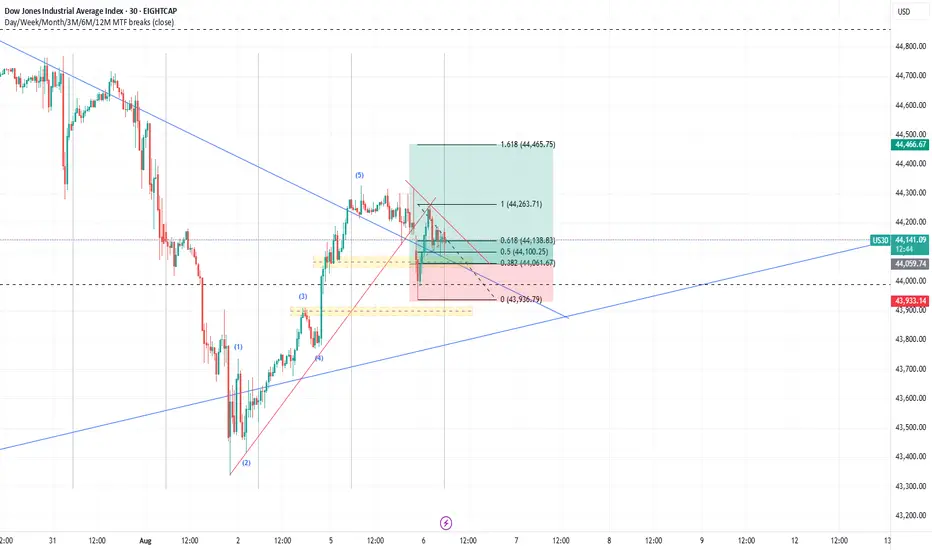
Uptrend It is expected that the resistance level will be broken and after consolidation above the resistance level, the uptrend will continue. Otherwise, a trend change and a continuation of the correction will be likely.
US30 Technical Breakdown – 08/06/2025📍 US30 Technical Breakdown – 08/06/2025
US30 continues its bullish recovery from the 43,500 lows and is now pressing into the 44,360 area. Price is printing higher highs and reclaiming key moving averages, building momentum ahead of the major 44,600–44,720 resistance zone.
A clean break above this range could open the door to 44,943+, while a failure may bring a pullback toward short-term support at 44,150–44,200.
📊 Current Market Behavior:
📈 Bullish momentum accelerating
📊 Price reclaiming structure above 44,300
🧱 Major test ahead at 44,600–44,720
⚠️ Overhead resistance – potential reversal zone
📌 Key Levels:
🔹 Resistance Zones:
44,380–44,400 → Immediate resistance (currently testing)
44,600–44,720 → Major breakout zone
44,943 → Last major high
🔹 Support Zones:
44,219–44,150 → EMA and structure support
44,000 → Psychological and structural support
43,471 → Recent swing low
🧠 Bias:
📈 Bullish Intraday
Momentum remains with buyers as long as price holds above 44,150. Key resistance test ahead.
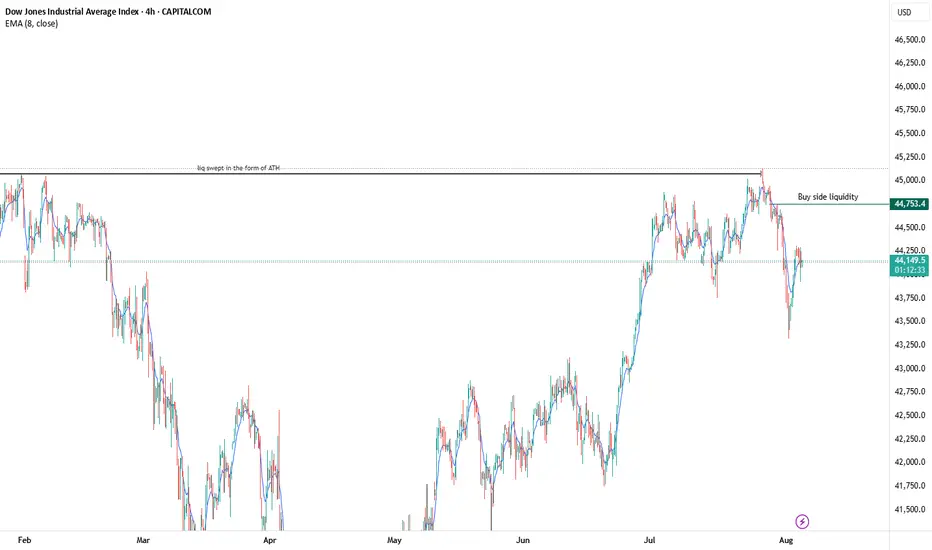
US30 Sell offmajor move to the downside coming up, once we get the buyside liquidity sweep ill be looking for a heavy short position. Liquidity has already been sept in the form of equal high at the area of all time high. the internal liquidity is what I'm looking for to get swept, then its all down hill from there. I will be holding this until it reaches a daily or monthly demand zone
Dow Jones Potential DownsidesHey Traders, in today's trading session we are monitoring US30 for a selling opportunity around 44,300 zone, Dow Jones is trading in a downtrend and currently is in a correction phase in which it is approaching the trend at 44,300 support and resistance area.
Trade safe, Joe.

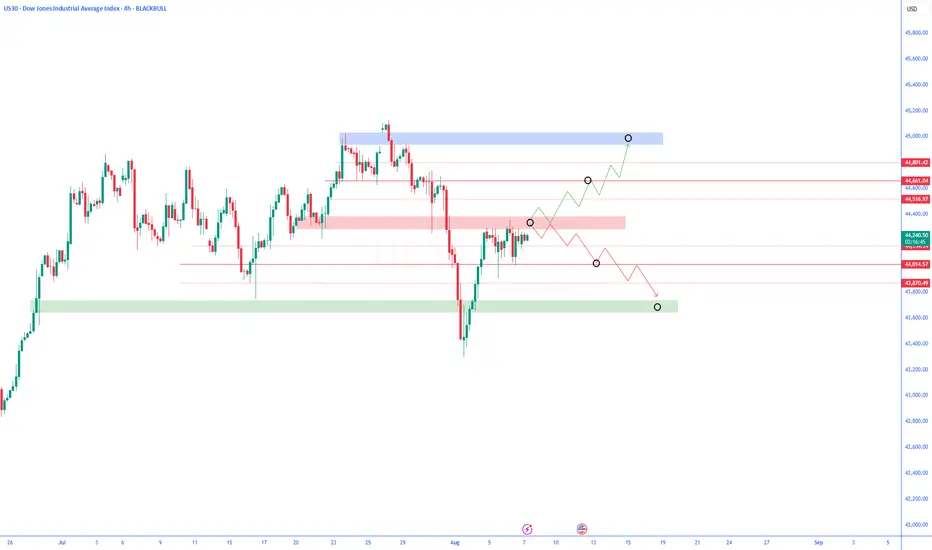
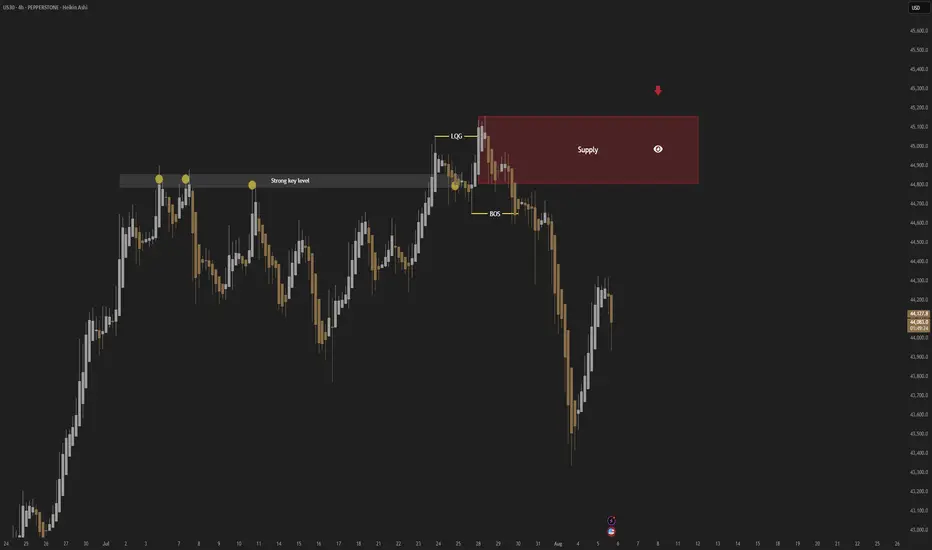
US30; Heikin Ashi Trade Idea📈 Hey Traders!
Here’s a fresh outlook from my trading desk. If you’ve been following me for a while, you already know my approach:
🧩 I trade Supply & Demand zones using Heikin Ashi chart on the 4H timeframe.
🧠 I keep it mechanical and clean — no messy charts, no guessing games.
❌ No trendlines, no fixed sessions, no patterns, no indicator overload.
❌ No overanalyzing market structure or imbalances.
❌ No scalping, and no need to be glued to the screen.
✅ I trade exclusively with limit orders, so it’s more of a set-and-forget style.
✅ This means more freedom, less screen time, and a focus on quality setups.
✅ Just a simplified, structured plan and a calm mindset.
💬 Let’s Talk:
💡Do you trade supply & demand too ?
💡What’s your go-to timeframe ?
💡Ever tried Heikin Ashi ?
📩 Got questions about my strategy or setup? Drop them below — ask me anything, I’m here to share.
Let’s grow together and keep it simple. 👊

Dow Jones Index (US30) Technical Analysis:The Dow Jones is currently trading near $44,100, after a strong bullish move that failed to break through the $44,300 resistance zone.
🔹 Bearish Scenario:
If the price breaks below $44,000 and holds, it may head toward the $43,350 support level.
🔹 Bullish Scenario:
If bullish momentum returns and the price breaks above $44,300, the next target may be around $45,100.
⚠️ Disclaimer:
This analysis is not financial advice. It is recommended to monitor the markets and carefully analyze the data before making any investment decisions.
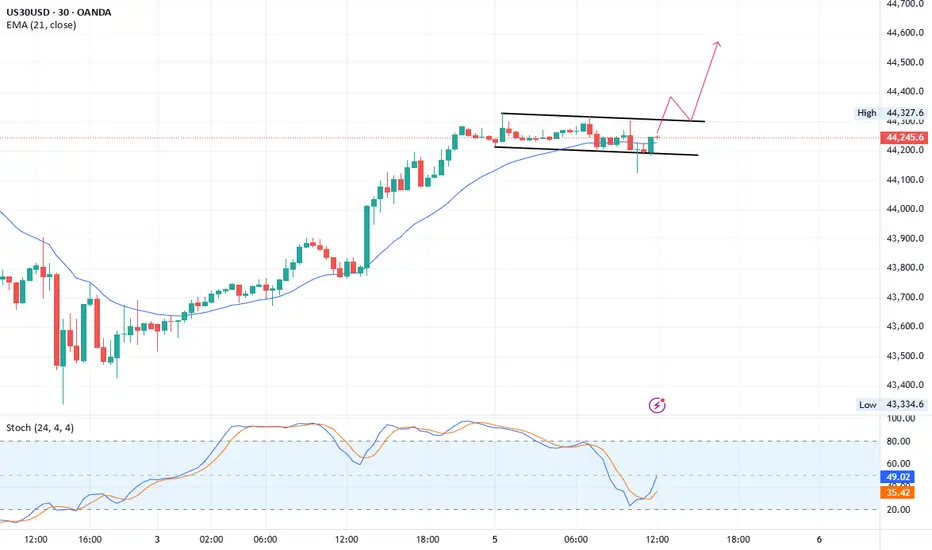
US30 Bullish flag patternUS30
M30 chart bullish flag pattern
Buy: current rate 44238
Stop Loss: 44125
1st TP: 44388
2nd TP: 44570