ADA - Time to buy again!The price can form a head and shoulders pattern. If that is happen, expect a significant price increase.
Trade ideas

ADAUSD testing pivotal resistance The ADAUSD pair continues to display a bearish outlook, in line with the prevailing downward trend. Recent price action suggests a corrective pullback, potentially setting up for another move lower if resistance holds.
Key Level: 4,590
This zone, previously a consolidation area, now acts as a significant resistance level.
A failed test and rejection at 4,590 would likely resume the bearish momentum.
Downside targets include:
3,580 – Initial support
3,160 – Intermediate support
2,830 – Longer-term support level
Bullish Scenario (breakout above 4,590):
A confirmed breakout and daily close above 4,590 would invalidate the bearish setup.
In that case, potential upside resistance levels are:
4,880 – First resistance
5,350 – Further upside target
Conclusion
ADAUSD remains under bearish pressure, with the 4,590 level acting as a key inflection point. As long as price remains below this level, the bias favours further downside. Traders should watch for price confirmation around that level to assess the next move.
This communication is for informational purposes only and should not be viewed as any form of recommendation as to a particular course of action or as investment advice. It is not intended as an offer or solicitation for the purchase or sale of any financial instrument or as an official confirmation of any transaction. Opinions, estimates and assumptions expressed herein are made as of the date of this communication and are subject to change without notice. This communication has been prepared based upon information, including market prices, data and other information, believed to be reliable; however, Trade Nation does not warrant its completeness or accuracy. All market prices and market data contained in or attached to this communication are indicative and subject to change without notice.

ADAUSD1. Strong Academic and Peer-Reviewed Approach
Cardano is known for being one of the few blockchains built with:
Formal methods
Peer-reviewed research
A structured, scientific development process
This appeals to investors who want long-term, systematic innovation rather than fast but risky changes.
The reasoning above is just BS. This idea is a strong buy prior to bullish condition, liquidity and price action. A bit of Wyck off as well. Potential target price to 1 dollar due to liquidity and trade idea is invalid when price breaks from spring.

What I think is going on with Cardano right nowThis is my personal opinion and update regarding Cardano. It is not a financial advice.

CARDANO (ADAUSD): Bullish Reversal Confirmed?!
There are multiple bullish clues on ADA on a daily time frame
that make me think that the market is ready for a reversal.
First, the price formed a high momentum bullish candle.
Then, the market violated a resistance line of a falling
wedge pattern.
A change of character occurred afterward.
The market has a great potential to rise more
and reach 0.474 resistance soon.
❤️Please, support my work with like, thank you!❤️
I am part of Trade Nation's Influencer program and receive a monthly fee for using their TradingView charts in my analysis.

ADAUSD Bearish sideways consolidation capped at 4,590The ADAUSD pair continues to display a bearish outlook, in line with the prevailing downward trend. Recent price action suggests a corrective pullback, potentially setting up for another move lower if resistance holds.
Key Level: 4,590
This zone, previously a consolidation area, now acts as a significant resistance level.
A failed test and rejection at 4,590 would likely resume the bearish momentum.
Downside targets include:
3,580 – Initial support
3,160 – Intermediate support
2,830 – Longer-term support level
Bullish Scenario (breakout above 4,590):
A confirmed breakout and daily close above 4,590 would invalidate the bearish setup.
In that case, potential upside resistance levels are:
4,880 – First resistance
5,350 – Further upside target
Conclusion
ADAUSD remains under bearish pressure, with the 4,590 level acting as a key inflection point. As long as price remains below this level, the bias favours further downside. Traders should watch for price confirmation around that level to assess the next move.
This communication is for informational purposes only and should not be viewed as any form of recommendation as to a particular course of action or as investment advice. It is not intended as an offer or solicitation for the purchase or sale of any financial instrument or as an official confirmation of any transaction. Opinions, estimates and assumptions expressed herein are made as of the date of this communication and are subject to change without notice. This communication has been prepared based upon information, including market prices, data and other information, believed to be reliable; however, Trade Nation does not warrant its completeness or accuracy. All market prices and market data contained in or attached to this communication are indicative and subject to change without notice.

ADAUSD downtrend continuation below pivotal 4,590The ADAUSD pair continues to display a bearish outlook, in line with the prevailing downward trend. Recent price action suggests a corrective pullback, potentially setting up for another move lower if resistance holds.
Key Level: 4,590
This zone, previously a consolidation area, now acts as a significant resistance level.
A failed test and rejection at 4,590 would likely resume the bearish momentum.
Downside targets include:
3,580 – Initial support
3,160 – Intermediate support
2,830 – Longer-term support level
Bullish Scenario (breakout above 4,590):
A confirmed breakout and daily close above 4,590 would invalidate the bearish setup.
In that case, potential upside resistance levels are:
4,880 – First resistance
5,350 – Further upside target
Conclusion
ADAUSD remains under bearish pressure, with the 4,590 level acting as a key inflection point. As long as price remains below this level, the bias favours further downside. Traders should watch for price confirmation around that level to assess the next move.
This communication is for informational purposes only and should not be viewed as any form of recommendation as to a particular course of action or as investment advice. It is not intended as an offer or solicitation for the purchase or sale of any financial instrument or as an official confirmation of any transaction. Opinions, estimates and assumptions expressed herein are made as of the date of this communication and are subject to change without notice. This communication has been prepared based upon information, including market prices, data and other information, believed to be reliable; however, Trade Nation does not warrant its completeness or accuracy. All market prices and market data contained in or attached to this communication are indicative and subject to change without notice.

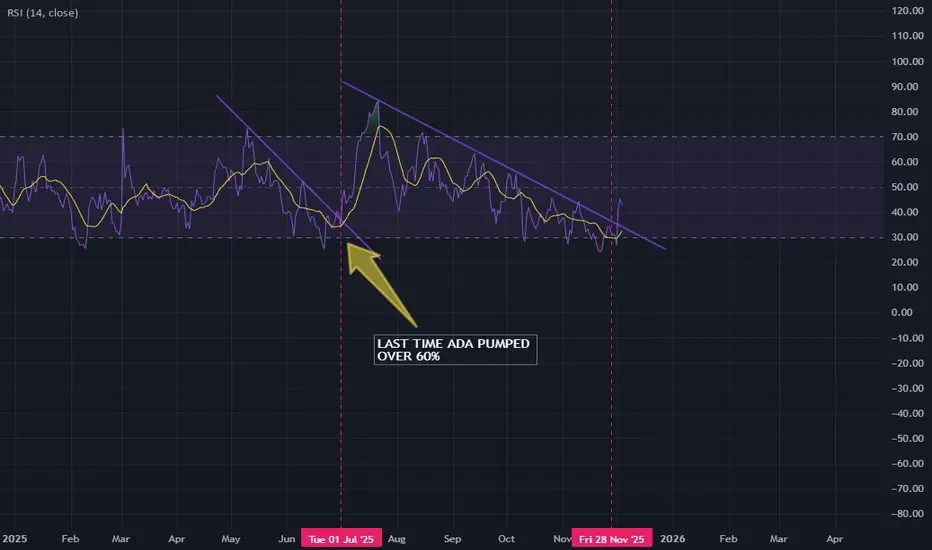
RSI BREAKOUT ON ONE DAY CHARTLast time RSI had a trend line break up on the one day.
ADA pumped over 60%
ADA - 15min candles to the end of NovT.A explained -
BackSide (BS)
FrontSide (FS)
Inverse BS (Inv.BS)
Inverse FS (Inv.FS)
BS & FS levels are expected support when dashed lines, tested when dotted and resistance when solid lines.
The inverse is true for the Inv. BS Inv. FS levels, they are resistance as dashed lines, tested as dotted and support as solid lines.
Monthly timeframe is color pink
weekly grey
daily is red
4hr is orange
1hr is yellow
15min is blue
5min is green if they are shown.
strength favors the higher timeframe.
2x dotted levels are origin levels where trends have or will originate. When trends break, price will target the origin of the trend. its math, when the trend breaks, the vertex breaks too so the higher timeframe level/trend that breaks, the more volatility there could be as strength in the orders flow in to fuel the move.

ADA – Downtrend Dominates, Risk of Deeper PullbackHello everyone,
On the chart, the downtrend remains clearly intact, with a persistent sequence of lower highs and lower lows extending from October to the present. Price is trading entirely below EMA34 and EMA89, both of which are sharply sloping downward. This confirms that sellers continue to control the market, with no meaningful signs of exhaustion so far.
Throughout November and December, all rebound attempts have been weak, short-lived, and repeatedly rejected around the EMA34 near the 0.45 USD area. This behavior suggests that buying pressure is purely technical in nature and insufficient to form a reversal structure. At the moment, ADA is hovering around the nearby support zone of 0.37–0.39 USD. However, the current D1 candle structure — small bodies, short lower wicks, and declining volume — indicates fading momentum, a pattern that often precedes a breakdown of support.
From an EMA perspective, the widening gap between price and EMA34 (0.452) as well as EMA89 (0.560) further confirms that the downtrend is expanding rather than contracting. To shift the market’s bias, ADA would need at least a daily close above 0.45 USD. At this stage, there are no early signals supporting such a scenario. Volume has continued to dry up over recent weeks and is concentrated mainly on bearish candles, implying a lack of fresh inflows, while sellers still require relatively little pressure to push prices lower.
Based on the current technical picture, the highest-probability scenario remains a breakdown below the 0.37–0.38 support zone, followed by an extension of the decline toward deeper support around 0.30–0.33 USD. This area represents a significant liquidity zone that previously acted as a major support, where price could eventually see a technical bounce or begin forming a new accumulation base. Until ADA approaches that region, there is still insufficient evidence to expect a genuine trend reversal.
Wishing you all a successful trading day!

ADA Reclaims Support – Will Bulls Defend This Zone?Trend Check:
ADA broke structure to the upside recently with a bullish MSB and is now trading just above a reclaimed demand zone. Price action remains steady near the $0.40–$0.42 support.
Indicators:
RSI: 50 (neutral to slight bullish bias)
MACD: Flat and neutral, signaling potential pause or upcoming move
Structure:
ADA is trying to build a base after a long downtrend. The bullish MSB and retest of demand suggest a potential reversal, but it needs follow-through.
Position: Long bias
Entry Idea: Long above $0.42
Stop: Below $0.39
Targets: $0.46 → $0.51
Reasoning:
Demand is holding after MSB. If bulls reclaim momentum, ADA could push into the mid-$0.40s quickly.


ADAUSD trend continuation key level at 4,590The ADAUSD pair continues to display a bearish outlook, in line with the prevailing downward trend. Recent price action suggests a corrective pullback, potentially setting up for another move lower if resistance holds.
Key Level: 4,590
This zone, previously a consolidation area, now acts as a significant resistance level.
A failed test and rejection at 4,590 would likely resume the bearish momentum.
Downside targets include:
3,580 – Initial support
3,160 – Intermediate support
2,830 – Longer-term support level
Bullish Scenario (breakout above 4,590):
A confirmed breakout and daily close above 4,590 would invalidate the bearish setup.
In that case, potential upside resistance levels are:
4,880 – First resistance
5,350 – Further upside target
Conclusion
ADAUSD remains under bearish pressure, with the 4,590 level acting as a key inflection point. As long as price remains below this level, the bias favours further downside. Traders should watch for price confirmation around that level to assess the next move.
This communication is for informational purposes only and should not be viewed as any form of recommendation as to a particular course of action or as investment advice. It is not intended as an offer or solicitation for the purchase or sale of any financial instrument or as an official confirmation of any transaction. Opinions, estimates and assumptions expressed herein are made as of the date of this communication and are subject to change without notice. This communication has been prepared based upon information, including market prices, data and other information, believed to be reliable; however, Trade Nation does not warrant its completeness or accuracy. All market prices and market data contained in or attached to this communication are indicative and subject to change without notice.

ADAUSD bearish sideways consolidation capped at 4,590The ADAUSD pair continues to display a bearish outlook, in line with the prevailing downward trend. Recent price action suggests a corrective pullback, potentially setting up for another move lower if resistance holds.
Key Level: 4,590
This zone, previously a consolidation area, now acts as a significant resistance level.
A failed test and rejection at 4,590 would likely resume the bearish momentum.
Downside targets include:
3,580 – Initial support
3,160 – Intermediate support
2,830 – Longer-term support level
Bullish Scenario (breakout above 4,590):
A confirmed breakout and daily close above 4,590 would invalidate the bearish setup.
In that case, potential upside resistance levels are:
4,880 – First resistance
5,350 – Further upside target
Conclusion
ADAUSD remains under bearish pressure, with the 4,590 level acting as a key inflection point. As long as price remains below this level, the bias favours further downside. Traders should watch for price confirmation around that level to assess the next move.
This communication is for informational purposes only and should not be viewed as any form of recommendation as to a particular course of action or as investment advice. It is not intended as an offer or solicitation for the purchase or sale of any financial instrument or as an official confirmation of any transaction. Opinions, estimates and assumptions expressed herein are made as of the date of this communication and are subject to change without notice. This communication has been prepared based upon information, including market prices, data and other information, believed to be reliable; however, Trade Nation does not warrant its completeness or accuracy. All market prices and market data contained in or attached to this communication are indicative and subject to change without notice.

CARDANO Can it make a strong Bear Cycle rally?Cardano (ADAUSD) has been trading within a Channel Down since its December 02 2024 weekly top and undeniably has (long) started its new Bear Cycle.
This Channel Down has however bottomed (Lower Low) and with the 1W RSI hitting also its 3 year Support (essentially the Support of the whole Bull Cycle), it is possible to give us a strong Bear Cycle rally.
This rally would technically be the pattern's new Bullish Leg with the previous two both peaking on the 0.8 Fibonacci level. This time however, ADA is trading below its 1W MA50 (blue trend-line) and during Bear Cycle's, that is the trend's main Resistance.
As a result, we believe the rebound is limited at a maximum price of $0.6500.
---
** Please LIKE 👍, FOLLOW ✅, SHARE 🙌 and COMMENT ✍ if you enjoy this idea! Also share your ideas and charts in the comments section below! This is best way to keep it relevant, support us, keep the content here free and allow the idea to reach as many people as possible. **
---
💸💸💸💸💸💸
👇 👇 👇 👇 👇 👇

ADAUSD downtrend continuation below 4,590 resistanceThe ADAUSD pair continues to display a bearish outlook, in line with the prevailing downward trend. Recent price action suggests a corrective pullback, potentially setting up for another move lower if resistance holds.
Key Level: 4,590
This zone, previously a consolidation area, now acts as a significant resistance level.
A failed test and rejection at 4,590 would likely resume the bearish momentum.
Downside targets include:
3,580 – Initial support
3,160 – Intermediate support
2,830 – Longer-term support level
Bullish Scenario (breakout above 4,590):
A confirmed breakout and daily close above 4,590 would invalidate the bearish setup.
In that case, potential upside resistance levels are:
4,880 – First resistance
5,350 – Further upside target
Conclusion
ADAUSD remains under bearish pressure, with the 4,590 level acting as a key inflection point. As long as price remains below this level, the bias favours further downside. Traders should watch for price confirmation around that level to assess the next move.
This communication is for informational purposes only and should not be viewed as any form of recommendation as to a particular course of action or as investment advice. It is not intended as an offer or solicitation for the purchase or sale of any financial instrument or as an official confirmation of any transaction. Opinions, estimates and assumptions expressed herein are made as of the date of this communication and are subject to change without notice. This communication has been prepared based upon information, including market prices, data and other information, believed to be reliable; however, Trade Nation does not warrant its completeness or accuracy. All market prices and market data contained in or attached to this communication are indicative and subject to change without notice.

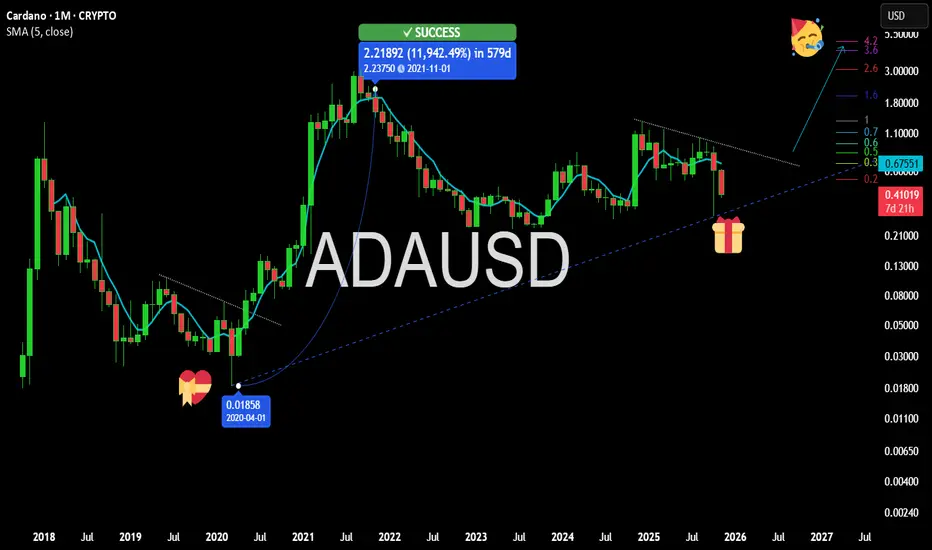
CARDANO $0.40 waiting to revisit that Gift Line it is the most rewarding among all alt coins
as it held and still has the strongest army community
with charles actively on the move
price limits of tokens are relative
the elasticity of thihs one rewarded 100x++ this cycle since COVID reset
only few can appreciate
that cardano is the best perfomring in every cycle
and this pullback is a blessing for those who missed the big run up
NFA not financial advice guys
please like share and subscribe
Clear Bounds BrokeThe .45-.52 cent region will now become resistance. Expect a bounce but return down to .25cent. Maybe .15 thereafter


ADAUSD downtrend continuation below 4,590 resistanceThe ADAUSD pair continues to display a bearish outlook, in line with the prevailing downward trend. Recent price action suggests a corrective pullback, potentially setting up for another move lower if resistance holds.
Key Level: 4,590
This zone, previously a consolidation area, now acts as a significant resistance level.
A failed test and rejection at 4,590 would likely resume the bearish momentum.
Downside targets include:
3,580 – Initial support
3,160 – Intermediate support
2,830 – Longer-term support level
Bullish Scenario (breakout above 4,590):
A confirmed breakout and daily close above 4,590 would invalidate the bearish setup.
In that case, potential upside resistance levels are:
4,880 – First resistance
5,350 – Further upside target
Conclusion
ADAUSD remains under bearish pressure, with the 4,590 level acting as a key inflection point. As long as price remains below this level, the bias favours further downside. Traders should watch for price confirmation around that level to assess the next move.
This communication is for informational purposes only and should not be viewed as any form of recommendation as to a particular course of action or as investment advice. It is not intended as an offer or solicitation for the purchase or sale of any financial instrument or as an official confirmation of any transaction. Opinions, estimates and assumptions expressed herein are made as of the date of this communication and are subject to change without notice. This communication has been prepared based upon information, including market prices, data and other information, believed to be reliable; however, Trade Nation does not warrant its completeness or accuracy. All market prices and market data contained in or attached to this communication are indicative and subject to change without notice.

My only remaining hope for CARDANO !!! if you pay attention to the ADA chart you can see that the price has formed a Ascending FLAG which means it is expected to price move as equal as the measured price movement.( AB=CD )
NOTE: wait for break of the FLAG .

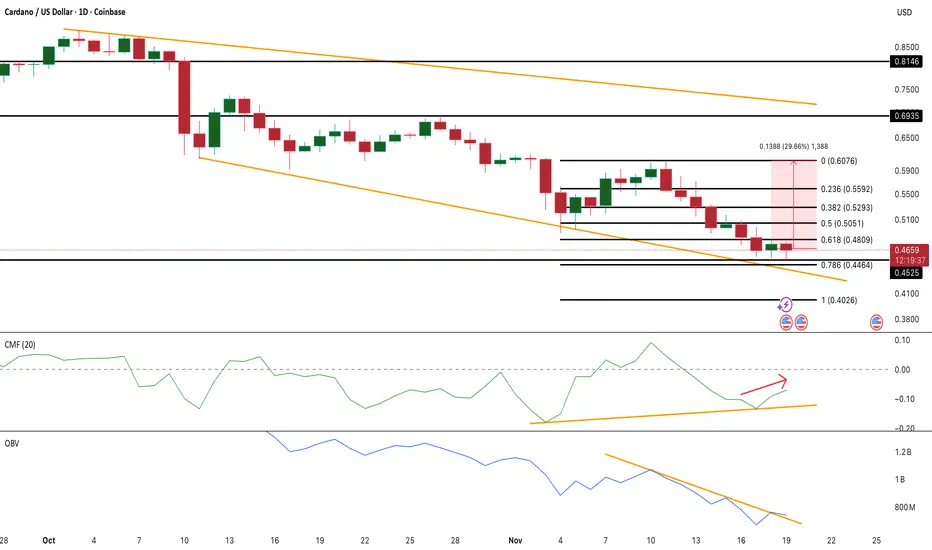
Cardano Price Faces a Decisive Test at $0.45COINBASE:ADAUSD is down nearly 30% this month and is testing the $0.45–$0.44 support, which is also the lower boundary of its falling wedge. Buyers need to defend this zone or ADA risks slipping toward $0.40.
Two indicators are starting to show early strength. The Chaikin Money Flow has turned up after forming a higher high between November 16 and 19, even while price made a lower high. That positive divergence signals stronger inflows. On-Balance Volume has also pushed above its descending trend line for the first time in weeks, showing buyers are beginning to step in at this support.
If COINBASE:ADAUSD holds $0.45, the first hurdle sits at $0.50–$0.52. A move above $0.60 is needed to flip momentum and target $0.69.
Spent Coins Age Band also shows conviction: token movement has dropped about 27% since November 1, despite falling prices, suggesting long-term holders are staying put.
Cardano - This coin is holding strong!🔋Cardano ( CRYPTO:ADAUSD ) still remains bullish:
🔎Analysis summary:
Despite this month's massive crypto crackdown, Cardano already recovered about +100%. We simply saw a perfect rejection of a major confluence of support, pushing price higher. Soon, Cardano will break out of the triangle and a bullish breakout remains rather likely.
📝Levels to watch:
$0.8
SwingTraderPhil
SwingTrading.Simplified. | Investing.Simplified. | #LONGTERMVISION
