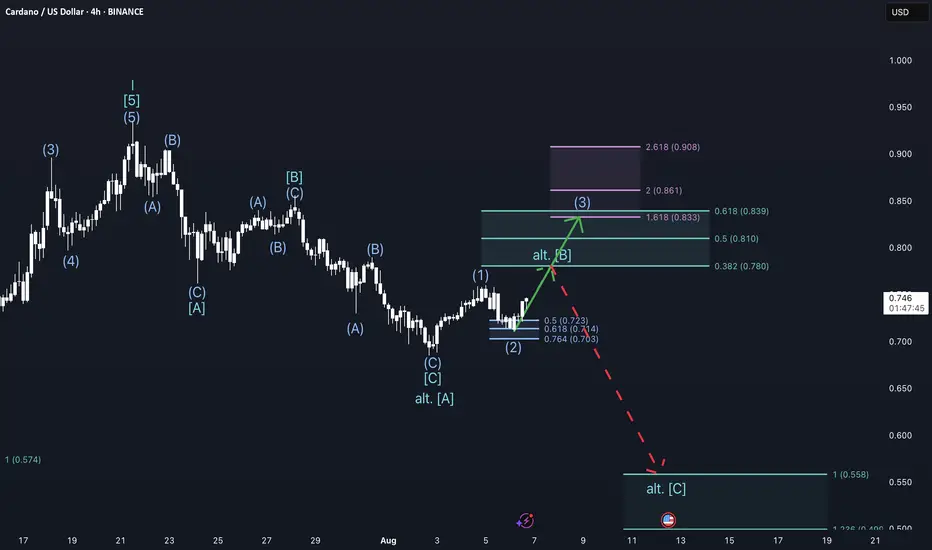
We are moving - Cardano weekly update August 6 - 12thCardano appears to have completed a clean Wave 2 correction and is now forming the first 1-2 setup within a larger impulsive move to the upside. From an Elliott Wave perspective, this suggests we are at the very beginning of a broader bullish development. Structurally, the chart aligns across multiple degrees of trend: we are currently within Cycle Wave 3, Primary Wave 1, and Intermediate Wave 3 — a highly favourable configuration for strong upside momentum.
The recent retracement reached the 0.5 Fibonacci level, where price reacted strongly and formed a well-defined bullish order block. This confluence between Fibonacci support and structural demand reinforces the idea that the local bottom is likely in place. The move off the lows also began with a clear five-wave advance, indicating that an impulsive structure is developing.
While an alternative scenario is shown on the chart — suggesting a possible deeper correction — this is considered low probability. The main reason this alternative exists is the relatively short time duration of the Wave 2 correction, which might appear shallow compared to expectations. However, given the structural symmetry, the clear order block, and the impulsive reaction from support, the primary bullish scenario remains heavily favoured.
Additional confluence comes from sentiment and derivatives data. Funding rates are still in negative territory but are turning upward, signalling a potential shift in market positioning toward longs. At the same time, open interest is increasing — an encouraging sign of growing participation and conviction in the current move.
The liquidity heatmap currently shows significant clusters both above and below the current price, making the liquidity picture overall neutral. However, this also implies potential for strong directional movement should one side be taken out decisively. Overall, the technical and sentiment-based evidence points to a structurally sound bullish setup with limited downside risk, so long as the current low remains protected.
Market insights
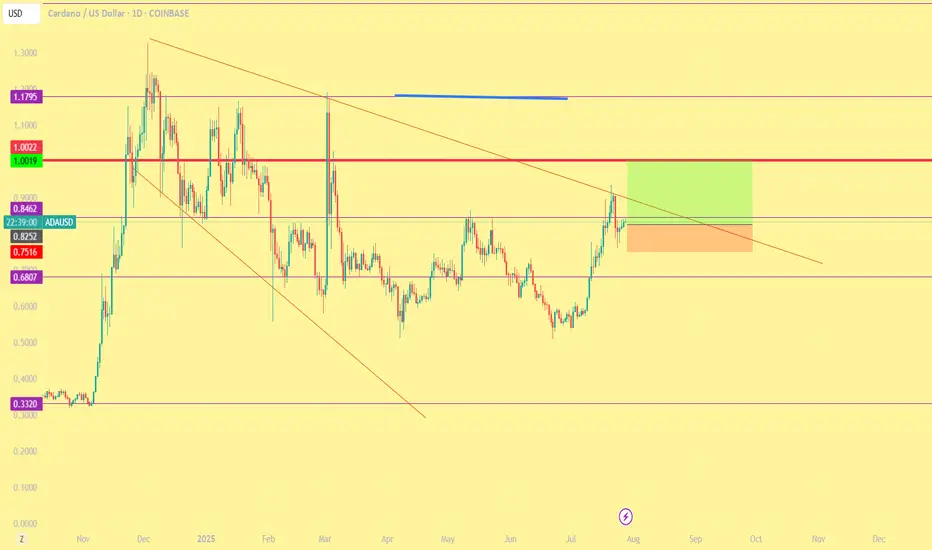
ADA/USD – Blocked by the BridgeCardano pushed into local resistance at 0.7300–0.7350, which previously acted as key support and now flips to potential rejection. The price remains below the 200 SMA, putting it under bearish pressure despite the latest rally. RSI sits above 56, indicating bullish momentum—but without a structural reclaim above 0.7350, continuation is uncertain. This is a classic range rejection setup unless bulls break and close above that key level.
🟢 LONG bias only above 0.7350 – reclaim the range.
🔴 Otherwise, watch for bearish rejection and lower support at 0.7160.
📊 Keywords: #CryptoTrading #ADAUSD #SmartMoneyZones #RSISetup #ChartBreakdown #ReclaimOrReject

$ADA weekly chart UpdateOver the past week the market remains volatile as it seeks clarity.
Top ten and others are range bound however CRYPTOCAP:ADA has completed a very nice breakout and retest of the descending triangle pattern started in DEC 2024 and holds support at .702 above the 50 Week MA and Bull market support bands.
CRYPTOCAP:ADA has recently performed a golden cross and the 100 week MA @ .578 is also set to cross the 200 week MA @.616
Developments are ongoing to the chain:
-Glacier drop details to be release in Aug. using Zero knowledge proof (ZKP) midnight achieves much needed blockchain privacy and interoperability with multiple chains creating a hub effect favouring Cardano.
-70M from Cardano treasury allocated to IOG in order to polish various developments which will continue to push Cardano to the leading edge of the Crypto space.
-Polymarket predicts 83% chance of Cardano ETF approval in 2025.
-BTC OS and ZKP link CRYPTOCAP:BTC and CRYPTOCAP:ADA ecosystems with safest non bridge method to move CRYPTOCAP:BTC into a multichain environment which massively supports CRYPTOCAP:ADA
-73,000,000. dollars of institutional inflows ranking CRYPTOCAP:ADA as the sixth largest attractor of institutional funding.
-Strong community support and conviction
There is a bearish case which would call for the cancellation of the altcoin season and would mean Santa also doesn't come this year. I assess this as due to the continued dominance of CRYPTOCAP:BTC forcing alt season hopes to stay rangebound for extended periods as crypto is adopted into the financial systems.
however part of my thesis includes being contrarian, to a degree. The crypto market is clearly manipulated and I watch for the weaponization of FUD , as recently experienced over the last week with political tension and tariff's causing mass liquidations. these FEAR spikes are TO ME indicators of deliberate attempts to shake out any retail interests.
Conclusion, I remain bullish, i repeat, I remain bullish. you don't have to and I encourage everyone to create their own thesis from all the available contributors ideas. I remain bullish as all the data I see is still in line with the upward trend. and remember NOBODY "KNOWS" what's coming so...
IF YOU SAY YOU NEVER HAD A CHANCE YOU NEVER TOOK A CHANCE.
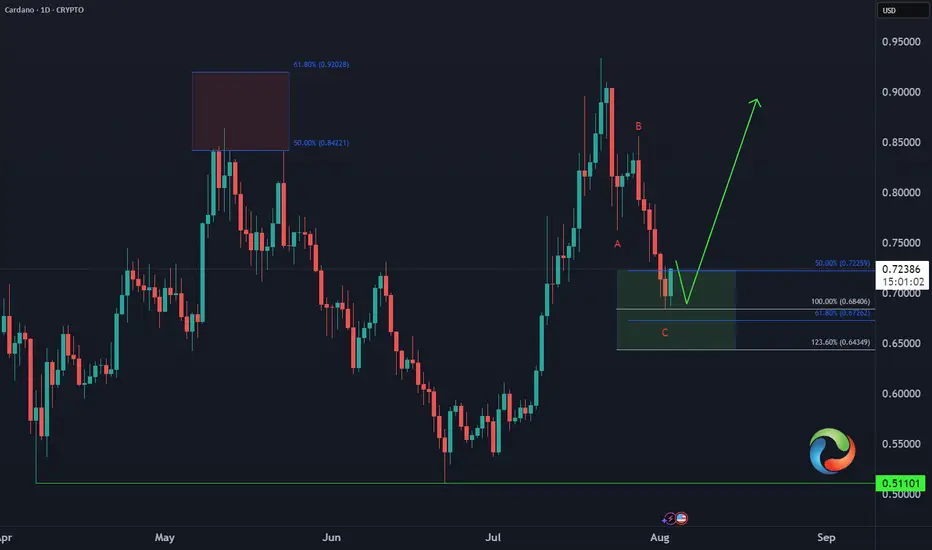
Cardano ADA Buying Opportunity📈 CRYPTO:ADAUSD has completed a 3-swing pullback against the June low and entered the extreme buy zone at $0.72–$0.64. While marginal new lows are still possible, this area aligns with Fibonacci confluence, making it a prime zone for a bullish reversal or at least a 3-wave bounce next week.
Panic sets in. but its all goodThe crypto market has experienced a strong panic driven correction as the FED refuses to cut rates and inflation is on the rise while wages are slowly in decline.
CRYPTOCAP:ADA continues to provide thrills and chills
Is it time to dump? and cry into your empty wallet?
IMO NO, CRYPTOCAP:BTC has recently taken out liquidity below the $117,000.00 price point which is a normal move, if you are over leveraged it can feel horrible but I assess as a normal correction.
CRYPTOCAP:ADA price remains in the range in which it has formed .93 - .71 the possibility that CRYPTOCAP:ADA can dip deeper to .65 is possible but unlikely. This correction provides a cooling off of MACD and RSI on higher timeframes and the chart still remains BULLISH.
Remember be greedy when others are fearful.
A man who says he never had a chance never took a chance!
ADA 4H – 67% MACD Long Captured, But Is Trend Breaking?ADA just printed a textbook 67.03% move using the MACD Liquidity Tracker Strategy (Normal Mode). The system triggered long on bullish MACD crossover confluence with the 60/220 EMA trend filter — signaling the first real momentum shift after weeks of sideways action.
Price rallied from ~$0.56 to over $0.93, with the strategy holding the entire trend thanks to its filter logic: no early exits, no noise, just directional conviction. The exit fired only after MACD flipped bearish and price fell back below the trend EMAs.
Now, we’re watching the $0.72–$0.74 zone — a key support structure from early July. Momentum is weakening, pink candles are printing, and if bulls can’t reclaim the EMAs soon, a deeper pullback toward $0.68–$0.70 is likely.
📊 Backtest Snapshot:
– MACD: 25 / 60 / 220
– Trend Filter: 60 EMA + 220 EMA
– Strategy Mode: Normal
– Timeframe: 4H


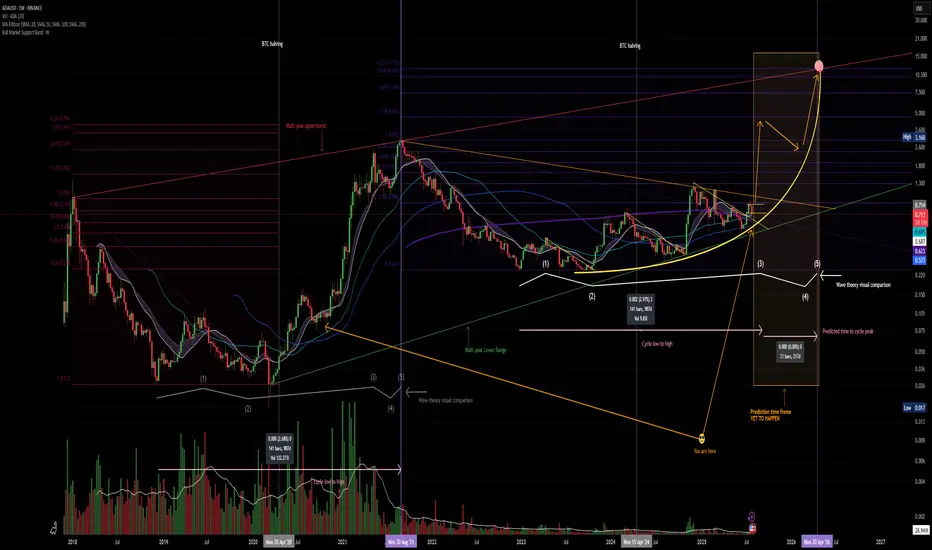
$ADA Macro ThesisGD To all
I have cleaned up and thrown a few other correlated patterns on the Chart for my Macro thesis.
You will have to watch the metrics and on chain data as well as sentiment to verify as we move fwd.
This is Pattern recognition on a Log Chart:
BINANCE:ADAUSD
I have been using this thesis since 2019 and have been able to successfully ident general buy/sell points ( weighing against real world events and on chain data )
I hope it helps you and feel free to ask questions.
Told ya I like crayons

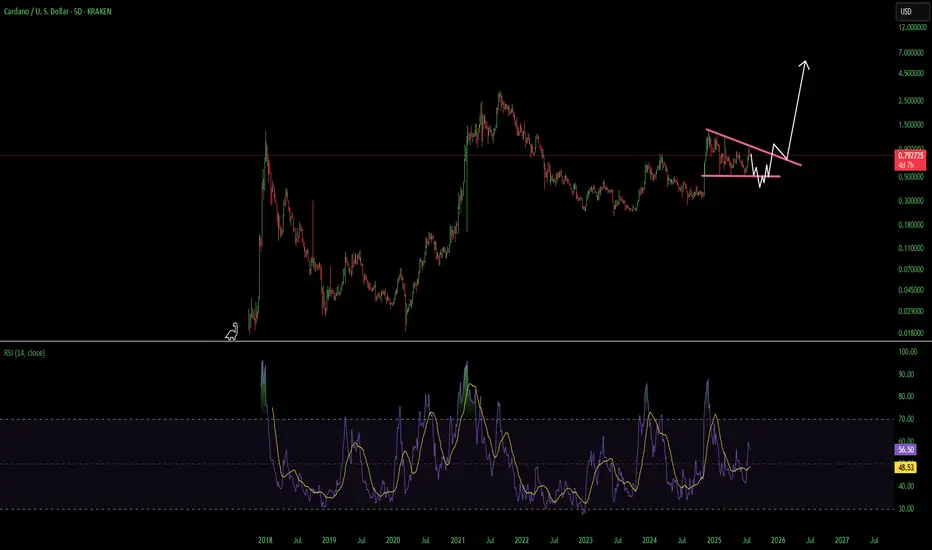
$ADA about to popCRYPTOCAP:ADA currently sits at strong support. and is technically repeating the exact pattern from previous Bull Runs, this does not guarantee repetition but I extrapolate the phrase, the trend is your friend and feel it applies macro scale.
ETF soon
Crypto laws passed
Leios inbound
Glacier drop inbound
CRYPTOCAP:BTC DEFi Inbound
Interoperability expanding
QE inbound
And CRYPTOCAP:ADA IMO is one of the easiest UI and is also among the most cost effective Blockchains to use on a daily basis.
This Chart is a thesis and I like Crayons.

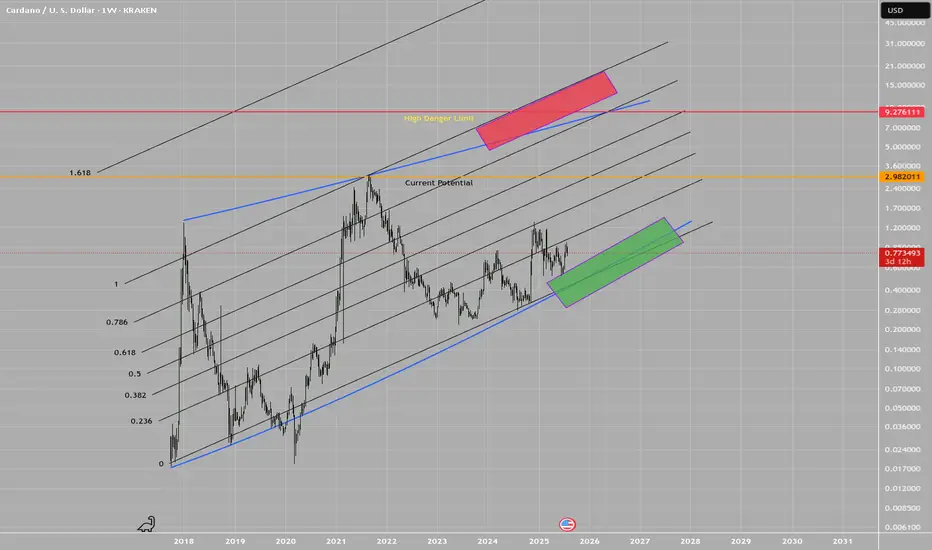
ADA, long term dubious speculationWARNING: This idea is highly dubious!
This is a logarithmic estimate of potential targets, in case Cardano moves in long logarithmic measures.
The real potential of this idea is strongly linked to the fundamentals evolution on time, i.e.: FED reducing the interest rate, for instance, but not only.
The plot features top and bottom limits drown by hand!, these are not perfect logarithmic measures, thus they certainly lacks of math accuracy. Beware.
There are zones in red and green, as transparent boxes, which depicts potential zones of buy and sell interest, of course, everything is in a log scale.
Everyone wish these kind of scenarios to be true. Only time and reality will show us the true face of it. In any case, in the total chaos of uncertainty that this market is, we try to make a sense of it.
Best of the lucks for everyone.
T.
DISCLAIMER: Do your own research! This idea is not a financial advice. All the information presented is highly speculative and cannot be taken as a reference in any circumstance.
Short Breakdown of Cardano (ADAUSDT) weekly/daily technicalsLooked over this for a friend. Rowland I would love your feedback in the comments 🫡
I will see my biggest expectation is for this to make it's way into the weekly imbalance range below the weekly Mother Candle we are existing within. The entire crypto market seems to want to revisit some key lows to correct some inefficiently delivered rally ranges (meaning too many pending orders left behind due to price not coming back to grab them, happens when HUGE money places--attempts to place/fill--bulk orders).
We are getting what I think is a temporary bullish correction due to taking of profits at key lows. It is my belief/observation that after correcting the newly minted bearish range (grabbing pending shorts above daily highs--turtle soup I think they call it), we will be able to drive down into the bullish imbalance weekly candle's range.
Let's see how we go! 😈

ADAUSD – Recovery, But Below The LineADA broke below the 200 SMA yesterday, selling off from $0.83 into $0.78 before forming a strong reversal pattern. It's now pushing back toward $0.81 resistance, but volume and RSI are showing signs of slowing. A reclaim of $0.8100 could trigger another leg toward $0.8170+. Until then, it’s a fading rally inside a bear structure.

CARDANO (ADAUSD): Bullish Move Ahead!
ADA is testing a key daily support cluster.
I think the market is going to bounce from that
and continue growing.
Next resistance - 0.97
❤️Please, support my work with like, thank you!❤️

ADA bulls in charge?ada up?
Ada tickeling the 1.00 area
As long as we stay above the support of 70 something we are good'
I hope psychologically we reache 1.25 minimum next
What do you think ?
ATH for ADA soonChart says it all, ADA looks prime to run, could reach as high as $6.80
1. Technological Upgrades and Hard ForksThe Plomin Hard Fork in Q1 2025 enhanced governance, while upcoming features like Leios for scalability, BTC DeFi interoperability, L2s, and partnerchains boost efficiency and adoption, positioning Cardano as a leader in secure, sustainable blockchain tech.
2. Spot ETF Speculation and Institutional InterestGrayscale's pending ADA ETF filing with Nasdaq, plus inclusion in their Large Cap ETF, could unlock massive demand. Analysts see this as a game-changer, similar to Bitcoin/ETH ETFs, potentially driving prices to $5+ by year-end.
3. Ecosystem Expansion and IntegrationsNew tools like the EMURGO global Cardano card for ADA payments, Blockchain.com DeFi wallet integration (37M users), and Tokeo Wallet's XRP bridge enhance real-world utility. DeFi TVL and on-chain activity (unique addresses +4.79%, active wallets +12%) are surging.
4. Whale Activity and On-Chain MomentumWhales are accumulating amid spikes in network volume and no downtimes/hacks. Features like privacy via Midnight Network and Charles Hoskinson's White House advisory role add credibility, fueling a "silent surge."
5. Technical Breakouts and Market CorrelationADA has formed bullish patterns like a golden cross, double-bottom, and breakout from descending channels, correlating with Bitcoin's rally. RSI at 76 signals strong momentum, with targets at $0.82–$1.18 short-term and up to $2.80+ long-term.
6. Airdrops and Community HypeUpcoming events like the Glacier airdrop and NIGHT airdrop are creating buzz, alongside Cardano's unmatched decentralization and energy efficiency, potentially sparking a 383% rally as in past cycles.

ADA Cardano Decsending Triangle Use Caution HereCardano had a heck of a move but i think its going to erase most if not all of it before it goes on its next leg up. A break over the overhead resistance line and finding support above would invalidate this. Not financial advice just my opinion. Thank you
ADAUSDI think ADA is at strong support zone on daily chart
This is my idea Act with your own strategy.

ADA - pull back then blast offIf ADA breaks below 0.85 I believe the next level of support will be @ 0.78 - this price level acted as resistance and was the Weekly high on 3 x occassions. Thus it is assumed that resistance will flip into support.
Bearish div. Suggests a move down as well as a break in the uptrend.
Entry @ 0.79
TP 1: 1.13
TP2: 1.43
TP3: 2.00
You could take a small short position now and profit in the event that price does start to retrace to 0.78 (ish)

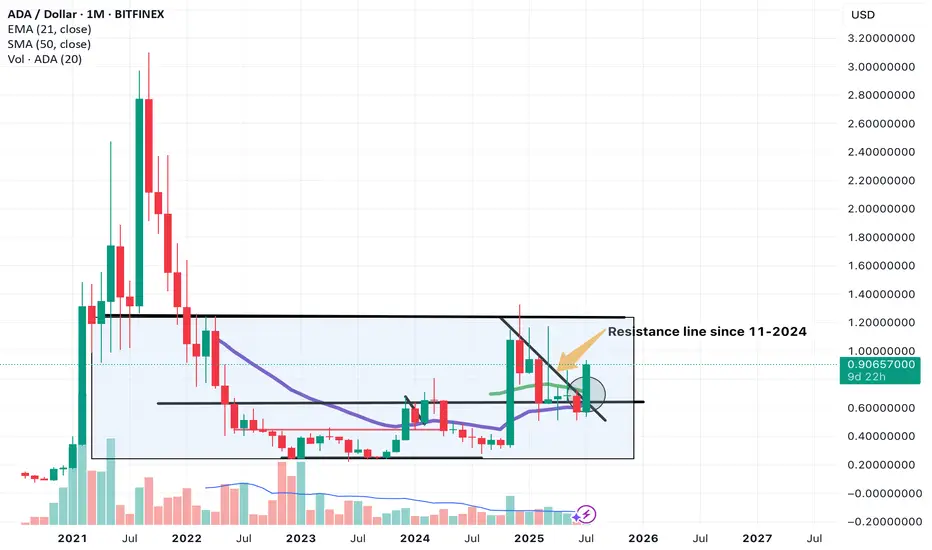
Cardano (ADA) a solid play in crypto, a Macro lookHi guys, so with Bitcoin in price discovery mode. It hints at the final phase of Crypto bull in action. With that comes altseason and in my opinion explosive growth in altcoins.
1 particular coin i've been looking at is Cardano (ADA).
This is a macro technical analysis of ADA on the 1 month timeframe. So each candle is 1 month of price action. This is very powerful on its own. And can give signs into where an asset will trend.
If you compare this to majority of other alts, its looking alot more bullish and is ahead of the game.
SO jumping right in.
Lets look at price action. Notice we are in a macro rectangle or sideways pattern.
Upper limit at $1.24
Lower limit at around $0.25.
This indicates a consolidation phase.
Real action is seen above that upper limit. Where we see explosive price action to the upside. Previously in Sept 2021 seeing highs of up to $3.07.
I believe we are making our way up to this $1.24 level.
Which in the short term will be a solid area to take profit due to it being a major supply zone in my opinion or sell zone. With a potential pull back. This is because if you look previously in price history, cardano price movement heavily involves this level with most of price history being either above or below $1.24.
A key sign but not yet confirmation is a breakout above this slanted resistance line we were being pushed down from that was created in 11-2024.
We have an engulfing candle break out currently. But still awaiting confirmation which will require august monthly candle to stay above this line and present a bullish candle print.
We will be on the look out for this.
There are other signs and signals appearing in Cardano (ADA) that support my theory and Price action developments. To take trades i always look for multiple signs that overlap.
Stay tune for more of that where ill go over many different indicators and other aspects that point to ADA being above other alts as a solid trade or investment for the next altseason.
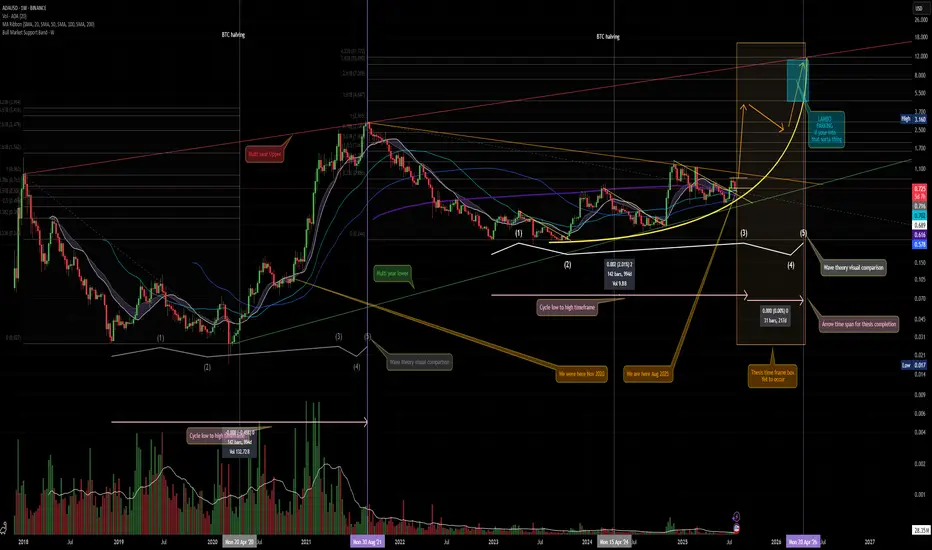
Last Cycle -> This CycleNo two cycles have ever been exactly the same and it remains to be seen if that will ever happen. Bitcoin has thus far demonstrated a certain amount of cyclicity and predictable behavior on a 4-year time scale that has been widely studied and written about. Given BTC's overall influence on the asset class, we'll make the assumption in this idea that ADA can also exhibit a certain amount of cyclicity and predictable behavior within a similar time period.
I'll start by defining 4, temporal 'parts'. From cycle to cycle they do NOT translate exactly and it's possible I'll look back in two years and realize I drew them wrong. Regardless of this, let's explore.
~~
Part 1 - The premature "Rally"
The rhetoric of "This time is different" and "We're going to see new ATH's next month" are particularly strong. This "Rally" usually starts towards the end of the pre-halving year or sometime early in the halving year. Positive USD price movements set the stage for a short staged, preliminary mania before the inevitable lull.
~~
Part 2 - The Pre-Parabolic lull
After seeing a 2x - 6x return from the cycle bottom, which is usually quite nice given years of mostly weekly red candles, a summer or late fall lull sets in.
The rhetoric of "Crypto is dead" and "It's never going to go up again" emerge.
The prior cycle, at least for ADA, appeared to be much shorter than this cycle's early new ATH ~6 months ago for BTC. Given bitcoin had a long cooling off period time year, it's not particularly shocking that ADA did as well.
~~
Part 3 - The first kickoff and the 35% downwick
Cue the US elections and like clockwork the asset class kicks off. BTC breaks 100k for the first time, ADAUSD skyrockets from ~$0.30 to ~$1.30.
IF YOU TAKE NOTHING ELSE FROM THIS POST AT LEAST CONSIDER THIS: ADAUSD, like ETHUSD, does not exactly have a great December track record during the halving year. Last Cycle, ADAUSD saw a -35% downwick from the local high to the local bottom. Ask yourself: Do you think this flushed some people out? Do you think some panic sold?
Nobody, not me, not anyone, knows where the USD valuation is going. I believe it's going to go higher but all I know for sure is that where we are now...December of the halving year...is behaving, overall, quite similar to December 2020. ADAUSD skyrockets to $1.30 and then wicks down to the $0.77 range.
~~
Part 4 - The Real Parabolic Rally
Cue the post-halving year which we are less than 2 weeks away from. In 2020, from the last week of December to the last week of February, ADAUSD rallies 834%.
834% in 8 weeks. And during this time, it printed 2 weekly red candles in the later half of Jan that sent the price down -34%. And then, at the start of March, it printed two more red candles that sent the price down -25%.
But the rally wasn't over because the USD valuation in the Spring of 2021 was still in the low $1's. It wasn't until the second week of May that ADA hit $2 for the first time and it wasn't until late August it hit $3.
~~~~~~~~~~~~~~~~~~~~~~~~~~~~~~~~~~~~~~~~~~~~~~~~
I believe the real parabolic rally hasn't start yet. I believe that if ADAUSD behaves similarly to how it did last cycle, we're going to have an exciting next 10 weeks, a cooloff in March+April, and an exciting start to summer.
There will be turbulence. There will be doubt. This is crypto, this is the nature of trading.
I suspect there will be weeks after a new local high is printed that we're all down 20%-40% and that's okay, it doesn't imply the end of the cycle.
~~
This isn't financial advice and this isn't investment advice, but now that we're still in the <$1.00/ADA it's probably worth determining what you want your exit strategy to be.
Good luck out there.

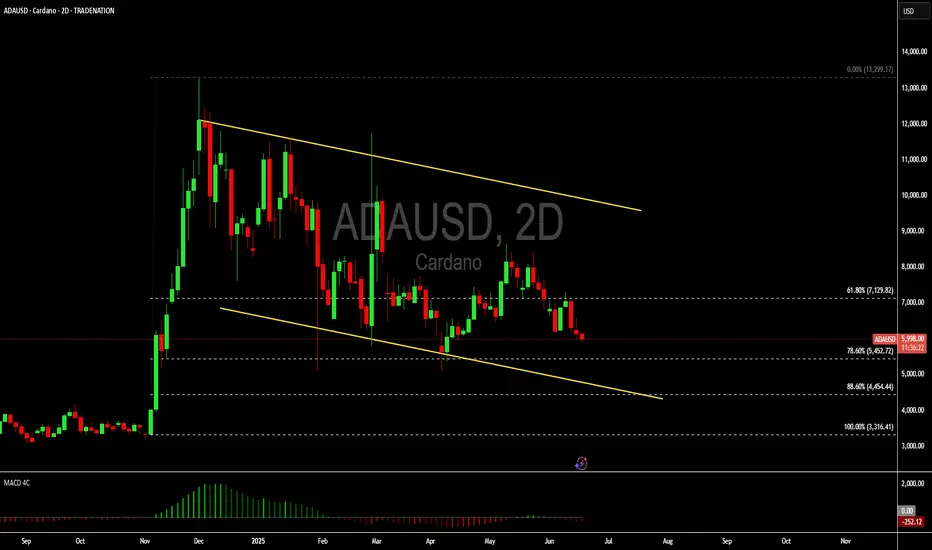
Cardona: Keep accumulating at lower pricesHello,
Cardona is currently correcting on the 2 days' timeframe. Looking at the Fibonacci retracement, the pair has retraced from the recent top and is trading near the 78% retracement level. The coin is currently correcting hence setting up for a good opportunity for buys. The flag pattern is a great pattern that can be used for continuation confirmation.
Cardano is a proof-of-stake blockchain network which can run smart contracts and Apps on its ecosystem. Arguably the beginning of the third generation of cryptocurrency, founder Charles Hoskinson broke away from his position at Ethereum in 2015 to create what is now considered one of the more peer-assessed projects in the game. Its native token ADA (named after English mathematician Ada Lovelace) was launched in 2017 and is designed to oversee governance and encourage participation in its ecosystem.
We see a strong case from both a fundamental and technical perspective. We see this as a perfect opportunity for long term crypto believers to keep accumulating the asset at depressed prices.
Disclosure: I am part of Trade Nation's Influencer program and receive a monthly fee for using their TradingView charts in my analysis.
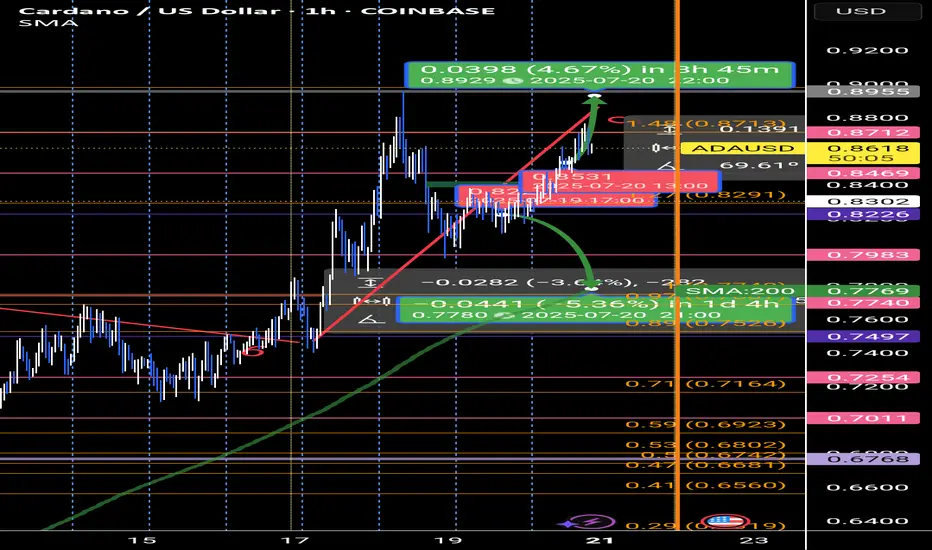
UPDATE ADA FORCAST🔄 When Time Speaks, Price Listens
#TimeAnalysis | #Cardano | #ADAUSDT | #SmartTrading
In my previous ADA/USDT analysis, the mistake wasn’t in the price structure—it was in the timing.
The price didn’t reverse where expected, not because the setup was wrong, but because I ignored one critical factor:
The time cycle must align with the price cycle.
📌 Here's what really happened:
From July 2 to July 7, price moved sideways in a clear accumulation range.
Then came an explosive expansion wave (Wave 3) from 0.573 to 0.75, lasting 113 hourly candles.
This was followed by a correction wave (Wave 6) of 130 candles.
Currently, price is in a distribution wave (Wave 9), ongoing for over 90 candles.
📉 My error? Misalignment between time and price.
📆 After applying my fixed monthly time cycle model, based on the rule that 9 marks the end of every cycle,
it became obvious that the price waves were following exact temporal intervals:
➡️ Monthly cycle anchor points:
(8 Jan, 7 Feb, 6 Mar, ..., 9 Sep, 8 Oct...)
Each month is divided into 3 major time zones, and each zone into two sub-zones.
This creates a clean framework where waves naturally unfold:
🔹 3 = Expansion
🔹 6 = Correction
🔹 9 = Distribution
💡 Key Takeaways:
Don’t trade predictions. Trade the wave.
Every price move is governed by time.
Ignoring time leads to premature entries—even with solid technical analysis.
🧠 Want to learn how to read these time-price cycles? Let’s discuss in the comments.
ADA GOES DOWN🔍 Still analyzing the markets based on price only?
Markets don't move randomly. They follow precise time-based cycles that repeat with uncanny accuracy.
In this analysis, I focused on:
🔁 Time segmentation using the 3-6-9 cycle
⏳ Key reversal points calculated with Time Cycle Lines
📉 Smart price action based on real Order Blocks and liquidity
🧠 A core belief that “Time is more important than Price”, inspired by Gann and modern cycle theory.
---
✅ Now the real question is:
Do you see how the major shift happened exactly at a timed zone, not just a price level?
🗣️ Let me hear your thoughts:
Do you use time tools in your strategy?
Would you like to learn how I project these reversal zones in advance?
👇👇
💬 Drop your insights in the comments
🔁 Share with traders who think beyond indicators
➕ Follow me if you want to explore how Time-based analysis can give you a real edge.
#TradingView #Forex #MarketCycles #GannTheory #SmartMoneyConcepts #ForexStrategy #DigitalAnalysis #TimeAnalysis #PriceAction #DrGemy
