ADA | Full AnalysisHere is the top-down analysis for CRYPTOCAP:ADA as requested 🫡
Weekly Timeframe:
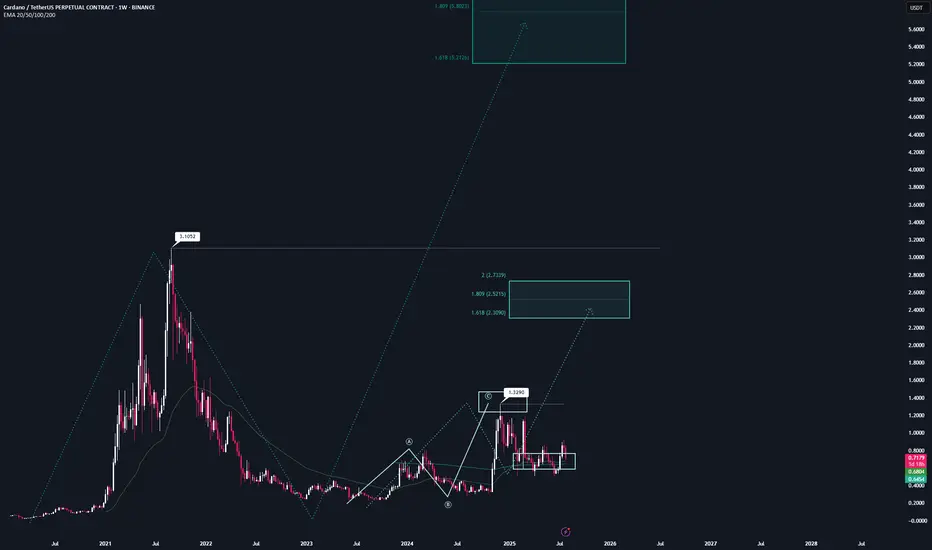
We have one large potential sequence on the weekly chart that will be activated once we break the ATH at $3.1, with a target zone around $5.2. This is also my conservative target for this bull run, assuming we get the “altseason” everyone is hoping for.
We’ve also already completed a smaller sequence on the weekly chart and then corrected into the overall correction level.
If we break the November high at $1.3, we will also activate a new structure that could take us close to the ATH.
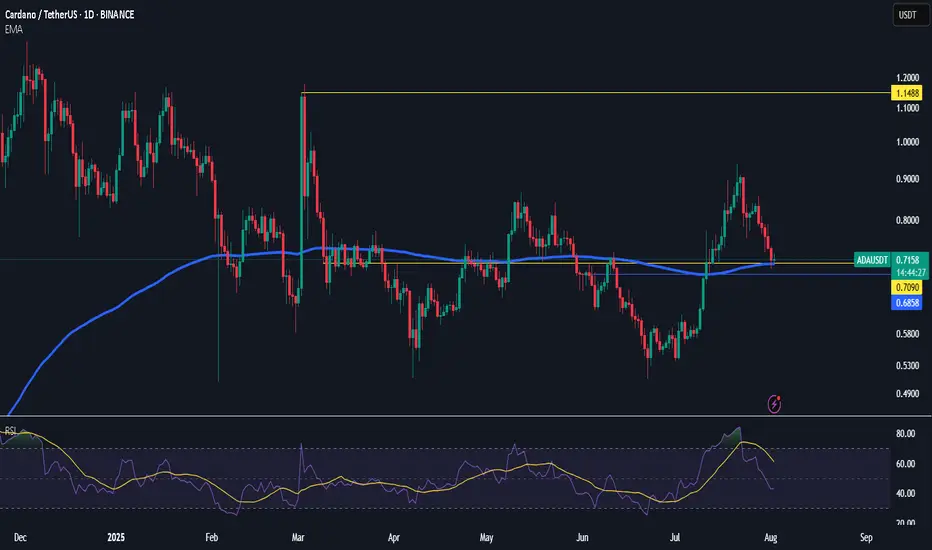
Daily Chart:
On the daily chart, we were rejected at the bearish reversal area (green) and corrected down into the B–C correction level, followed by a continuation into the target zone.
According to the rulebook, I expect a bounce from these regions and have positioned myself accordingly with 4 long orders — one at each level.
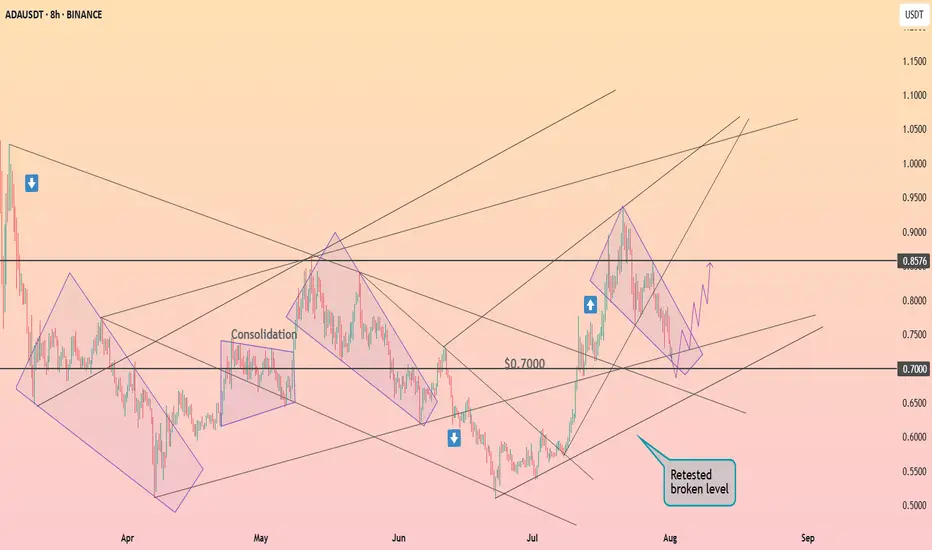
Local price action:
On the 4H chart, we have a bearish sequence that is counter to the primary scenario. Statistically, it’s less likely to play out, but it’s still worth noting.
The bearish reversal area (blue) is the next key level to watch if we get a bounce here.
If this area is broken, the follow-up move becomes very likely.
-----
Thats the my full Analysis for CRYPTOCAP:ADA , hope it was helpful if you want me to do another analysis for any other pair just comment down below.
Also, if anyone is interested in how my trading system works, let me know and I’ll post some educational content about it.
Thanks for reading❤️
ADAUSDT.3S trade ideas
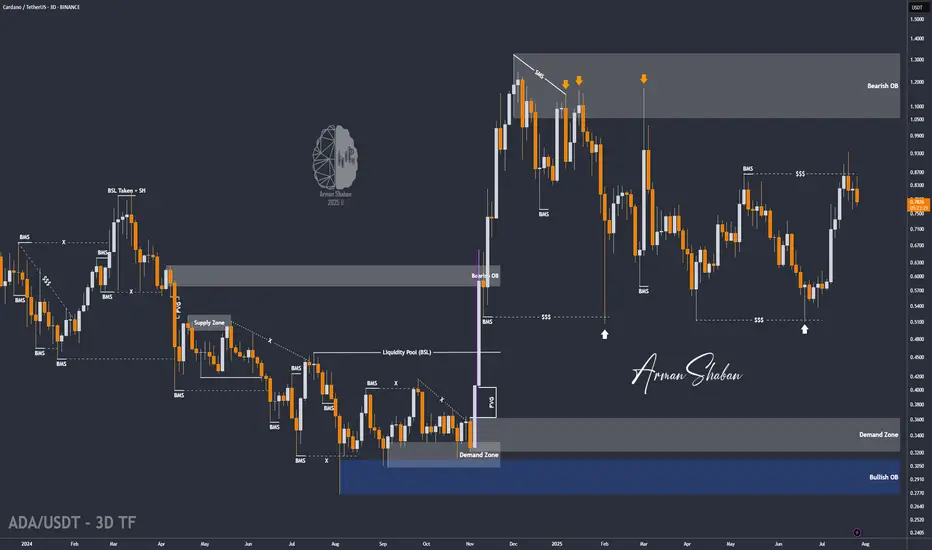
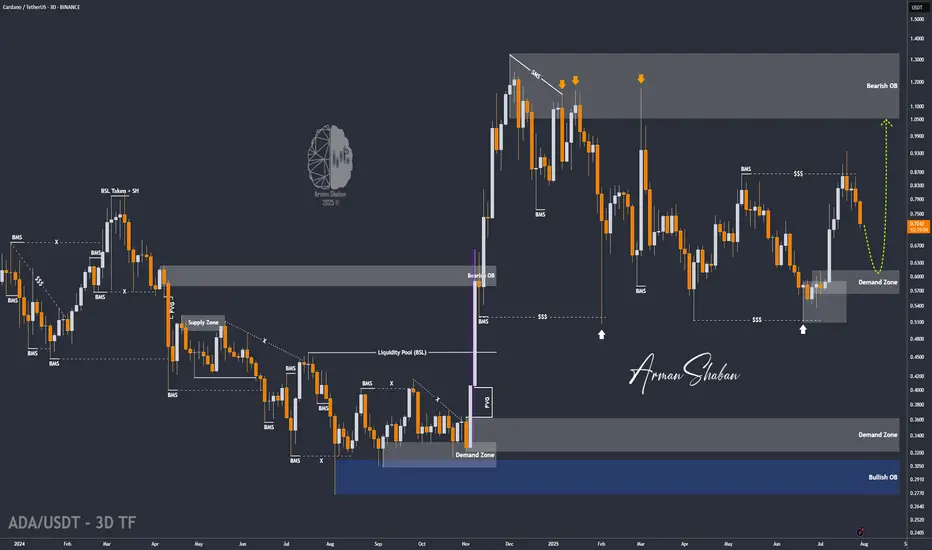
ADA/USDT | Pullback to Key Support – Can It Rebound Toward $1.32By analyzing the Cardano chart on the 3-day timeframe, we can see that after reaching $0.935, the price faced selling pressure and dropped by 18% to the $0.76 area. Now, the key is whether ADA can hold above the $0.75 level by the end of the week. If it succeeds, we could expect further bullish continuation. The next potential targets are $0.86, $0.93, $1.02, and $1.32.
Please support me with your likes and comments to motivate me to share more analysis with you and share your opinion about the possible trend of this chart with me !
Best Regards , Arman Shaban
Cardano (ADA): Seeing 1:10 Risk & Rewards Trading OpportunityCardano looks strong, still being above the major support area and showing the buy-side dominance on smaller timeframes. The key point here is the 200 EMA on the 1D timeframe!
More in-depth info is in the video—enjoy!
Swallow Academy

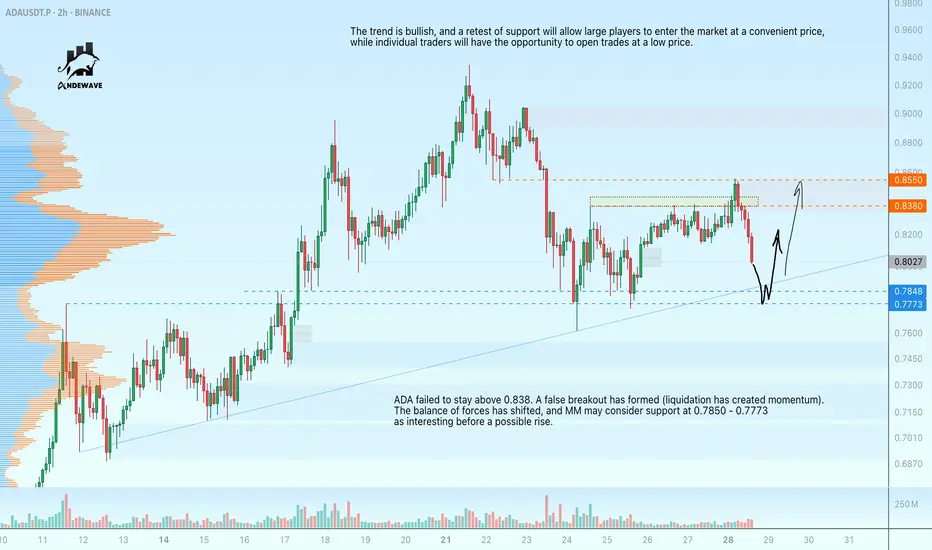
ADAUSDT - retest of support at 0.7850 before growthADA failed to stay above 0.838. A false breakout has formed (liquidation has created momentum). The balance of forces has shifted, and MM may consider support at 0.7850 - 0.7773 as interesting before a possible rise.
The trend is bullish, and a retest of support will allow large players to enter the market at a convenient price, while individual traders will have the opportunity to open trades at a low price.
ADA - Time to buy again! (Update)The pattern has broken, and now I expect the price to rise to $1.20 . AB=CD.
Give me some energy !!
✨We spend hours finding potential opportunities and writing useful ideas, we would be happy if you support us.
Best regards CobraVanguard.💚
_ _ _ _ __ _ _ _ _ _ _ _ _ _ _ _ _ _ _ _ _ _ _ _ _ _ _ _ _ _ _ _
✅Thank you, and for more ideas, hit ❤️Like❤️ and 🌟Follow🌟!
⚠️Things can change...
The markets are always changing and even with all these signals, the market changes tend to be strong and fast!!

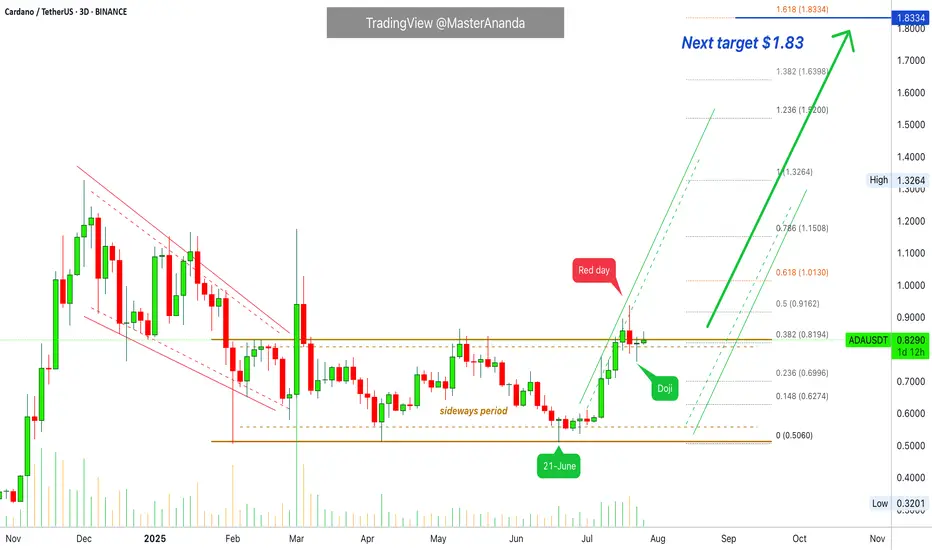
Cardano Update · Wait For New ATH Before Selling · Chart BullishI am using 3D candles. The last session is a Doji on ADAUSDT. There was a red session followed by a continuation with prices moving lower. That's last session, but it—the Doji—ended up closing green.
Sellers started to put pressure on the market and pushed prices lower (red day), by the next session, all selling was bought (Doji) and now ADAUSDT is back above 0.382 Fib. extension (0.8194). This is a bullish setup based on candlestick reading.
From here on ADAUSDT can grow to produce a higher high as long as it trades above this Fib. level, the continuation of the bullish move that started 21-June. So we had a small retrace and the action is recovering, right before bullish momentum grows, which means that this is a good setup to go LONG. It seems some positive event will develop soon and this will create a major wave, a major advance here and Cardano will see the highest prices in more than four years.
It can take a few days, not much longer; everything is pointing higher.
Here it is also wise to avoid selling too early. When we consider Cardano's potential for growth beyond $7, easily, we have to avoid paying attention to the temptation to sell when prices are still too low, the rise is only starting. It is ok to sell at major resistance levels if you have experience because there is always a stop before additional growth. If one is very active, it is easy to sell some at resistance and then buy more at support. But the easiest way is to buy and hold. If the entire bullish wave is set to produce 500%, this is always more than good enough so it is easy to hold thinking of the long-term.
We continue within the accumulation phase. While many pairs are already advanced and while prices are definitely growing, this is not it yet; things are about to go wild and it is better to be fully invested before the event. Everything Crypto. Buy Crypto. Hold Crypto. We are going up.
Namaste.
ADA Ready for PUMP or what ?The price on the 3d timeframe is within a triangle, which can create some uncertainty about which direction it will move. Here, we should wait to see which side of the triangle the price breaks out from. Remember, the trend is our friend.
Best regards CobraVanguard.💚

CARDANO | ADA Creeping UP to $1Cardano has made a big move in recent weeks, boasting a 77% increase.
If you were lucky enough to buy in around 30 or 40c, this may be a great TP zone:
Looking at the Technical Indicator (moving averages), we can see the price makes its parabolic increases ABOVE - which is exactly where we are currently beginning to trade. This could mean more upside is likely, and the 1$ zone is a big psychological resistance zone:
A continuation of the current correction may look something like this for the next few weeks:
_____________________
BINANCE:ADAUSDT
ADA/USDT | ADA Slips Below Support – Watching $0.61 for Support!By analyzing the Cardano chart on the 3-day timeframe, we can see that the price failed to hold above the $0.75 support and is currently trading around $0.72. Given the current momentum, a deeper correction for ADA seems likely. If the price fails to stabilize above $0.69, we could see a sharp drop toward the $0.61 zone. If ADA reaches this key support area, keep a close eye on it — a strong bullish reaction could lead to the next big upside move!
Please support me with your likes and comments to motivate me to share more analysis with you and share your opinion about the possible trend of this chart with me !
Best Regards , Arman Shaban
Cardano (ADA) at Key Support: A High-Confluence "Buy" Hello, traders.
Today we are focusing on Cardano (ADA), which is currently in a strong, established uptrend. After a significant rally, the price has entered a healthy corrective phase and is now testing a critical zone of technical support. This is a classic "buy the dip" scenario shaping up.
This analysis will detail the powerful confluence of structural, dynamic, and momentum-based signals that suggest the current level is a high-probability area for the uptrend to resume.
The Analysis: Stacking the Bullish Confluences
The most robust trade setups are built on a foundation of multiple, independent technical factors all telling the same story. Here’s the compelling narrative for a bullish continuation on ADA:
1. The Dominant Bullish Structure:
First, the market context is undeniably bullish. The Zig-Zag indicator paints a clear picture of a healthy uptrend, with a consistent series of higher highs and higher lows. As long as this structure remains intact, our primary bias should be to look for opportunities to join the trend, not to fight it. The current downturn is a correction, not a reversal.
2. The Dynamic Support Cluster:
Price has now pulled back directly into a major confluence of dynamic support.
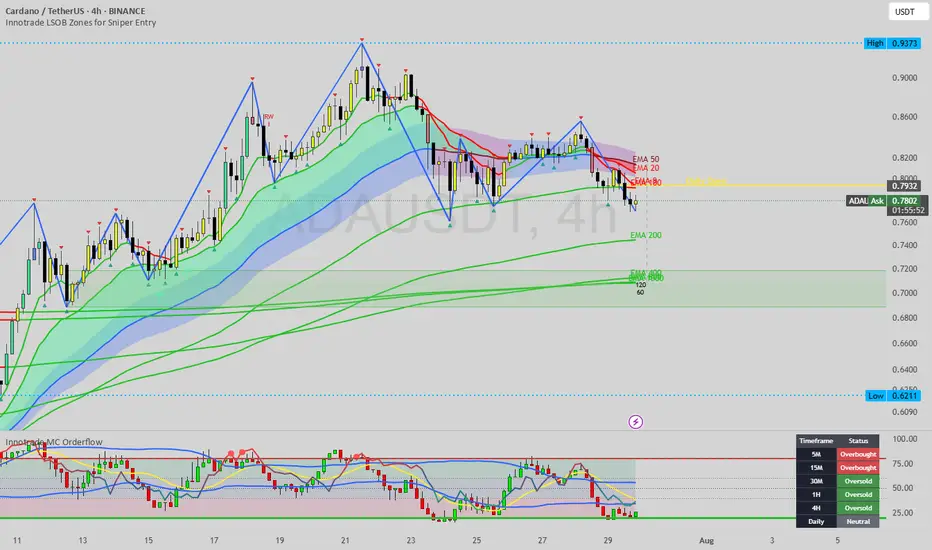
The EMA 100 & EMA 200: The price is currently testing the EMA 100 / EMA 200 band. This zone is one of the most significant support areas in an uptrend. Strong trends often find their footing and resume their advance after testing this key moving average cluster.
3. The Crucial Timing Signal (Multi-Timeframe Exhaustion):
This is the key to our timing. As the price has entered this major support zone, our momentum dashboard shows that selling pressure is becoming exhausted.
The 1H and 4H timeframes are both flashing "Oversold." This is a critical piece of information. It tells us that on the chart's native timeframe (4H) and the one below it, sellers have lost their momentum precisely at a point where buyers are expected to step in.
4. The Time-Based Pivot Signal:
Adding another layer of non-price-based confluence, a Fibonacci Time Cycle (purple lightning bolt icon) has recently printed. These cycles often mark temporal turning points where a trend can pivot. The alignment of a time-based signal with price-based support and momentum exhaustion creates a very powerful setup.
The Potential Trade Plan
Based on this strong stack of confluences, here is a potential trade plan:
Entry Zone: The current area around the EMA 100 / EMA 200 ($0.75 - $0.78) is the ideal zone to watch for bullish price action and potential entries.
Stop Loss: A logical stop loss can be placed below the recent swing low and the EMA 200, around $0.73, to protect against a deeper correction.
Potential Targets:
Target 1: A reclaim of the Daily Open at $0.7936.
Target 2: A test of the recent swing high around $0.85.
Target 3: A full retest of the major high at $0.9349.
Conclusion
We have a textbook confluence of bullish signals on Cardano: the price is correcting within a confirmed uptrend, has entered a major dynamic support cluster (EMA 100/200), and is doing so just as multi-timeframe momentum signals widespread seller exhaustion at a potential time-based pivot point. This presents a compelling, high-probability setup to "buy the dip."
Disclaimer:
This analysis is for educational purposes only and does not constitute financial or investment advice. Trading involves a high level of risk. Always conduct your own thorough research and consult with a licensed financial advisor before making any trading decisions.
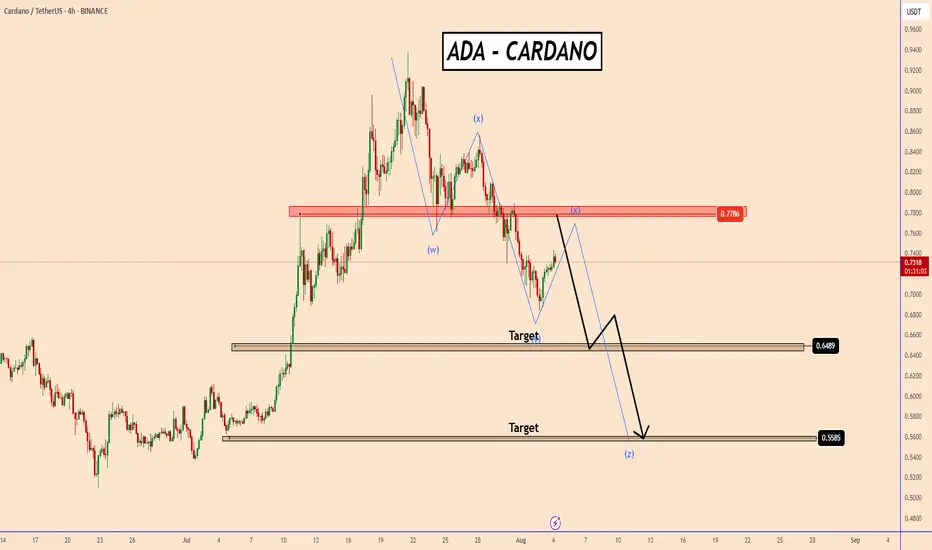
ADA has broken out from a key structure zone near 0.7780ADA - CARDANO, has broken out from a key structure zone near 0.7780
As long as the price remains below this level, the likelihood of a decline toward 0.6490 and potentially 0.5580 remains elevated.
This bearish potential is further supported by BTC, which appears to be entering a broader corrective phase or possibly accumulating before the next upward leg.
This uncertainty is exerting short-term selling pressure across altcoins. While this could hint at an emerging shift in trend, it's premature to confirm any long-term directional change at this stage.
You may find more details in the chart!
Thank you and Good Luck!
PS: Please support with a like or comment if you find this analysis useful for your trading day
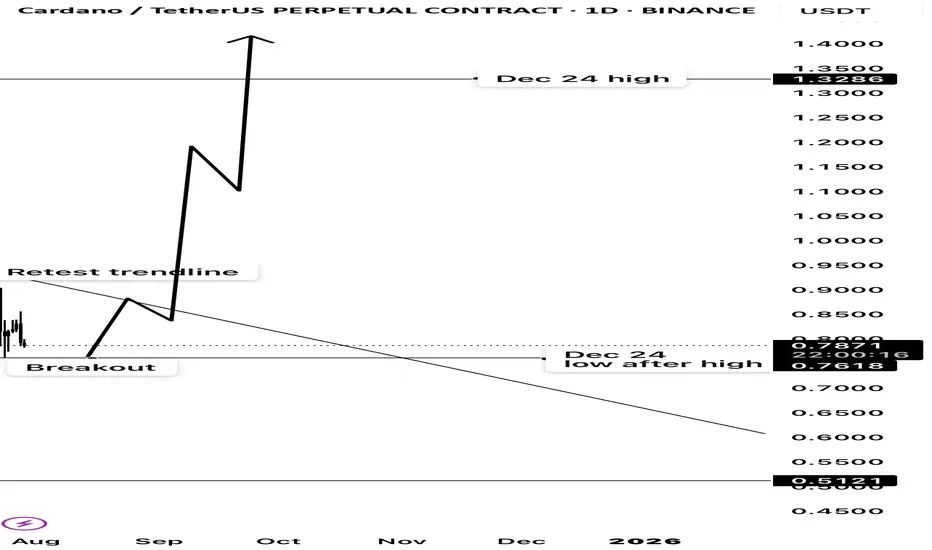
Cardano potential multi month breakout ?From december’s high cardano has been in a downtrend since.
The first low it made after the top from december had been a massive resistance.
It has risen from its 2025 lows and broke that resistance from all the way of december and retested its downtrend.
My take is, once it breaks that trendline it will go higher than the top of dec 2024.

ADA Setup – Eyeing Entry After 70%+ RallyCardano (ADA) has surged over 70% in recent weeks. A healthy pullback is underway, and we’re watching the key support zone for a potential long entry targeting the next leg higher.
📌 Trade Setup:
• Entry Zone: $0.65 – $0.67
• Take Profit Targets:
o 🥇 $0.98 – $1.15
o 🥈 $1.50 – $1.60
• Stop Loss: Just below $0.62

Cardano has successfully completed retesting ┆ HolderStatBINANCE:ADAUSDT is trading inside a symmetrical triangle near support at $0.445. Price continues to coil tightly with lower highs and higher lows, building pressure. A breakout above $0.465 would confirm bullish momentum toward the $0.49–0.50 zone. Key support remains intact and buyers are stepping in at every dip. A major move looks imminent.

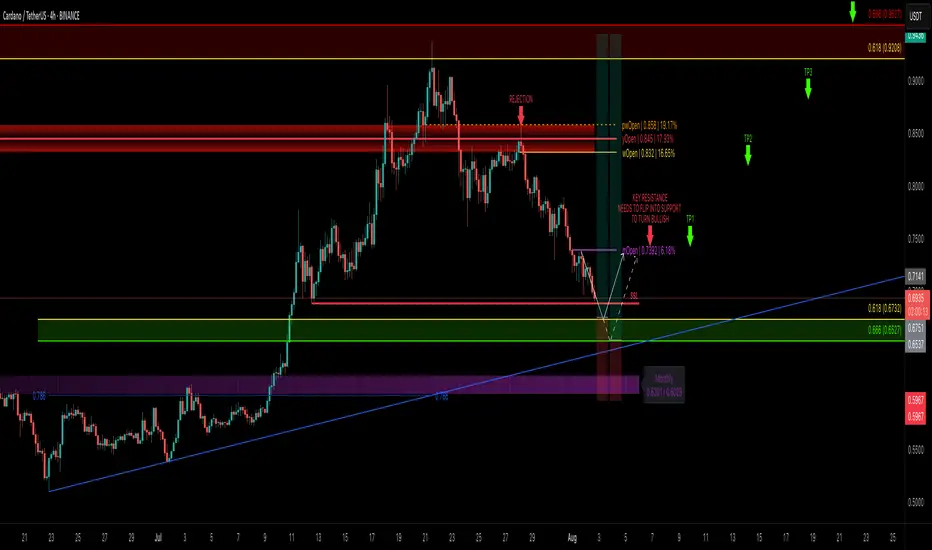
ADA Correction Nearing Completion — Is It Time to Load Up?After tagging the golden pocket resistance zone between $0.9208–$0.9527, ADA completed a clean 5-wave Elliott impulse right into a major resistance. Since then, price has corrected -25%, and we’re now likely nearing the end of an ABC correction — the final wave C.
🧩 Technical Breakdown
➡️ Wave A: 5-wave drop after the peak
➡️ Wave B: Bounce rejected at yearly open (yOpen) — that was a great short opportunity around $0.845
➡️ Wave C: Now working toward completion
🎯 C Wave Target Zone: $0.69–$0.65
This zone has strong confluence:
0.618 Fib retracement of the entire 5-wave move at $0.6732
1.0 TBFE (Trend-Based Fib Extension) aligns perfectly
Sell-side liquidity (SSL)
0.786 Fib Speed Fan support
Monthly 21 EMA/SMA adding a final confluence layer
🟢 Long Setup
Entry Zone: $0.69–$0.65 (ladder in)
Stop Loss: Below the monthly 21 EMA/SMA ($0.6)
Target 1: mOpen key resistance
Target 4: 0.666 Fib at ~$0.95
Risk:Reward: ~1:4+
💡 Educational Insight
After a 5-wave impulsive move, ABC corrections are common. Using the Trend-Based Fib Extension tool to project wave C, especially when paired with liquidity zones, VWAP, or moving averages, helps pinpoint high-probability reversal zones. It’s about confluence and reaction — not prediction.
🔍 Indicators
For this analysis, I’m using my own indicators
DriftLine – Pivot Open Zones and
MFT MA Support/Resistance Zones
both available for free. You can find them on my profile under “Scripts” and apply them directly to your charts for extra confluence when planning your trades.
_________________________________
💬 If you found this helpful, drop a like and comment!
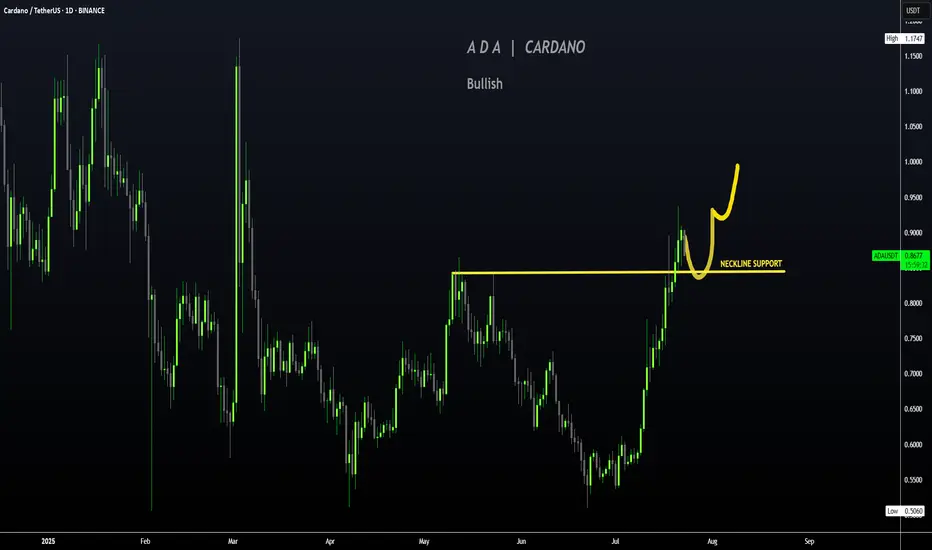
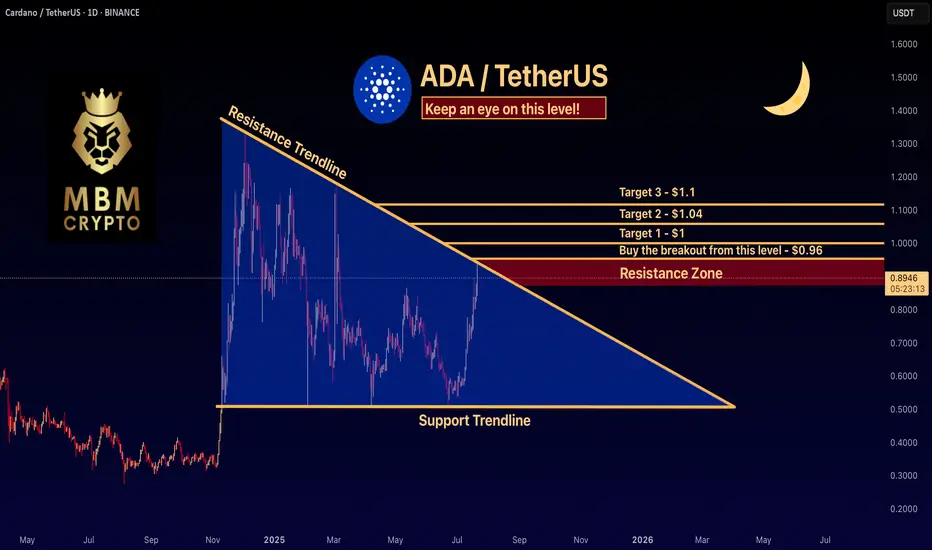
ADA: Keep an eye on this level! We recently shared a trade setup on ADA, highlighting the optimal entry point. Since then, the price has surged 15% above that level! If you missed it, don’t worry — here’s a new trade setup to watch closely.
-------------------------------------------
If you're looking to trade ADA at the moment, here's a quick setup that you might find helpful!
The idea is: Buy when the price breaks above $0.96 and take profits at the levels shown in the chart.
Targets:
1. $1
2. $1.04
3. $1.1
-------------------------------------------
Previous setup for ADA:
-------------------------------------------
About our trades:
Our success rate is notably high, with 10 out of 11 posted trade setups achieving at least their first target upon a breakout price breach (The most on TW!). Our TradingView page serves as a testament to this claim, and we invite you to verify it!
ADA Bearish DivergenceBINANCE:ADAUSDT
Support Levels: 0.7229 (recent low, first target for a drop).
0.5056 (deeper support, longer-term target).
Resistance: 0.9401 (recent high, potential stop loss level).
Trade Setup:
Target 1: 0.7229 (short-term, ~25% drop).
Target 2: 0.6716 (long-term, ~50% drop if bearish trend strengthens).
Stop Loss: 0.9401 (above recent high, ~25% above current price).
RSI Analysis: The RSI shows a bullish divergence (price making lower lows while RSI makes higher lows), suggesting potential upward momentum. Current RSI is around 57.33, nearing overbought territory (>70), so caution is advised.

$adaabove 200 ema on daily
range low
deivation likely
entered now let see if we get a wick below before up saving some to bid there
time for it to ressurect
Cardano is forming the falling wedge ┆ HolderStatBINANCE:ADAUSDT is testing the $0.70 level after a clean breakout from previous consolidation. The current retracement channel indicates a controlled pullback, likely to flip into bullish continuation if $0.70 holds. Watch for a move toward $0.8576 once the pattern breaks upward.
ADA Monthly Buying Opportunity As per my analysis ADA is showing buying opportunity in monthly chart. I hope it will return max 50% of investment in coming months. Trend is bullish, Monthly volume is above the average volume, golden level support. Do your own research before taking any risk.

Cardano sellll shorts All markets have TB in August.
Cardano sellll short
Tp1:0.50
Tp2:0.44
Tp3:0.29
Tp4:0.16😄😄😄😄😄

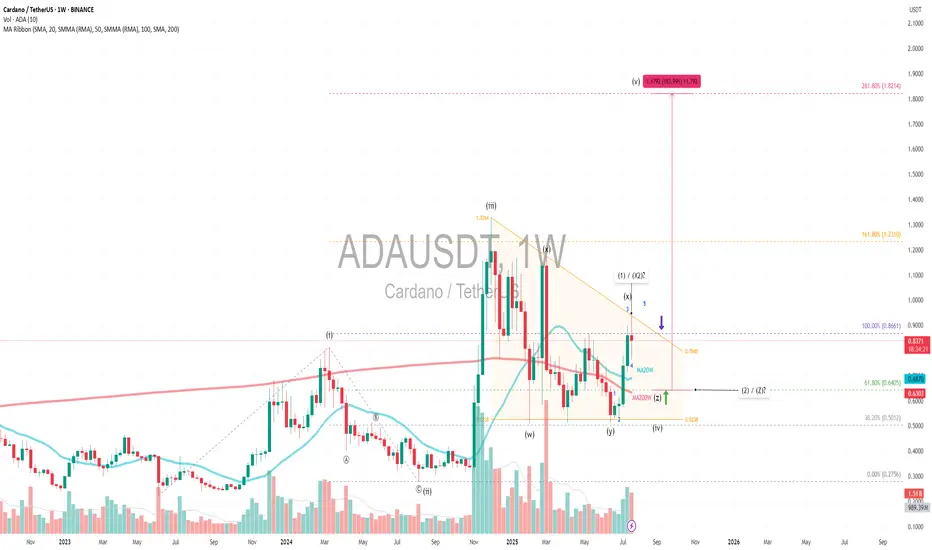
ADAUSDT|Triangle Setup WXYX2Z (1-2) +180% - Revisit $1.82 TargetPrimary Pattern: A contracting triangle within a larger corrective structure, likely wave 4.
Wave Count: A diagonal 5-wave impulse (i–v), followed by a WXY (X2) Z complex correction, suggesting wave 4 is still unfolding, possibly nearing completion.
Current Price: $0.83 with volume and SMA ribbon golden crosses showing bullish signal and near completion of accumulation phase.
Fibonacci Extension:
Targeting diagonal wave 5 at 261.8% extension from the base of wave 1 aligns with the projected target of $1.82, which matches the height of the triangle target. This also coincides with a +180% move from the possible upcoming wave Z or wave 2 —technically ambitious, but plausible if wave 5 kicks off with momentum.
Wave 4 Triangle Context:
The WXY(X2)Z structure implies a complex sideways correction which is typical of wave 4 behavior 1.6x - 2x wave 2 time extension
Key Support:
Entry: If X or 1 is nearing completion, and triangle support holds at key support MA20W Fibonacci 61.8%, the breakout into wave 5 could be explosive—especially with diagonal structure suggesting a leading diagonal pattern.
SL: Triangle Support is the last liquidity / smart money entry
Always trade with affordable risk and respect your stoploss!