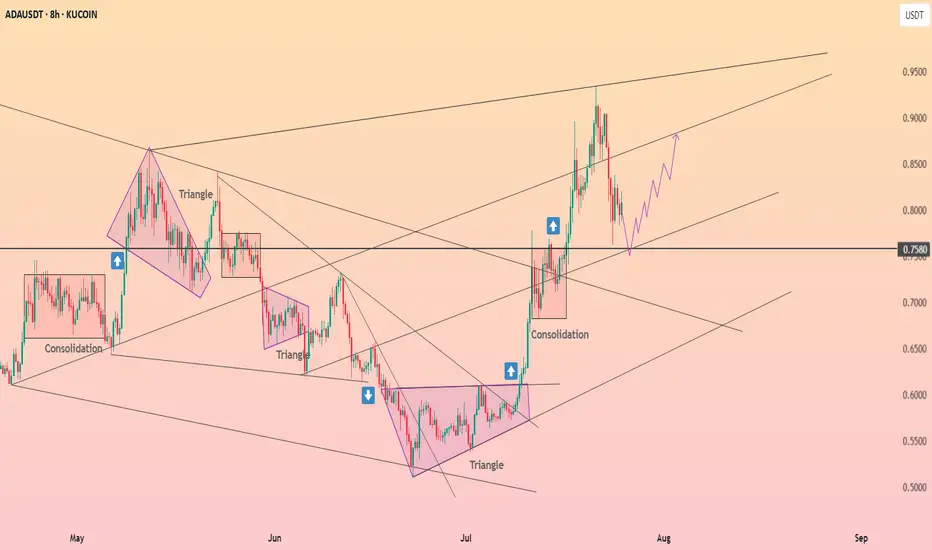
ADA (repeat the pattern)ADA /USDT
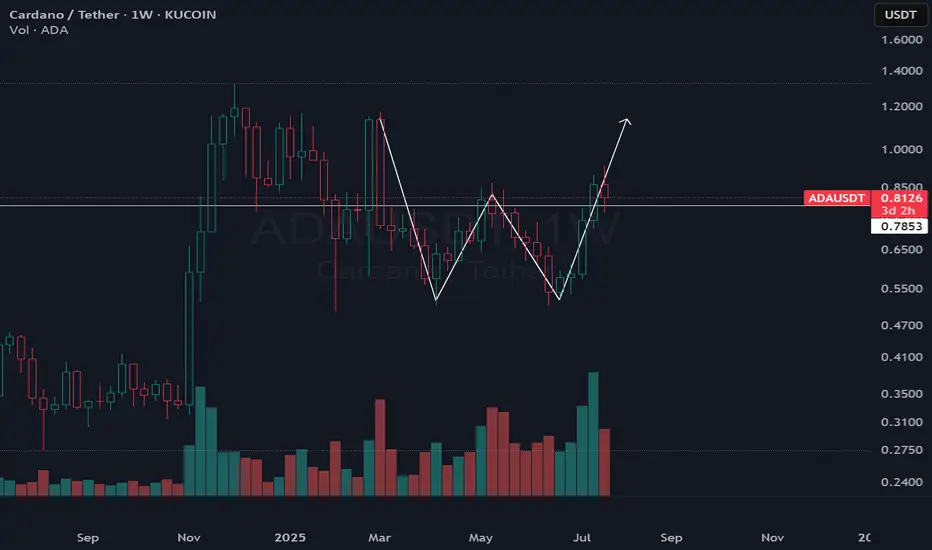
ADA keeps repeating its old patterns as it’s clearly obvious in my chart
Breakout is going on lower time frames
Looks like an easy 2X
ADAUSDT.3S trade ideas
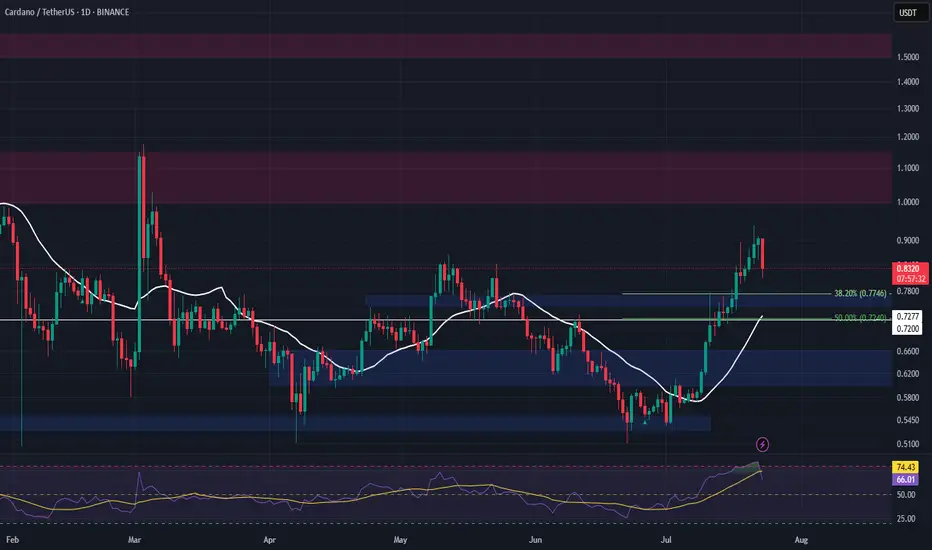
DeGRAM | ADAUSD holding above the support level📊 Technical Analysis
● Mid-July breakout from the 10-week falling wedge cleared the long-term resistance line; price retested that line & the 0.756 support band (prior range high) and printed a higher-low on the rising channel’s lower rail.
● The new up-sloper guides bulls toward the channel crest / horizontal target at 0.880, while the 0.775–0.780 zone now acts as a launch pad for the next leg.
💡 Fundamental Analysis
● Buzz around August’s Chang governance hard-fork and a 12 % m/m jump in Cardano TVL signal improving network demand, backing the technical upside.
✨ Summary
Buy 0.775-0.790; hold above 0.756 eyes 0.86 ▶ 0.88. Bull view void on a 16 h close below 0.72.
-------------------
Share your opinion in the comments and support the idea with a like. Thanks for your support

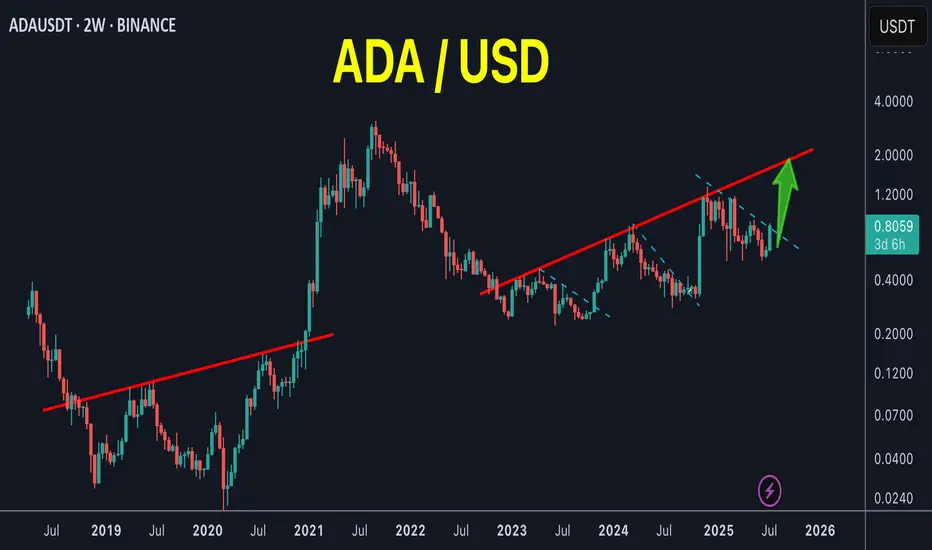
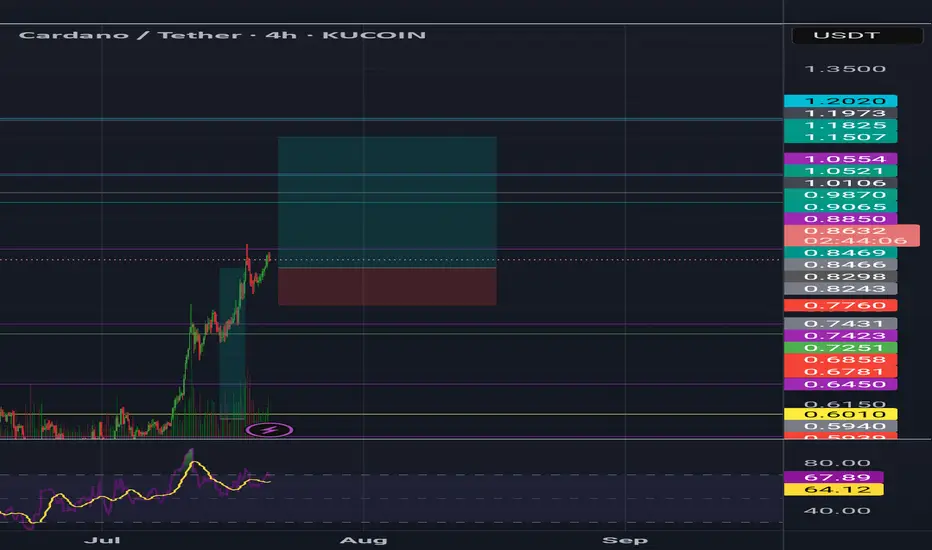
ADA/USDT | Multi-Month Breakout Brewing — a 10x play ?Cardano is quietly mirroring its previous macro cycle — but this time, the structure looks tighter, cleaner, and potentially more explosive.
The multi-month chart reveals a consistent uptrend forming off the 2022 lows, contained within a well-respected ascending channel. The price action shows strong similarities to the 2018–2020 accumulation phase, followed by the breakout that led ADA to its all-time high in 2021.
The current price structure is forming higher highs and higher lows within a channel — a strong bullish continuation pattern.
Volume has been increasing steadily during the up-moves, signaling real demand building underneath.
Fibonacci Extensions from the previous cycle highs and lows show key long-term resistance zones:
1.618 – $4.91
2.618 – $7.79
4.236 – $12.47
These levels could act as major psychological targets if the trend continues to evolve similarly to the last cycle.
⏳ Current Price (~$0.64) is still significantly below previous all-time highs and long-term extension zones — offering a potentially favorable risk/reward setup for patient investors.
⚠️ As always, nothing moves in a straight line — but if you're a macro-mind investor, you’ll start to notice more straight lines than most. Zooming out often reveals the patterns that noise hides.

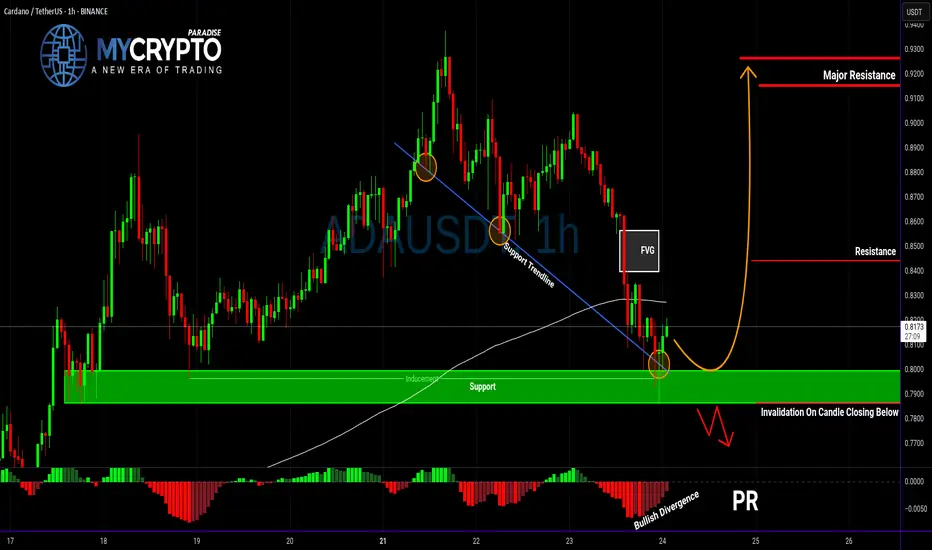
ADA About to Explode or Collapse?Yello Paradisers — is ADA gearing up for a breakout, or are we walking straight into a bull trap? After the recent pullback, the market is throwing mixed signals, but this setup is becoming too important to ignore. Here’s what we’re seeing right now on ADAUSDT.
💎ADA is currently showing positive signs of strength after a solid retracement. Current support zone is not only a historical price pivot, but it's also aligned with a supportive trendline, the 200 EMA, and a developing bullish divergence on the chart. All these factors combined are increasing the probability of a short-term bounce — but that doesn't mean we go in blind.
💎For aggressive traders, entering at the current price might make sense, especially if you’re targeting the first resistance level. However, it’s important to note that this entry offers a relatively limited reward compared to the risk — roughly a 1:1 risk-reward ratio — so it’s crucial to size your position accordingly and keep tight control over your stop loss.
💎If you're looking for a cleaner setup with a better risk-to-reward profile, patience is key. A more favorable scenario would be waiting for a proper pullback and a confirmed retest of the support zone. Ideally, you want to see a strong bullish candle at the support level to signal continuation — that’s when the setup shifts from average to high-probability.
💎But be cautious. If the price breaks down and closes a candle below our support zone, the entire bullish idea becomes invalid. In that case, it’s much wiser to step back and allow the market to develop more structure before re-engaging. Forcing trades in uncertain conditions is where most traders lose, and we don’t want to be part of that crowd.
🎖Strive for consistency, not quick profits. Treat the market as a businessman, not as a gambler. Be patient, Paradisers — only those who follow structured strategies and risk management will thrive in the long run.
MyCryptoParadise
iFeel the success🌴
ADAUSDT Breaks Long-Term Downtrend – Critical Support Retest!The ADAUSDT pair is showing a compelling technical setup. The price has successfully broken out of a long-term descending trendline (yellow line) that had been acting as dynamic resistance since late 2024. This breakout came with strong momentum, signaling a potential shift from a bearish trend to a bullish reversal.
After the breakout, price managed to rally up to minor resistance around $0.90, but is now pulling back and retesting the key support zone (highlighted yellow box) — a previous strong resistance area now potentially flipping into support.
---
🟢 Bullish Scenario:
If the price holds above the $0.80 - $0.83 support zone, the break-and-retest structure will be validated.
A successful bounce from this area could push ADA back toward:
$0.90 (current minor resistance)
$1.13 (psychological and horizontal resistance)
$1.23 (previous supply zone)
$1.32 (recent local high)
A confirmed bullish continuation will be more convincing if the price forms a higher low and breaks above $0.90 with strong volume.
---
🔴 Bearish Scenario:
If ADA fails to hold the $0.8281 support and falls back below the descending trendline, then:
It may re-enter the previous range and test lower support around $0.75 or even $0.65.
This would suggest a potential false breakout and return to bearish territory.
Watch for bearish candlestick confirmations below $0.80 as an early warning.
---
📌 Pattern Insights:
Descending Trendline Breakout: Suggests a possible long-term trend reversal.
Break & Retest Structure: Price is currently testing the previous resistance zone as new support.
Layered Resistance Zones: Several clear resistance levels above provide logical targets for a bullish rally.
---
📊 Conclusion:
ADAUSDT has printed an early signal of a bullish reversal by breaking out of a long-standing downtrend. However, the sustainability of this trend depends heavily on the ability of price to hold the $0.80 - $0.83 support zone. Look for bullish confirmation candles in this area for a safer long entry.
#ADAUSDT #Cardano #CryptoBreakout #TechnicalAnalysis #Altcoins #BreakoutSetup #BullishRetest #CryptoChart #SupportAndResistance #PriceAction #TrendReversal

Cardano held above $0.76 ┆ HolderStatBINANCE:ADAUSDT is compressing under $0.44 with support from $0.418. Breakout from wedge structure may target $0.462. If $0.418 breaks, downside risk opens to $0.40. Watch for volatility.
Cardano (ADA) Just Flipped Bullish — Next Stop: $0.9373?ADAUSDT is currently displaying a strong bullish structure on the 4-hour chart, bouncing from a critical support zone near $0.7774–$0.7315. After a healthy retracement, the pair appears to be regaining momentum, forming a potential higher low, which aligns with the continuation of the broader uptrend that started earlier this month.
Recent price action confirms that buyers are stepping in at key zones previously marked by blue “B” labels, and sell-side pressure seems to be weakening after the last swing top around $0.9373. The support zones, marked with dotted green lines, have held well, and the current structure suggests a rebound toward the previous high.
The most recent small leg up shows the formation of a bullish engulfing setup near $0.78, which could serve as a launch point toward the higher resistance. The candlesticks are also showing longer lower wicks — a sign that buyers are defending lower levels aggressively. With price currently floating near $0.81, there’s a good upside window available.
Here’s the trading setup based on the chart:
• Entry: Around $0.8106 (current price zone)
• Take Profit (TP): $0.9373 (previous swing high — +18.23%)
• Stop Loss (SL): $0.7315 (invalidates higher low structure — -7.73%)
• Risk-Reward Ratio: 2.36R (favorable for swing positioning)
If ADA can reclaim the $0.85 zone with strong candle closures, it would signal bullish continuation. Momentum indicators like RSI or MACD (not shown) would likely confirm the shift, especially if divergence was forming on recent dips.
Until ADA breaks below $0.7315, the bullish bias remains intact. The formation of higher lows and increasing buying interest at dynamic supports adds weight to the long setup. Price reclaiming the $0.85 zone may trigger a fast rally to $0.93, and possibly beyond if market-wide sentiment remains risk-on.

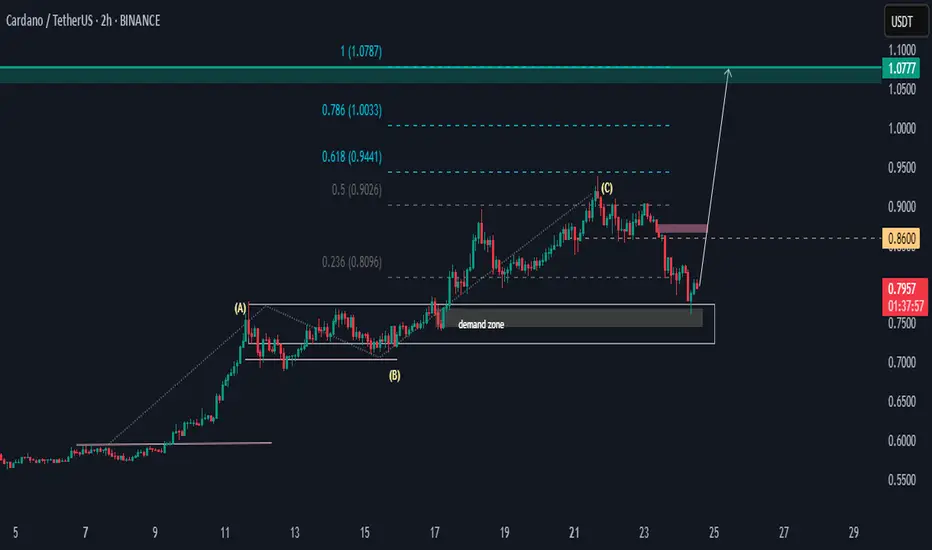
ADAUSDT SND Setup.Hello,
ADAUSDT has the potential to rally from the demand zone of 0.75 to 0.86 before rising above the high of point (C). We have two price targets, with a bias toward 1.0777.
If the price falls below the demand zone, then the setup will be invalid. A generic SND momentum flow analysis.
Happy Trading
Khiwe.
Inside day breakoutYesterday was an inside day. On the daily chart it is breaking out, pulled back to 50% and supported by 200ma + 20ma. Ascending triangle supported by 20ma above 200ma into the Asian session. Looking to hold till close

CardanoAda usdt Daily analysis
Time frame daily
Risk rewards ratio >3 👈👌
Double bottom pattern has been created

CardanoAda usdt Daily analysis
Time frame 4hours
Risk rewards ratio >4.3
Target =1.15$
Cardano is the Valuable asset in crypto market
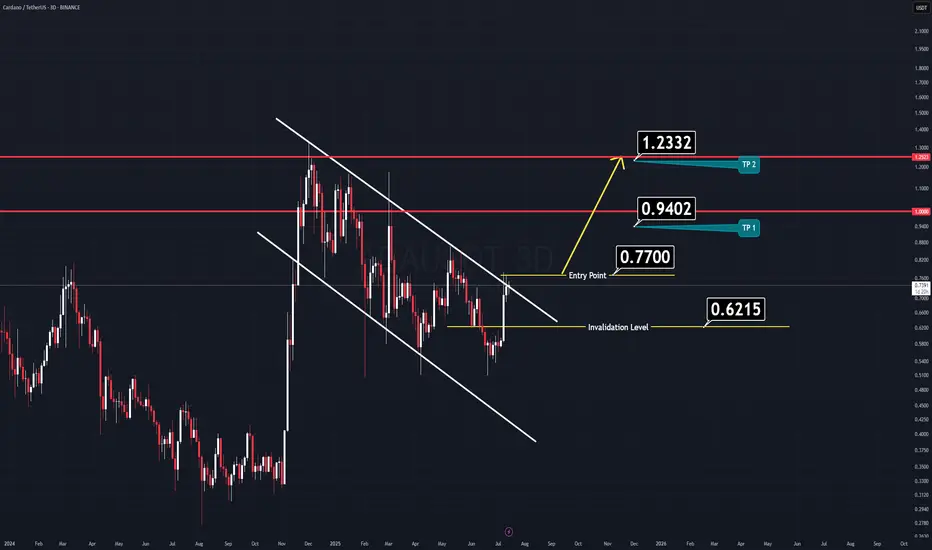
ADAUSDT - Buy or Regret!As clear and simple as the chart is… the target is just as clear and reliable.
ADA is showing strong bullish structure on the 3-day chart — breaking above the red trendline with a successful retest, and also breaking above the 100 EMA.
The blue trendline represents a strong hidden resistance level that many traders are overlooking.
The upside move is likely to end around the 0.786 Fibonacci level, which intersects with this blue trendline — in the $1.50–$1.70 range.
A strong project. A fundamentally sound coin that respects technical analysis.
A logical and high-probability target.
Best regards Ceciliones🎯

Ada ready for 1.1According to my market analysis, Cardano is also ready to complete its pattern and pump towards $1.1.
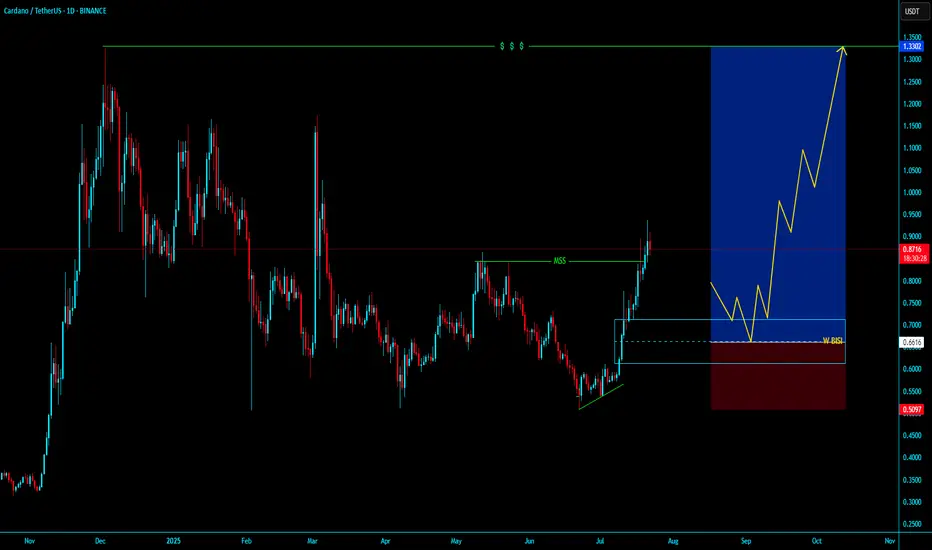
ADAUSDT BUY LONG ADAUSDT BUY LONG Weekly BISI
BullRun will starts it will going to moon for 4-5 month in daily tf .
Valid Mss with ValidOBI our buying zone .54 $ - .72 $ target atleast 7 - 10 $
holding for 3-5 month from buying , deeply buying from this weekly bisi , IF Market will more
correction then more opportunity to buy in deep , patiently wait for Enjoyable Returns
Just Hold & Enjoyyyyyyyyyyyyyyyyyyyy
~ KGB Priyabrta Behera ~
ICT Trader & Advance Mapping SMC Trader
HolderStat┆ADAUSD broke through the resistanceBINANCE:ADAUSDT is trading just below $0.406 after bouncing from $0.386. The setup favors a breakout if resistance is breached. Price structure remains bullish while above $0.386.

ADA Analysis (3D)Here’s another clean and straightforward chart, this time on Cardano (ADA).
ADA has formed a large flag pattern, which looks poised for a breakout soon.
Just like the previous setup, nothing complicated here.
✅ Entry Idea:
Consider entering when the price breaks above the previous daily candle’s high.
All the key levels are already marked on the chart for easy reference.
Keep it simple,
Good Luck.
ADA Spot Entry – Pullback Opportunity AheadADA has reached a major resistance zone, and with the broader market appearing overbought, a healthy pullback looks likely. We’re watching for a dip into the next key support area to accumulate for spot holdings.
📌 Trade Setup:
• Entry Zone: $0.75 – $0.77
• Take Profit Targets:
o 🥇 $1.00 – $1.15
o 🥈 $1.50 – $1.60
• Stop Loss: Just below $0.72
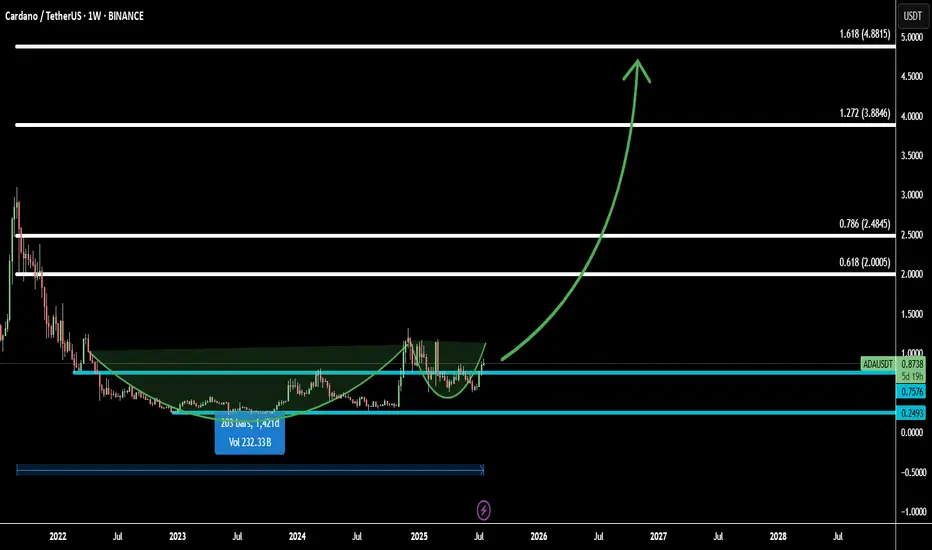
ADA Ready to Fly: Cup & Handle Pattern + Fibonacci TargetsCardano (ADAUSD) is forming a classic cup and handle pattern on the higher timeframe, signaling a bullish continuation setup that often precedes strong upward moves.
Combined with Fibonacci extensions, the breakout potential is high, with multiple target levels mapped out:
Target 1: 0.618 Fib – 2.0005 - confirms breakout strength
Target 2: 0.786 Fib – 2.4845 - momentum continuation zone
Target 3: 1.272 Fib – 3.8846 - full extension based on pattern measurement
Target 4: 1.618 Fib – 4.8815 - aggressive bull target for long-term holders
If ADA breaks the handle with strong volume, it could initiate a powerful rally. This setup is ideal for swing traders looking for a high-probability entry.
Let’s catch the next big move together! 🚀
ADA / USDT lying on support ,ready to bounce and break trendlineADA/USDT broke above horizontal resistance and is now retesting from the trendline above. If it holds this support and bounces, a strong move toward $1.00, $1.20, and even $1.40 could follow. One to watch closely in the coming days.

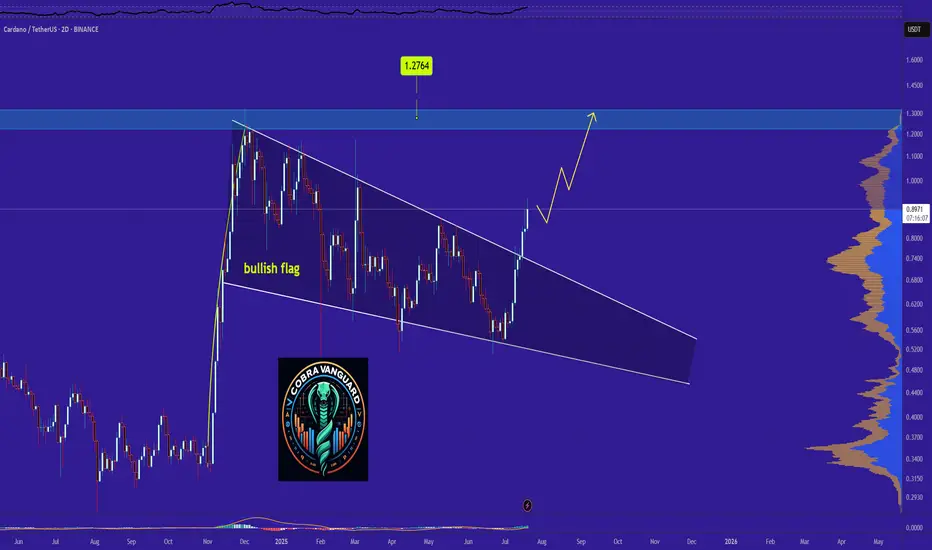
Why ADA Remains Bullish and Its Next Potential Move !The pattern has broken, and now I expect the price to rise to $1.27 . AB=CD.
Give me some energy !!
✨We spend hours finding potential opportunities and writing useful ideas, we would be happy if you support us.
Best regards CobraVanguard.💚
_ _ _ _ __ _ _ _ _ _ _ _ _ _ _ _ _ _ _ _ _ _ _ _ _ _ _ _ _ _ _ _
✅Thank you, and for more ideas, hit ❤️Like❤️ and 🌟Follow🌟!
⚠️Things can change...
The markets are always changing and even with all these signals, the market changes tend to be strong and fast!!
ADA potential breakoutADA is near a breakout point on the daily timeframe. If we break out the triangle I have 2 targets.
Target 1: $1.135
Target 2: $1.325
Best of luck to all.

accordion to the moonhows and whys of the trade of way out of your IQ level,I'm an Iranian and i'm not going to make you muricans rich while you bomb my country. if it does break above it first high that it will form it becomes really high probability and that's why i published this.

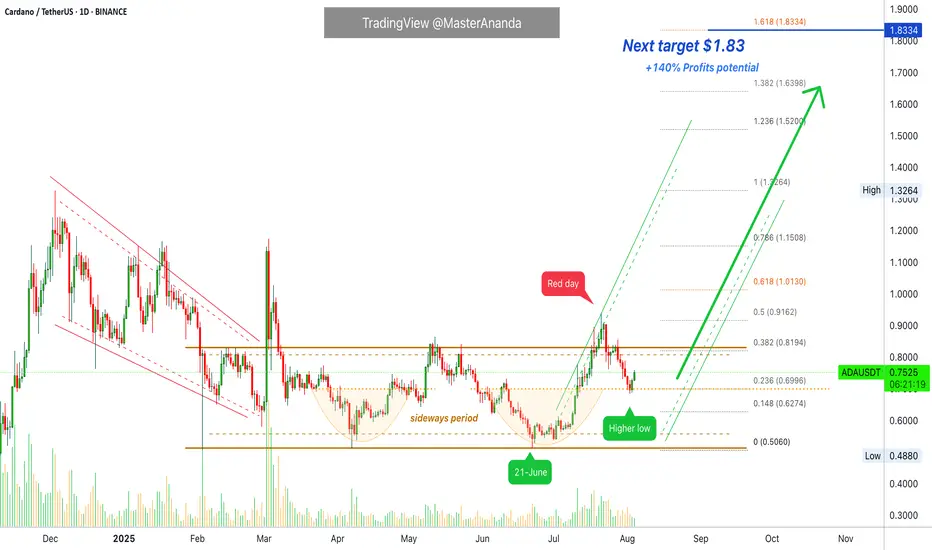
Cardano Higher High Hidden Signal Confirmed · UpdateGood news. We already have a higher low and Cardano back into the long-term accumulation zone but on the bullish side. You know a channel has a middle portion always and the lower portion relates to the bears while the upper portion is owned by the bulls. This is the good news, Cardano is staying safely, nicely on the bullish side of the 2025 consolidation channel. Cardano has been in this range almost the entire year but everything looks great.
The broader bias is bullish based on the strong advance late last year. This was a strong advance and every strong move needs to be consolidated before anything else happens. This is the correction followed by sideways action. After this phase is over, now, then we see a new move develop, the continuation of the previous move—the bullish wave.
We have 140% profits potential (PP) to $1.83 but this is still some middle way, mild, middle portion move. The market will continue to heat up, evolve and grow and as this happens we will be taking out several resistance zones and with these gone we can expect higher prices and finally the new all-time high we have been waiting for for so long. Patience of course.
Chart: Cardano (ADAUSDT) Daily Timeframe with MA200
Notice just three days below MA200 and now back above this level. In the past when ADAUSDT moved below MA200 it would stay months below this level. This time it was pierced briefly and the action moves back above. This means that the bulls are in control.
The retrace was short, small and low volume which means weak. Weak bears, weak sellers means that we are bullish and bullish means green.
With all this said and done, you can expect growth for months. Continue to buy, continue to trust and continue to hold. You will be happy with the results. Crypto is going up.
Energy for all readers. Let's grow together, let's be open, learn and share. The best is yet to come. You are special. You are a divine living being and you deserve the best... Thanks a lot for your continued support.
Namaste.