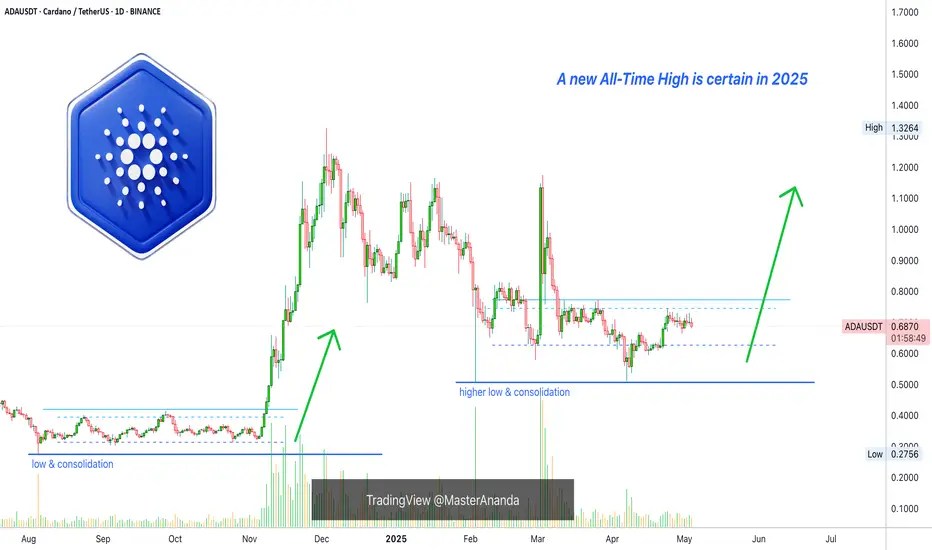
ADA/USDT: Is ADA Preparing for Its Next Rally?(READ THE CAPTION)By analyzing the #Cardano (ADA) chart on the 3-day timeframe, we can see that over the past few months, the price surged from $0.33 to $1.32, delivering a gain of over 300%. After reaching its highest level in 3 years, it faced selling pressure and corrected down to $0.50.
Currently, Cardano is tra

Cardano: Buy Opportunity In The Making (Buy When Red)Retraces, even if these are very small, can be used as an opportunity to buy. Whenever the market turns red that is an opportunity in the making, because we are set to experience growth long-term.
When the market is green, we either wait patiently or secure portions of profits. When the market turn
Cardano, 2nd Entry —Friendly ReminderI am doing a second entry on Cardano for my people with leverage. I know it is more risky as we no longer have bottom prices but the show must go on.
When the action is already ongoing, when it is no longer 100% certain that we are looking at a bottom, we still jump-in but with lower leverage compa

Parallel Channel Ending? Cardano Targets 0.85 With 20% SurgeHello and greetings to all the crypto enthusiasts, ✌
All previous targets were nailed ✅! Now, let’s dive into a full analysis of the upcoming price potential for Cardano 🔍📈.
Cardano is consolidating within a parallel channel, nearing a major daily support level after a sharp decline. This tec

ADAUSDT – Major Breakout Brewing, Watch These Key Levels! 📈🔥 ADAUSDT – Major Breakout Brewing, Watch These Key Levels! 🚀
Cardano is waking up from its long consolidation phase, and the chart is setting up for a potential major impulsive wave. History shows us what happens when ADA compresses at the lower all-time trendline—and we’re right back at that cri

Cardano 5X Lev. Full PREMIUM Trade-Numbers (PP: 2110%)I want to share a trade setup that looks really good. It has relatively low risk with a very high potential for reward. The low risk is not based on the amount of leverage but the chart itself.
Notice the low 3-Feb., there is a higher low 7-Apr.
If you can open a position that is safe above the 3-F

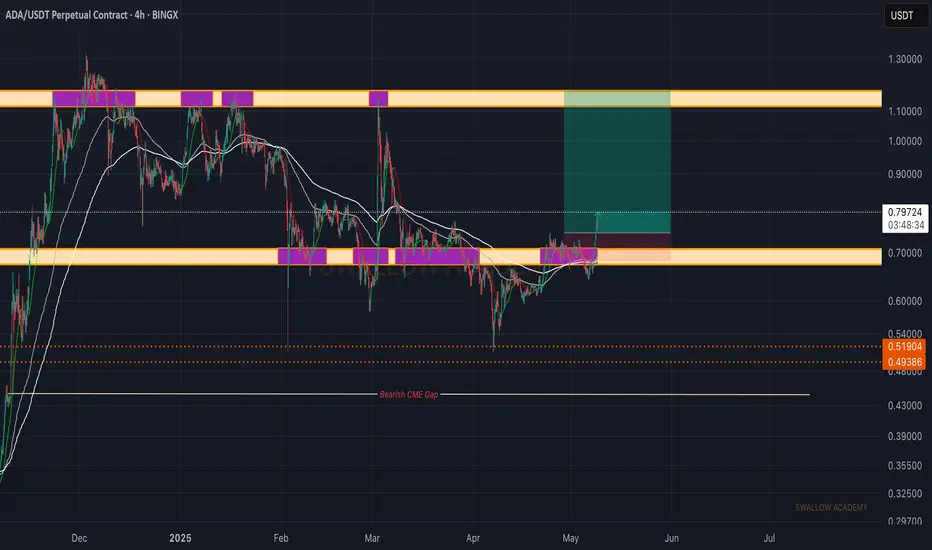
Cardano (ADA): Resistance at $1.11 Incoming | Bullish MovementCardano coin had failed retest and went back inside the sideways channel. As we are inside the channel again, we are looking now for upside movement here, which can send the ADA coin as high as $1.11 so this is where our target is sitting currently.
Swallow Academy
ADA Breakdown Ahead? Don’t Let This Bull Trap Fool YouYello Paradisers—are you ready for what could be a classic trap before a deeper drop? ADAUSDT is flashing multiple bearish signals that are difficult to ignore, and if you're not paying attention, this setup could catch you off guard.
💎ADAUSDT recently took a firm rejection from a key resistance zo

Buying CAN $ADA Now!❗️
CRYPTOCAP:ADA just broke out of a massive bullish flag pattern that has been forming since November 2024 — a strong technical signal indicating a potential major trend reversal.
📍 Current Price Zone: Retesting the breakout area as new support
🚀 Upside Targets:
T1: $0.7192
T2: $1.0490
T3: $1.4

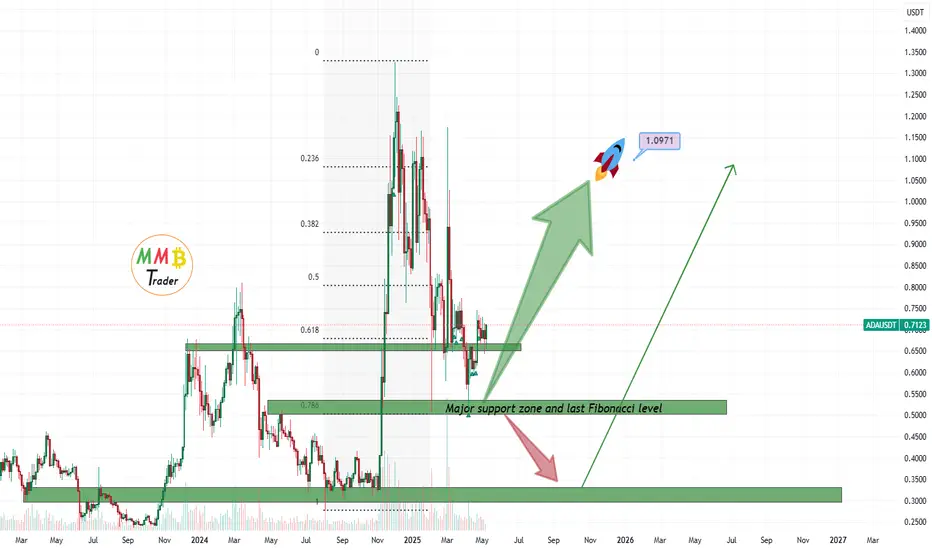
ADAUSDT soon above 1$ As we mentioned before price is near major daily supports like 0.5$ and 0.6$ and soon we are looking for more pump here to the first target which is 1.09$ and even more rise after that only if Bitcoin break the 100K$ and we have a valid breakout there.
DISCLAIMER: ((trade based on your own decision
See all ideas
Summarizing what the indicators are suggesting.
Oscillators
Neutral
SellBuy
Strong sellStrong buy
Strong sellSellNeutralBuyStrong buy
Oscillators
Neutral
SellBuy
Strong sellStrong buy
Strong sellSellNeutralBuyStrong buy
Summary
Neutral
SellBuy
Strong sellStrong buy
Strong sellSellNeutralBuyStrong buy
Summary
Neutral
SellBuy
Strong sellStrong buy
Strong sellSellNeutralBuyStrong buy
Summary
Neutral
SellBuy
Strong sellStrong buy
Strong sellSellNeutralBuyStrong buy
Moving Averages
Neutral
SellBuy
Strong sellStrong buy
Strong sellSellNeutralBuyStrong buy
Moving Averages
Neutral
SellBuy
Strong sellStrong buy
Strong sellSellNeutralBuyStrong buy
Displays a symbol's price movements over previous years to identify recurring trends.