ADA: Cardano Near Breakout: H&S Reversal Pattern in PlayADA: Cardano Near Breakout: H&S Reversal Pattern in Play
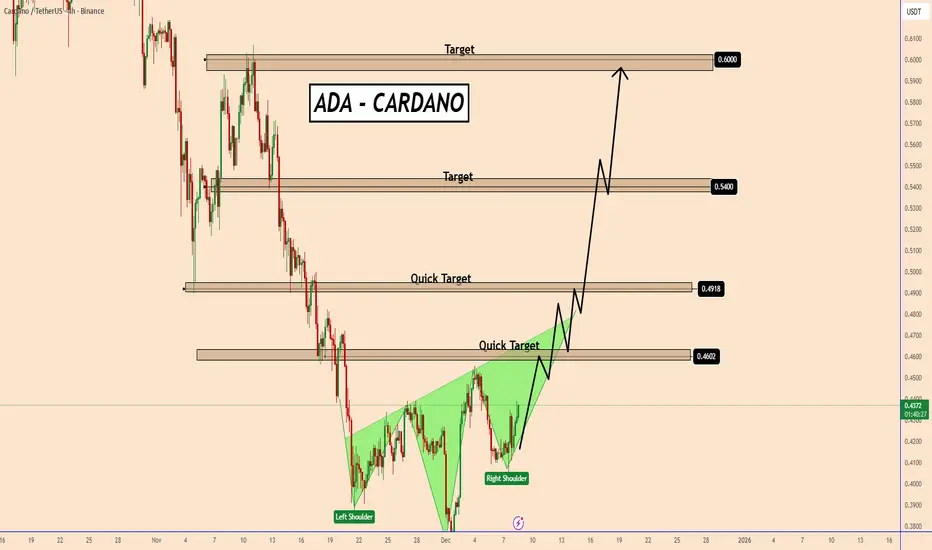
ADA is about to complete and reverse the Head and Shoulders pattern. The price is currently rising to test the neckline of the pattern, which is also the strongest area for buyers.
Once this area is broken, we can see ADA rising in a clear way, it could start an upward movement this time since it is also very oversold.
Targets:
0.46; 0.49; 0.54 and 0.6
You may find more details in the chart!
Thank you and Good Luck!
❤️PS: Please support with a like or comment if you find this analysis useful for your trading day❤️
Trade ideas
ADAUSDT → Correction (hunt for liquidity) before the fall BINANCE:ADAUSDT is pausing in the 0.41 area and entering a correction phase, during which it may test the zone of interest in a bearish market.
Bitcoin failed to overcome resistance at 92K, with economic data intensifying bearish pressure, resulting in another decline. The market is stagnant within the trading range, and any correction could quickly turn into a sharp decline...
ADA is forming a halt in the 0.41 zone and is entering a phase of local correction. The zone of interest is 0.426 - 0.434 (the area of local trend support breakdown). A retest of resistance may end in a false breakout...
Resistance levels: 0.421, 0.426, 0.434
Support levels: 0.409, 0.392
A false breakout of the resistance zone or a retest of the previously broken support of the uptrend may end in pressure from the bears. The correction may be followed by a continuation of the downtrend and the zone of 0.421 - 0.434
Best regards, R. Linda!

ADA: A Bullish SetupHey guys, ADA's testing some critical levels here at $0.4357 on the 4H timeframe.
Cardano's pushing right against the Bollinger Band upper boundary at $0.4364 after a solid rally from the $0.4106 low. The structure looks bullish - we've confirmed a higher low formation, price is holding above both EMA20 ($0.4254) and EMA50 ($0.4246), and ADX at 44.7 confirms we're in a legitimate trending environment rather than choppy consolidation. MACD just flipped bullish with a fresh crossover, adding momentum to the setup.
What caught my attention is the wick analysis showing 26.7% lower wick (strong buyer absorption) versus 65.1% upper wick (seller resistance at $0.4413). RSI at 66.8 gives us room to run before overbought territory, though Stochastic at 84.5 suggests we're getting stretched short-term. Volume's slightly below average which introduces caution - we'd ideally want expansion on the breakout attempt.
Key resistance sits at today's high of $0.4413, then psychological $0.4500 if we punch through. Support stacks at the EMA cluster around $0.4250 and BB middle at $0.4207. For entries, I'd prefer a slight pullback toward $0.4300-$0.4340 rather than chasing at current levels. Stop below $0.4190 (beneath EMA confluence) with targets at $0.4450 and $0.4550 sets up roughly 1:2.5 risk/reward.
The trend regime and bullish price structure tilt probabilities upward, but that upper wick rejection at $0.4413 means we need to see buyers step up with conviction. Watch how price reacts if we test the EMA20 support - a clean bounce there confirms continuation potential. How are you playing this move?

Cardano (ADA) UpdateADA is holding a key support zone after a clean reclaim of the range low. Momentum has shifted, but the market is still waiting for one thing: a clear CHoCH to confirm the trend reversal.
Price is compressing just under a high-volume node, and if buyers can flip this area into support, the next leg up opens quickly. Indicators are showing fresh upside momentum after multiple sweeps of liquidity below the range.
For now, it’s simple:
Hold the reclaim → Break structure → Trend shifts.
Lose the level and ADA slides back into the lower range.
Watching closely for that CHoCH confirmation.
What’s your bias here?

Cardano ADA price analysisIs a return to $2.70 realistic for CRYPTOCAP:ADA ?
The structure of OKX:ADAUSDT resembles OKX:ETCUSDT long-term behavior:
• A strong rally in 2020–2021
• A well-defined multi-year support zone that has repeatedly held
However, CRYPTOCAP:ADA ’s current market capitalization (~$16.5B) changes the equation.
A move back to $2.70 implies a valuation close to $100B, placing CRYPTOCAP:ADA in the same range as CRYPTOCAP:XRP , not CRYPTOCAP:ETC
#Cardano’s staking-based model aligns it more with CRYPTOCAP:ETH economic design than with PoW assets like CRYPTOCAP:BTC , CRYPTOCAP:LTC , CRYPTOCAP:ZEC etc. If network usage expands, price appreciation remains possible.
Key levels to watch:
• $0.60 — requires a confirmed breakout and hold
• Long-term outlook depends heavily on market recovery and ecosystem activity
Where do you position CRYPTOCAP:ADA ’s fair value in the next 6–12 months?
______________
◆ Follow us ❤️ for daily crypto insights & updates!
🚀 Don’t miss out on important market moves
🧠 DYOR | This is not financial advice, just thinking out loud

ADAUSDT the 0.6$ soon will hit againAs observed on the chart, ADA has executed a decisive breakout above a major resistance zone, confirmed by a strong bullish candle accompanied by significantly high trading volume. This combination of price action and volume indicates substantial buying pressure and validates the breakout's strength. Consequently, the technical structure now supports a continuation of the upward momentum, with the next primary target projected at the $0.60 level.
DISCLAIMER: ((trade based on your own decision))
<<press like👍 if you enjoy💚

Cardano (ADA): Trendline Breakout vs. The "Golden" Buy Zone 🚀 Cardano (ADA): Trendline Breakout vs. The "Golden" Buy Zone
Cardano ( CRYPTOCAP:ADA ) is currently compressing under a **major descending trendline**, squeezing price action into a pivotal decision point. As we approach the end of 2025, the market structure is revealing two distinct scenarios for traders.
We are watching two key areas of interest on the chart:
**1. The "Red Box" (Immediate Resistance & Breakout)**
Price is currently testing this descending resistance. A clean Daily Candle close above this trendline—and specifically clearing the "Red Box" supply zone—would confirm a structural Break of Structure (BOS).
**Strategy:** Aggressive traders can look for a "pilot buy" (small position) on the breakout, or wait for a retest of the trendline as support to add size.
**2. The "Yellow Zone" (Main Accumulation Area)**
If the breakout fails or we see a broader market correction, this lower zone represents the **high-probability institutional entry**. This area aligns with historical liquidity where smart money has previously defended the price.
**Strategy:** This is our **"Main Buy Zone."** If price wicks down here, we are looking to deploy larger capital for swing trades targeting the 2026 recovery.
**💡 Fundamental Catalysts (Why Now?)**
**Midnight Sidechain Launch:** The recent integration of the Midnight privacy chain (Dec 8, 2025) provides a fundamental tailwind that could fuel the breakout scenario.
**Treasury Growth:** The 70M ADA allocation for ecosystem infrastructure is a long-term bullish driver.
**🎯 Trade Setup Summary**
**Scenario A (Bullish Breakout):** Break trendline + Red Box → Buy small → Target $0.60+.
**Scenario B (Bearish Rejection):** Rejection at Red Box → Wait for Yellow Zone ($0.32-0.35 region) → **HEAVY BUY**.
**⚠️ Disclaimer:**
*This analysis is for educational purposes only. I am not a financial advisor. Trading cryptocurrencies involves high risk. Please do your own research (DYOR) before making any investment decisions.*
*Agree with this analysis? Drop a like and let me know in the comments if you are waiting for the Yellow Zone or buying the Breakout!* 🚀

ADAUSDT —Breakout: 0.4355–0.4150 Will Decide the Next Trend?ADA is approaching a critical phase after successfully breaking above a major descending trendline that has guided the market lower for weeks. This breakout signals a potential shift in momentum, but the bullish move is not confirmed yet. Everything now depends on how price reacts to the 0.4355–0.4150 demand zone, the yellow block on the chart.
This zone is not just a simple consolidation range; it is the area where buyers previously stepped in aggressively and prevented deeper downside. If price retests this zone and holds, the breakout gains strong validity and opens the door for a broader trend reversal.
The breakout has happened. The market will now decide whether this is the beginning of a larger bullish leg, or merely a relief bounce within the existing downtrend.
---
Bullish Scenario
The bullish case remains intact as long as ADA holds above the 0.4355–0.4150 zone. A clean retest followed by a strong bullish 8h close would confirm buyers are in control.
If bullish confirmation holds:
First target: 0.5200, a key pivot resistance
Break above 0.52 leads to the next level at 0.5925
Sustained momentum could push ADA into the 0.6800–0.7300 zone
A full extension points toward the 0.8750 supply area, the larger upside magnet
As long as the yellow zone holds, the bias remains bullish.
---
Bearish Scenario
The bearish outlook only activates if price convincingly breaks back below 0.4150, invalidating the breakout and signaling that sellers still dominate the trend.
If a breakdown occurs:
Initial downside target sits around 0.375–0.360, the previous structural lows
Losing this level opens the possibility of forming a new lower low
In short, bearish momentum returns only if the key demand zone fails.
---
Pattern & Market Structure
Clean breakout from a major descending trendline
Price currently testing the transition phase between downtrend continuation or higher-low formation
The 0.4355–0.4150 zone acts as the trend validation zone, the most critical area on the chart
This is the most important structural zone ADA has interacted with in weeks.
#ADA #Cardano #ADAUSDT #CryptoAnalysis #Breakout #DemandZone #TechnicalAnalysis #MarketStructure

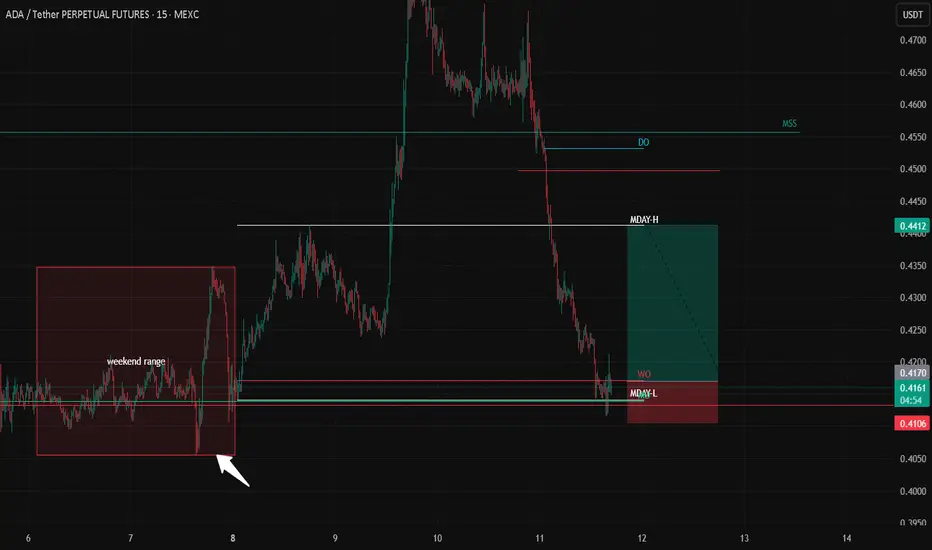
ADA Scalp long ideaScalp long setup
Taking a quick long based on a 5m MSS on Total Market Cap, showing a short-term momentum shift. Price also printed a clean V-shape recovery on the 5m, suggesting downside exhaustion and potential for a retrace toward intraday levels.
Risk-to-reward remains strong, with clear invalidation below the V-shape low.
Risk note: The weekend range hasn’t been taken yet, meaning weekend longs may still be targeted. This increases the risk of the setup — but the 5m MSS R:R is still compelling enough to consider the trade for me
That said, I’m not fully comfortable sharing this setup, given the weekend risk profile.
NFA
MrC
ADA Breaks the Downtrend, Momentum Is ShiftingADA is showing its first meaningful strength after weeks of downward pressure. Price has broken above the multi week descending trendline that has been acting as consistent resistance throughout the entire downtrend. This breakout indicates a potential shift in momentum, especially as the daily candle is pushing firmly beyond the trendline with increased volatility.
If the daily close confirms above this structure, ADA could be entering a recovery phase, where the market may start targeting higher levels. The first major resistance zone sits between 0.50 and 0.55, an area that previously triggered strong reactions. A clean break above that region would further strengthen the bullish structure and open the path toward the next key levels on the chart.
For now, market participants should keep an eye on the daily close and how price reacts around the trendline retest. Holding above this level will be an important signal for continuation and for a potential momentum shift after a prolonged period of weakness.

Cardano (ADA): Looking For Successful Re-Test | BullishADA finally showed a proper shift after that liquidity sweep/failed breakdown at the lows. Buyers stepped in fast and pushed the price back above the neckline, which is the first solid sign of strength after weeks of straight downside.
Right now we’re watching how price reacts around this neckline retest. If buyers manage to secure it and keep holding above it, we’ll have a clean setup to target the higher zone shown on the chart.
No need to rush—the breakout happened, but the entry comes only after buyers confirm control.
Swallow Academy

ADAUSDT 12H#ADA has broken above the descending resistance and the SMA50 on the 12H timeframe chart. In case of a breakout above the Ichimoku cloud, the potential targets are:
🎯 $0.5414
🎯 $0.5941
🎯 $0.6468
🎯 $0.7219
🎯 $0.8175
⚠️ Always remember to use a tight stop-loss and maintain proper risk management.

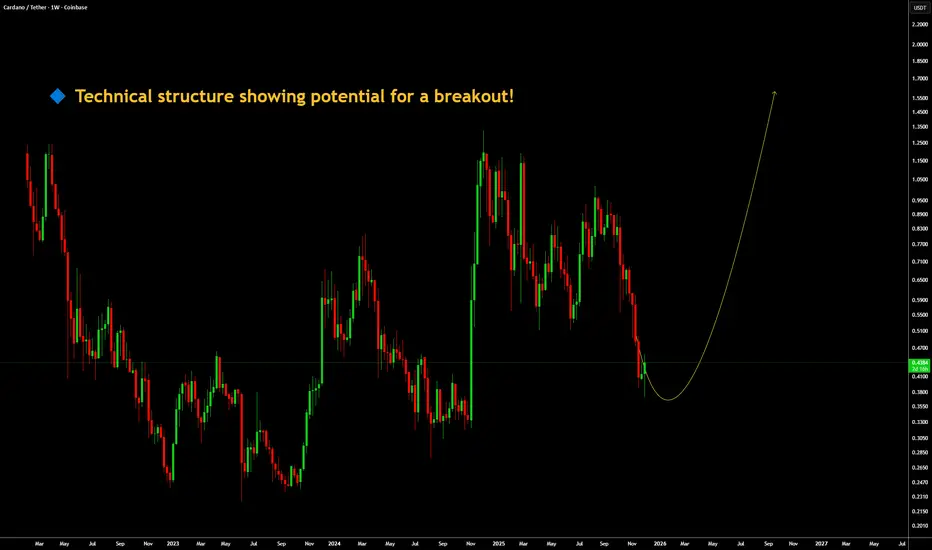
ADAUSDT - Technical structure showing potential for a breakoutWith COINBASE:BTCUSD and COINBASE:ETHUSD maintaining strong bullish structure and the broader crypto market showing renewed risk-on sentiment, COINBASE:ADAUSDT is positioned for a potential continuation to the upside from technical point of view and trend continuation setup.
Crypto markets historically perform well when liquidity conditions improve, and with the FED officially ending Quantitative Tightening (QT) and a rising probability of rate cuts, the macro environment is turning supportive for digital assets.
On top of that, ADA’s ecosystem growth, rising network activity, and strong technical structure suggest that ADAUSDT may be preparing for a high-probability move up.
Based on these combined factors, we expect ADAUSDT to push up and potentially target new short-term highs if momentum continues.
Always remember WTW 4 Golder Rules:
1) Do not jump in
2) Do not over risk/trade
3) Do not trade without Stop Loss
4) Never ever add to a losing position!
Trade with care
We Trade Waves
WTW Team
Disclosure: We are part of Trade Nation's Influencer program and receive a monthly fee for using their TradingView charts in our analysis.
Ada 400% pump to R3Last 2 days we had a proper bear trap below support, but now we are flying above, and looking to push towards new highs.
I believe this is the beginning of something special for crypto but mostly ADA, im a big fan! Things are looking great for a beautiful bottom.
Together with the diamond bottom pattern on another chart, Im looking for R3 TO BE ONLY THE BEGINNING of this beautiful new Bull Run ❤️

Weekly ADA Analysis – Long-Legged Doji After a DowntrendLast week, ADA has formed a Long-Legged Doji on the weekly timeframe.
This candle appears after a clear downtrend, which usually indicates strong market indecision and a potential shift in momentum.
A long-legged doji shows that both buyers and sellers tried to take control, but neither succeeded, ending the week near the opening price. This often signals that the bearish pressure is weakening.
What to watch next:
A bullish confirmation candle next week (such as a bullish engulfing, marubozu, or a strong full-body green candle) would increase the probability of a trend reversal to the upside.
Until confirmation appears, the setup remains neutral—but leaning toward a potential bullish reversal.
My Opinion:
ADA is ready to fly , and please do not take this as trading advice.

SPOT ADA LONG 3.12.2025📈 SPOT
ADA
Pinning after abnormal purchases.
💰I enter at the market price.
I'll let you know when I record it manually.
‼️Risk per trade: 2% of the allocated funds for spot trading.
Thank you!

ADA Preparing a Reversal ZoneADA is moving inside a clear falling channel while gradually approaching a cluster of strong demand levels. The structure has been trending downward for weeks, but the recent behaviour shows early signs of exhaustion from sellers.
Price is now sitting near the lower boundary of the channel while the RSI forms a descending trend that is starting to flatten. This combination often appears during the early stages of a trend shift, especially when price approaches major support.
A sweep toward the lower demand bands remains possible before any solid recovery attempt. However, as long as ADA holds inside or near this zone, the probability of a reaction becomes higher.
Key points
• The falling channel remains intact and is the main structure to watch
• Multiple demand layers between 0.29 and 0.35 are acting as a support cluster
• Momentum indicators show decreasing selling pressure
• A reclaim of the mid channel can trigger the next impulsive move
• A deeper liquidity sweep is possible before the reversal
Invalidation
If ADA loses the 0.29 region with momentum, this idea becomes invalid and lower continuation might follow.
In simple terms
ADA is sitting on a major support cluster and weakening sellers can be seen on both price and momentum. As long as the 0.29 to 0.33 zone is protected, the market can create a reversal structure. A break above the channel mid line can be the start of the next wave.

Charles Hoskinson do something. When BTC reaches 100k, ADA has a probability of retesting the 0.70 level. However, the more realistic scenario for me is a move toward the 0.50–0.53 zone before rejecting lower.
Even in a worst-case outlook, ADA is likely to hover around the trend line and form a small, prolonged range.
The green zone in the chart represents the long-term trend-line support, which has held the price for a significant period of time.
Since I believe the crypto bear market has already begun, there’s no point in expecting the same explosive moves we saw in previous cycles.
With global economic uncertainty, war, and rising geopolitical tensions, precious metals have once again proven themselves as real safe-haven assets.
As for ADA, it looks like only the true long-term hodlers remain. Who knows, if major positive news drops, it could rocket.
But as for me, I remain seriously bearish on this market.

ADA : LIVE TRADE
Hello friends
According to the channel in which the price is located, you can see that every time it reached support, we had a growth, and now that it has reached the same support, we can expect another growth.
This analysis is purely technically reviewed and is not a buy or sell recommendation, so do not act emotionally and observe risk and capital management.
*Trade safely with us*

ADAUSDT – Move Down Before FOMC?Alright traders, today is FOMC day,
which means the market is going to do its usual thing:
act weird, confuse everyone, and ignore all technicals. 😂
But before the chaos at 20:00?
We’ll probably see a slight move down —
a little dip, a little liquidity grab,
just the usual pre-FOMC warm-up routine.
Nothing guaranteed (it’s ADA, after all),
but the idea is simple:
👉 small push down
👉 then wait for FOMC fireworks
👉 try not to get rekt in between 😅
Let’s see how it plays out — stay safe, legends! 🚀📉🔥

Improved SMC Analysis for ADAUSDTBearish Order Block (OB):
Price has returned to a previously unmitigated bearish order block between 0.4421 – 0.4386.
This zone represents the last bullish candle before the strong displacement down, making it a high-probability reversal area.
Entry Reasoning:
Entry is placed at 0.4387, right at the base of the OB, where institutions typically engineer liquidity grabs before continuing the trend.
This level aligns with the price fluctuation zone, showing signs of weak buyer reaction and potential redistribution.
Market Structure:
Overall structure remains bearish with continuous lower highs and lower lows.
The recent consolidation below the imbalance/DM level suggests the market is preparing for another expansion leg downward.
Target & Risk Management:
Take Profit (TP): 0.4315 → This targets the next liquidity pocket and aligns with the nearest sell-side liquidity zone.
Stop Loss (SL): 0.4423 → Above the OB’s premium boundary, where invalidation occurs if price breaks structure.
SMC View:
This setup follows classic Smart Money Concepts:
Price returns to premium zone
Mitigates the unfilled OB
Grabs liquidity
Prepares for bearish continuation
If the OB holds, we should see a clean move toward the downside liquidity levels.

Cardano: Jump the Ghost Ship — It's Running Out of Ghosts!Fun di Mental:
ADA isn’t just breaking down on the chart — it’s breaking down everywhere.
The death cross on the daily isn’t a signal anymore; it’s a eulogy. Price slippery under key supports because there’s simply no bid left; no more greater fools. Liquidity is thin, volume is fading, and the only thing rising is the number of people pretending they “were never really into Cardano anyway.”
Cardano was always called a ghost chain, but now it has the metrics to prove it. Active addresses collapsed, DeFi TVL drained out, and the network’s economic engine is stalling so badly that SPOs are on the edge of shutting down because the rewards don’t justify the cost. When your validator base is contemplating mass rage-quitting, the trend isn’t your friend.
On November 21, 2025, Cardano suffered a “chain split”: a single malformed delegation transaction exploited a long-existing (Peer reviewed??) bug in the node software and resulted in part of the network accepting a “poisoned” ledger while the rest stayed on the “healthy” chain. That split caused block production to slow or pause for over an hour. Some exchanges and wallets temporarily halted ADA deposits/withdrawals.
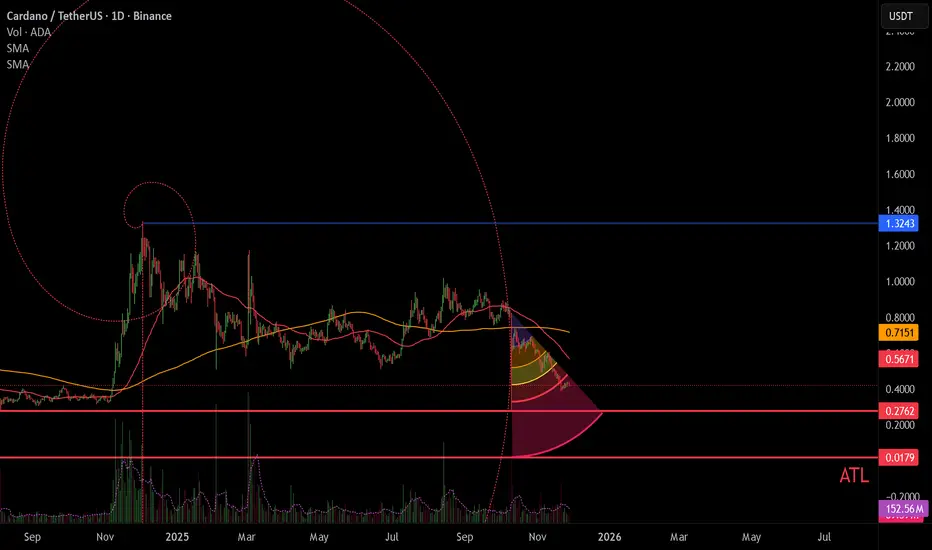
Technical:
ADA is in a confirmed macro downtrend — lower highs, lower lows, and a death cross already printed (50D < 200D). This is the classic “lights-out” pattern for L1s entering terminal decline.
Moving Averages:
ADA basically front-ran its own death cross — the price nuked before the bearish crossover even printed.
The long-term SMA around $0.71 is now a ceiling of doom — a structural reminder of how far ADA has fallen and how far buyers have abandoned the asset.
Key Levels:
$0.576 – First major supply wall; not relevant unless ADA resurrects from the dead.
$0.276 – The next real destination. A high-probability magnet.
$0.017 (ATL) – Worst Case: The historical bottom (probably late 2026 - Early 2027).
Fibonacci Spiral: ADA is pressed against the inner curvature — a classic “collapse spiral.”
Fibonacci Speed Resistance Fan: Price is pinned under the steepest bands, confirming relentless seller control. Every bounce has been slapped down instantly.
Volume & Momentum:
Volume is anemic. Momentum candles are heavy red, with ADA showing the classic “ghost fade” — slow, steady suffocation with no bid support.
Outlook:
Structure points straight to $0.276 first, with the ATL absolutely on the table if fundamentals keep rotting.
Always-Sunny Sometimes-Blockchain Visionary, Charles Hoskinson
Meanwhile, Charles Hoskinson is busy building Midnight, a brand-new chain that just so happens to… replace most of what Cardano was supposed to become. When the founder starts eyeing the emergency exit, you don’t need on-chain analytics to know the vibz are B as F.
DeGRAM | ADAUSD is testing the $0.4 level📊 Technical Analysis
● ADA/USD is testing the main long-term support zone after an extended decline, with repeated touches of the primary support line indicating exhaustion of bearish momentum.
● The pair is forming a falling-wedge–style compression toward resistance near 0.52–0.55, suggesting the potential for a bullish rebound if the 0.40–0.42 base continues to hold.
💡 Fundamental Analysis
● Market sentiment is stabilizing as altcoins see renewed accumulation and Cardano activity improves ahead of upcoming ecosystem upgrades.
✨ Summary
● Bullish bias above 0.42. Targets: 0.50 → 0.55. Support: 0.40.
-------------------
Share your opinion in the comments and support the idea with a like. Thanks for your support!
