HolderStat┆ADAUSD kept the $0.7 levelCRYPTOCAP:ADA reversed a three-month slide with a textbook falling-wedge breakout and now oscillates inside a tightening flag above the 0.72 USDT backbone. Bulls guard successive higher lows along that trend beam; maintain it and the pattern’s target aligns with the 0.90-0.95 supply cap highlighted overhead. A dip toward 0.68 would simply revisit wedge support before any larger drive.
ADAUSDT.P trade ideas

ADAUSDT , 1HrPattern is looking Good , If BTC is Sustaining Above 1,06,834 this level then , This ADA pattern will Give a Good Breakout ,
Enter only When Upper Trendline is Breakout
Take Your Own Risk According to your Capital .
Follow for More Ideas Like This

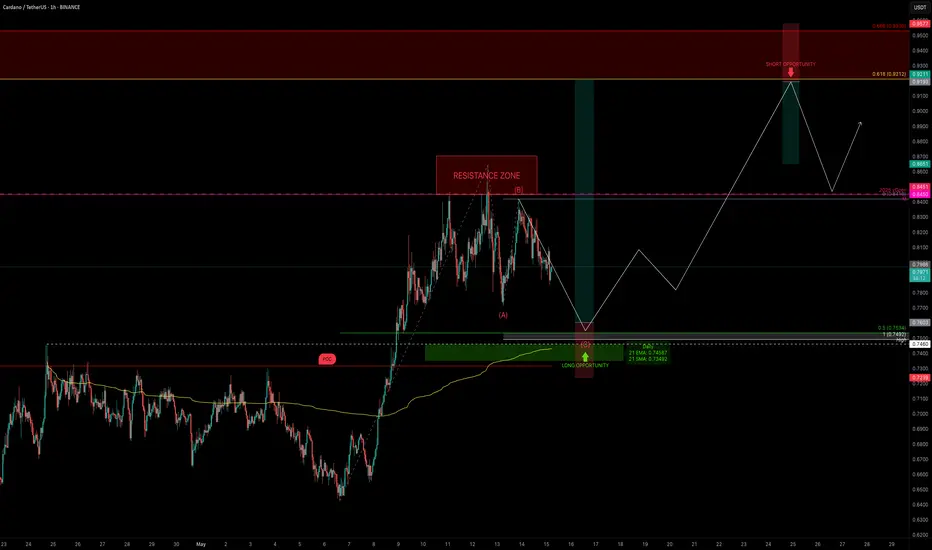
ADA Correction Nearing Completion — Trade It Like a ProADA is respecting structure beautifully and currently consolidating after completing a 5-wave impulse move. The key question now is: where are the next high-probability trade setups?
Let’s break it down step by step.
Market Structure & Elliott Context
ADA has completed a full 5-wave bullish sequence, and—as expected—is now in a correction phase. This appears to be forming a classic ABC correction.
Using the Fibonacci retracement tool:
0.5 retracement of the entire move sits at → $0.7534
This aligns perfectly with the previous swing high at $0.746 — a level that has yet to be retested
The 1:1 trend-based Fib extension of a potential ABC correction puts Wave C at → $0.7492
Confluence Check:
This entire support zone (~$0.75) is stacked with technical alignment:
✅ Previous swing high: $0.746
✅ 0.5 Fib retracement: $0.7534
✅ 1:1 extension: $0.7492
✅ Daily 21 EMA: $0.7455
✅ Daily 21 SMA: $0.7347
✅ Point of Control (POC): ~$0.7318
✅ Anchored VWAP: Also sitting in this zone
✅ Pitchfork golden pocket: Aligns as dynamic support
All of these support indicators point to one thing: this ~$0.75 zone is a high-probability long entry area.
🟢 Long Setup
Entry zone: Ladder between $0.77 – $0.75
Average entry: ~$0.76
Stop-loss: Below $0.7318 (under POC)
Target: $0.9212 (0.618 retracement of the recent down wave)
R:R: ~5:1
Potential upside: +22%
🔴 Short Setup (on Rejection Only)
Entry: $0.9212 (0.618 Fib retracement of downtrend)
Stop-loss: Above 0.666 Fib → ~$0.958
Target: previous swing high or yearly open
R:R: ~1.4:1 (it can be adjusted tighter upon confirmation)
This short setup isn’t ideal in terms of R:R unless we see clear rejection. But with confirmation — like an SFP, bearish engulfing, or divergence — the stop can be tightened, making the risk-to-reward much more favourable.
📘 Educational Insight: Why Structure Beats Emotion
In trading, the strongest setups occur where multiple tools converge—Fib levels, EMAs, VWAP, volume zones, and past price action. When these align, it’s not about guessing—it’s about preparing.
The key is to wait for structure to come to you, not the other way around. Patience allows clarity. Clarity allows precision. And precision pays.
💡 Final Thoughts
The plan is clear. Levels are set. Now it’s just observation and discipline.
Good trades don’t chase attention — they present themselves to those who wait.
___________________________________
If you found this helpful, leave a like and comment below! Got requests for the next technical analysis? Let me know.
ADA/USDT: Bullish Move Ahead ? (READ THE CAPTION)By examining the #Cardano chart on the 3-day timeframe, we can see that the price is currently trading around $0.80. If it holds above $0.71, we can expect more upside. The expected return for Cardano is around 30% in the short term, 47% in the medium term, and 85% in the long term.
Please support me with your likes and comments to motivate me to share more analysis with you and share your opinion about the possible trend of this chart with me !
Best Regards , Arman Shaban

Be prepared for everything...Hello dears
Given the recent growth, the price is stuck in a range and now that it has reached the bottom of the range, there are two options:
1_The price grows from here and hits our target.
2_The price continues to fall and falls to the support area below and our second buying step is activated and grows from there.
Buy a step and be ready for anything.
*Trade safely with us*

#ADA/USDT#ADA
The price is moving within a descending channel on the 1-hour frame, adhering well to it, and is heading for a strong breakout and retest.
We are seeing a bounce from the lower boundary of the descending channel, which is support at 0.7025.
We have a downtrend on the RSI indicator that is about to break and retest, supporting the upward trend.
We are looking for stability above the 100 moving average.
Entry price: 0.7045
First target: 0.7364
Second target: 0.7584
Third target: 0.7884

ADAUSDT WeeklyLet's see the chart on higher timeframes a bit also for once. Let us examine the bigger levels and bigger picture.

HolderStat┆ADAUSD trend support in focusCRYPTOCAP:ADA slid from 0.84 into the long-standing 0.72 up-trend that has anchored every rally since April. Regaining 0.78 re-targets 0.88-0.92 and eventually the 1.00 psyche level, while a daily close beneath 0.70 warns of a deeper probe toward 0.64. 🌟

Strong bullish trendAs i predicted in last idea it started a strong bullish trend, please follow to see more analysis.

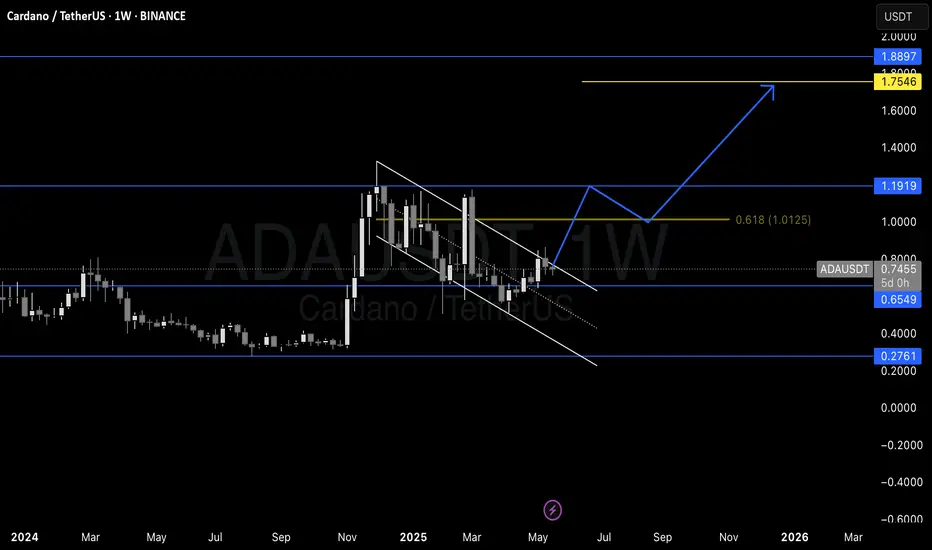
ADA Bull Flag Pattern - Weekly ADA has broken out of the weekly bull flag pattern, signaling a potential continuation of the prior uptrend. The measured move projects a price target near 1.75, following a likely retest of the 1.01 level as new support. Momentum remains bullish as long as price holds above the breakout zone.
ADA (Cardano) – Long Swing Setup from Major Support ZoneADA is currently trading within a critical support area ($0.71–$0.73), offering a compelling higher low opportunity. With BTC holding strength, ADA may be gearing up for a rebound, particularly if it maintains structure above the support.
🔹 Entry Zone:
$0.71 – $0.73
🎯 Take Profit Targets:
🥇 $0.80 – $0.84
🥈 $0.98 – $1.02
🛑 Stop Loss:
Daily close below $0.66 (loss of higher low and structural invalidation)

Just my random thoughts about ADA Cardano- Multiple breakout patterns (bullish breakouts after consolidation),
- Horizontal support levels (especially around $0.60),
- A projected bullish move to potentially $1.40–1.50 range.
might it be another leg up?
I still have a hope for ADA despite all its cons

Strong possibility for strong bullish trend 15m tf.According to macds in 15m and 1h tf. There is a possibility for strong bullish trend.

Lingrid | ADAUSDT Bullish Pattern Continuation from SUPPORTBINANCE:ADAUSDT is pulling back after forming a local top near the $0.81 resistance. Price is now drifting toward a confluence support zone around $0.70–0.71, where the upward trendline meets previous breakout levels. If buyers step in here, a rebound could propel price back toward the upper range at $0.81. Holding above this support keeps the bullish channel structure intact.
📈 Key Levels
Buy zone: 0.7000 – 0.7088
Buy trigger: bullish reaction from channel support
Target: 0.8100
Sell trigger: break below 0.7000
💡 Risks
BTC volatility could drag alts lower.
Break below the trendline may signal broader weakness.
Low trading volume near support could cause false breakouts.
Traders, if you liked this idea or if you have your own opinion about it, write in the comments. I will be glad 👩💻

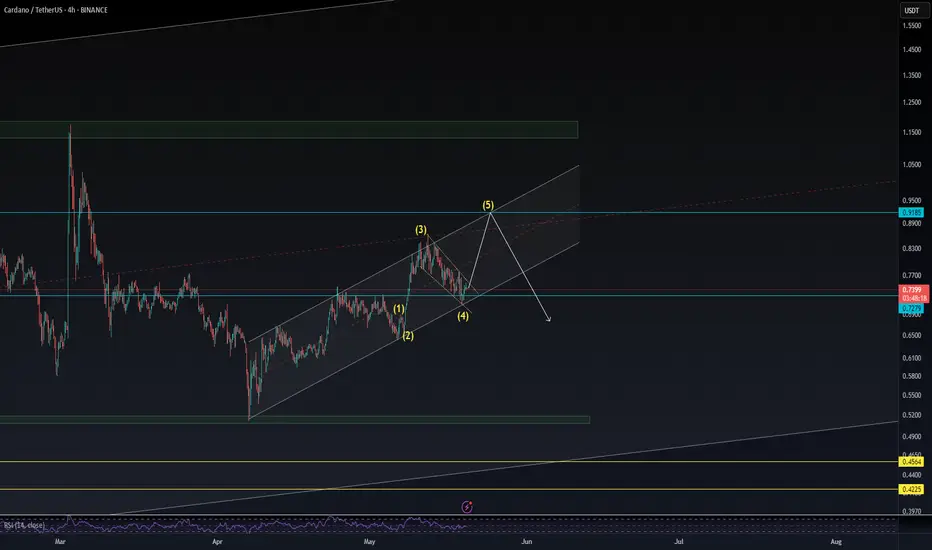
ADAUSDT🔹 Cardano (ADA) Technical Analysis
📅 Date: May 19, 2025
Cardano is currently moving within a medium-term ascending channel. After the second touch of the channel’s lower boundary, the price initiated a 5-wave impulsive structure. Wave 4 has retraced precisely 0.618 of waves 1 through 3 and coincides with the bottom of the channel — a zone that also reflects a Change of Polarity, where former resistance is now acting as solid support.
Currently, wave 5 is developing, but the bullish momentum appears weaker compared to the preceding bearish leg — a possible indication of buyer exhaustion. Interestingly, the projected end of wave 5 aligns with the 0.618 retracement level of the prior decline and overlaps with the Pivot Point R2 zone, which could serve as a strong resistance area.
Based on this setup — and with strict risk management in place — I’ve entered a long position with the stop-loss placed just below the tip of wave 1. Cardano remains one of my preferred crypto assets, and this pattern may offer a promising bullish continuation opportunity.
📈 Disclaimer: This analysis is for educational purposes only and does not constitute financial advice.
ADAUSDT | Two-Tier Long StrategyAfter a period of quiet accumulation, ADAUSDT maybe a good choice after the manipulation of orange box. This presents a near-term opportunity for those seeking quick entries:
Short-Term Longs
Wait for a liquidity cleaning of the orange box first. Below that level you can look for 4h upward breakout and enter with retest. This signals that buyers are stepping in decisively and can fuel a retracement or trend resumption.
For investors with a multi-year horizon, the deep blue box at the chart’s base represents a true margin-of-safety zone:
Long-Term Accumulation
Placing staggered buy orders within the blue box, and scaling in as price holds, aligns with a value-based approach. If ADAUSDT respects this area over time, disciplined accumulation here could yield life-changing returns years down the road.
In both cases, rely solely on real volume footprint confirmations, never on guesswork. By trading these zones with patience and strict risk control, you tap into where genuine demand resides and strict risk control, you tap into where genuine demand resides and let market behavior guide your entries.
📌I keep my charts clean and simple because I believe clarity leads to better decisions.
📌My approach is built on years of experience and a solid track record. I don’t claim to know it all but I’m confident in my ability to spot high-probability setups.
📌If you would like to learn how to use the heatmap, cumulative volume delta and volume footprint techniques that I use below to determine very accurate demand regions, you can send me a private message. I help anyone who wants it completely free of charge.
🔑I have a long list of my proven technique below:
🎯 ZENUSDT.P: Patience & Profitability | %230 Reaction from the Sniper Entry
🐶 DOGEUSDT.P: Next Move
🎨 RENDERUSDT.P: Opportunity of the Month
💎 ETHUSDT.P: Where to Retrace
🟢 BNBUSDT.P: Potential Surge
📊 BTC Dominance: Reaction Zone
🌊 WAVESUSDT.P: Demand Zone Potential
🟣 UNIUSDT.P: Long-Term Trade
🔵 XRPUSDT.P: Entry Zones
🔗 LINKUSDT.P: Follow The River
📈 BTCUSDT.P: Two Key Demand Zones
🟩 POLUSDT: Bullish Momentum
🌟 PENDLEUSDT.P: Where Opportunity Meets Precision
🔥 BTCUSDT.P: Liquidation of Highly Leveraged Longs
🌊 SOLUSDT.P: SOL's Dip - Your Opportunity
🐸 1000PEPEUSDT.P: Prime Bounce Zone Unlocked
🚀 ETHUSDT.P: Set to Explode - Don't Miss This Game Changer
🤖 IQUSDT: Smart Plan
⚡️ PONDUSDT: A Trade Not Taken Is Better Than a Losing One
💼 STMXUSDT: 2 Buying Areas
🐢 TURBOUSDT: Buy Zones and Buyer Presence
🌍 ICPUSDT.P: Massive Upside Potential | Check the Trade Update For Seeing Results
🟠 IDEXUSDT: Spot Buy Area | %26 Profit if You Trade with MSB
📌 USUALUSDT: Buyers Are Active + %70 Profit in Total
🌟 FORTHUSDT: Sniper Entry +%26 Reaction
🐳 QKCUSDT: Sniper Entry +%57 Reaction
📊 BTC.D: Retest of Key Area Highly Likely
📊 XNOUSDT %80 Reaction with a Simple Blue Box!
📊 BELUSDT Amazing %120 Reaction!
📊 Simple Red Box, Extraordinary Results
I stopped adding to the list because it's kinda tiring to add 5-10 charts in every move but you can check my profile and see that it goes on..

ADA bulling :)📈 ADA/USDT 4H Analysis
ADA has broken above the 0.7408 resistance, now at 0.78150, showing strong bullish momentum within an ascending channel, targeting higher levels if the trend holds.
🟢 Support Levels:
🔹 0.7220 – recent breakout zone (20/50 EMA)
🔹 0.6630 – key support
🔹 0.6230 – deeper support
[ *]🔴 Resistance Levels:
🔹 0.8430 – next target
🔹 0.9670 – major resistance zone

HolderStat┆ADAUSD wedge exit sets sights on 0.95-1.00CRYPTOCAP:ADA cracked its descending wedge in early May and quickly reclaimed the 0.78-0.80 consolidation shelf. Price is now travelling inside an embryonic ascending channel that intersects long-term support at 0.76. Holding above that floor leaves room for an advance into the 0.90-0.95 resistance box, with the upper rail flirting with the psychological 1 USDT mark. Failure to defend 0.74 would postpone—but not invalidate—the bullish blueprint.

Cardano's Breakout: The Start of a 300% Bull Run?The ADA/USDT trading pair has recently demonstrated promising technical developments on the weekly timeframe, which suggest the potential for a medium- to long-term bullish reversal.
Trendline Breakout and Reversal Implications
The most visually prominent feature on the chart is a well-defined descending trendline that spans several months, capturing a sequence of lower highs since late 2024. This trendline reflects the bearish sentiment that had prevailed in the market during this period. However, recent price action shows a clean breakout above this trendline, which is a significant technical event. Breakouts from descending trendlines are often seen as early signs of a trend reversal, especially when confirmed with rising volume and price stability above the broken resistance.
The breakout aligns with a shift in market sentiment and is further supported by other bullish signals, providing a technical foundation for a potential long setup.
Double Bottom Formation and Support Zone
Another key structural pattern identified on the chart is the double bottom, highlighted by two yellow circles indicating price troughs that formed around the $0.55–$0.60 zone. This classic reversal pattern is formed when the price tests a key support area twice without breaking below it, suggesting that buyers are stepping in consistently to defend this level.
The double bottom gains additional significance due to its location directly above a major horizontal support zone. This support range, shaded in grey, lies between $0.5464 and $0.6000. The price's repeated respect for this zone confirms its strength, increasing the reliability of the reversal pattern forming above it.
EMA and Momentum Shift
The chart includes the Exponential Moving Average (EMA), currently plotted at $0.6312. The EMA serves as a dynamic indicator of market momentum. The fact that the current price action is developing above the EMA further strengthens the bullish bias. When price sustains above the EMA on a higher timeframe such as the weekly chart, it often signifies a transition from bearish to bullish momentum.
Trade Setup and Risk-Reward Projection
Based on the chart’s structure, a hypothetical long trade is plotted, with an entry near the $0.72–$0.80 range—just above the breakout zone and below recent candle bodies. The stop-loss is conservatively placed beneath the lower boundary of the support zone, around $0.5000, which also accounts for potential volatility. This placement helps to mitigate downside risk in case of a failed breakout or false signal.
The target for this setup is ambitiously set at approximately $2.90, yielding a projected gain of around 300.52%. This target corresponds to a prior price zone from earlier bullish cycles and aligns with potential Fibonacci extension levels and historical resistance. While the reward is substantial, the wide range suggests this is a medium- to long-term trade idea rather than a short-term opportunity.
Final Remarks
The ADA/USDT weekly chart presents a technically compelling case for a bullish reversal. The breakout from a descending trendline, in conjunction with a double bottom formation above strong support and a favorable alignment above the EMA, offers a high-probability setup for a potential long position. Although the cryptocurrency market remains inherently volatile, the current structure supports a favorable risk-to-reward ratio for long-term traders and investors. As always, disciplined risk management—through appropriate position sizing and stop-loss placement—is critical to navigating such trades effectively.

ADA/USDT – In a strategic zone: Rebound or false hope? H4 VisionThe price experienced a bullish impulse, followed by a correction that returned to a former resistance level that became support.
🔁 This area also corresponds to the Fibonacci golden zone, which increases the likelihood of a rebound, at least technically.
🎯 Possible scenarios:
1️⃣ Start gradually accumulating in this zone
2️⃣ Wait for the ROB to break for confirmation
3️⃣ Confirm an EMA 7 / SMA 20 crossover for greater probability
📉 Stop Loss: below the SMA 200 H4 (or according to your money management)
🎯 Objective: return to the last high
⚠️ This analysis is purely educational – this is not investment advice.
💬 What's your opinion? Are you accumulating or are you still waiting?

ADA copy pasting movementNote: the numbers are just for labelling. They aren't actual wave counts.
ADA is replicating a 4H movement that led to a big upwards movement. Right now it looks identical. The only difference (in a good way) is that we are using the last resistance as support and that also coincides with the bottom of the bull market support band.
If BTC keeps ranging I totally expect this to play out again.
*Getting bullish thoughts*

"ADA - Time to buy again!" (Update)So if you pay attention to the ADA chart you can see that the price has formed a Ascending FLAG or wedge which means it is expected to price move as equal as the measured price movement.( AB=CD )
NOTE: wait for break of the FLAG .
Give me some energy !!
✨We spend hours finding potential opportunities and writing useful ideas, we would be happy if you support us.
Best regards CobraVanguard.💚
_ _ _ _ __ _ _ _ _ _ _ _ _ _ _ _ _ _ _ _ _ _ _ _ _ _ _ _ _ _ _ _
✅Thank you, and for more ideas, hit ❤️Like❤️ and 🌟Follow🌟!
⚠️Things can change...
The markets are always changing and even with all these signals, the market changes tend to be strong and fast!!

ADAUSDT IDEAI think chart looks pretty clear now. Red supply area properly laid down. Along with price properly taking buys from demand area in blue with higher lows. So obvious path will be the movement above supply till next supply (red area). Remember the supply is selling area (no retest concept) so strong selling could also originates. so trades are only after breaking out with clear price marching above supply zones.
