Cardano Bullish · Remember The Bigger Picture (Long-Term Growth)Remember the bigger picture, Cardano is growing.
Good afternoon my fellow Cryptocurrency trader, I hope you are having a wonderful day.
The rise started in June and so far we have only a very small wave. If you look back at November 2024 you can see how much growth was produced in just four candles, really strong.
The fact that this move started fast and had too much force, also meant an early demise and this led to a correction. The new wave started in June and four weeks green is only a small advance. After these four weeks green in early July we have two red weeks followed by additional growth.
Now we have a total of 9 candles since the June low. Compare this to the November 2024 wave, it had 5 candles total, the entire move. Here comes the alternation.
The previous wave was short in duration, fast and steep. The current wave will be long in duration and take its time to develop. Cardano has been rising not since June 2025 nor August 2024 but since June 2023, a very strong and prolonged bullish cycle. We are only missing a bull run phase. The market is in no hurry though, it can produce a bull run phase in two months just as it can do it in six months. We will know better as the bull market unravels.
Last week ADAUSDT produced the highest volume since last year on a single session. This is pretty good and interesting. This volume comes up after the move is already a month old. The volume is higher than normal but not super high. This tells us that whatever is happening now is only the start of something bigger.
Cardano will continue growing is the message coming from this chart. Cardano has so much more to give. How will it all develop? I don't know. But I can tell you that Crypto will continue to grow, the charts are saying long-term... We will see how it goes.
Namaste.
ADAUSDT trade ideas
ADA/USDT : Heavy Pullback Expected Before Major Price Surge📊 Pattern Overview
Cardano is shaping a classic contracting triangle on the daily timeframe, with all legs unfolding as 3-wave zigzags, fully compliant with NeoWave rules.
• Wave A: $1.33 → $0.51 (zigzag decline)
• Wave B: $0.51 → $1.18 (zigzag rally, ~82% retrace of A)
• Wave C: $1.18 → $0.52 (zigzag decline, ~99% retrace of B)
• Wave D: $0.52 → $0.92 (zigzag rally, ~61% retrace of C, currently in progress)
• Wave E: Expected $0.92 → $0.51 (projected zigzag, targeting channel support)
This setup aligns with a contracting triangle, with converging trendlines projecting an apex around November 2025.
⸻
📉 Near-Term Expectation
• Wave E is anticipated to pull ADA back toward $0.51 (long-term channel support).
• This would complete the triangle and set the stage for a powerful bullish thrust.
⸻
🚀 Post-Triangle Outlook
• A bullish breakout from the triangle could target:
• $1.5 (TP1)
• $1.8 (TP2)
• This aligns with NeoWave projections of a 75–125% thrust of the channel width.
• Break of $0.92 (BOS) will be the confirmation trigger for the rally.
⸻
🎯 Trading Plan
• Entry: Wait for pullback to ~$0.51 (Wave E completion) and BOS confirmation.
• Targets: $1.5 – $1.8
• Stop Loss: Below $0.45
• Risk Management: 1–2% capital per trade, trail stops above $1.0 once thrust begins.
⸻
⚠️ Key Levels
• Support: $0.51 (channel bottom)
• Resistance: $1.0, then $1.5–$1.8
• Invalidation: Break below $0.45
⸻
✅ Summary: Patience is key. A final pullback toward $0.51 could be the last shakeout before a major bullish breakout.

ADA Long to 2$ADA Long to 2$
as this coin is in the channel I expected to move to the top of channel again and then it will reached to 3$.

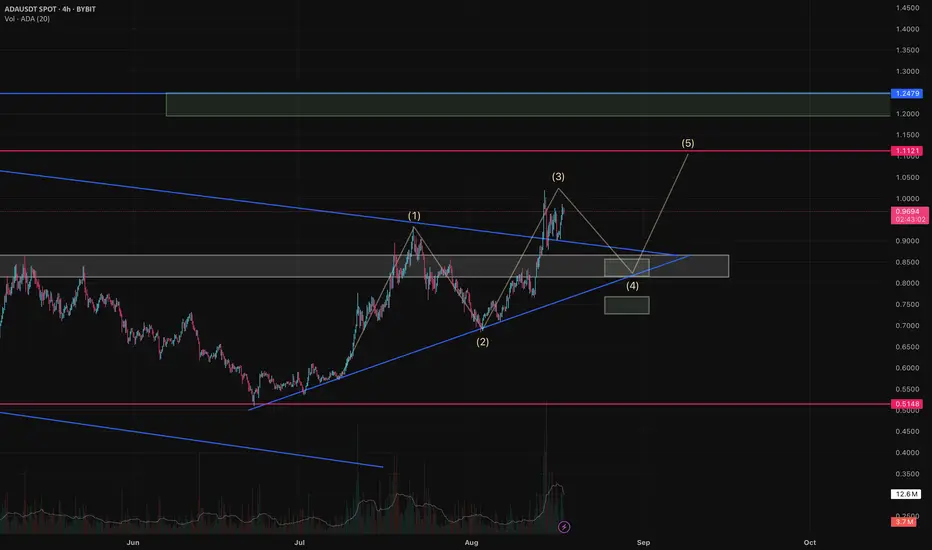
ADA After Channel Breakout — What’s Next?ADA has broken out of a downtrend channel and signals the start of a new trend. The breakout also came with higher volume that shows us that buyers are full of power.
The 3rd Elliot wave looks complete to me, so I'm expecting the market may correct into wave 4 before the next impulse up.
Scenarios:
Bullish:
Price holds above 0.82-0.85 support
Next targets are 1.11 and 1.20-1.25 later
Bearish/correction:
If 0.85 fails, price may fall to 0.72-0.75
RSI hints a correction, but the buy volume supports bulls
Key levels:
Support: 0.85
Resistance: 1.11
Target: 1.25
Disclaimer: The author’s opinion may not align with yours.
ADAUSDT - LONG? - Passive Buyers Absorbing Aggressive BearsHi all!
ADAUSDT looks primed for an upside breakout in continuation of its higher timeframe trend. Price has been compressing and consolidating around 0.8500 — which lines up with the 0.5 HTF Fibonacci retracement.
📌 Upside Targets:
First objective: sweep the weak high from 14 August and fill the imbalance around 1.0400.
If sentiment stays bullish, the next target is the 1.1000 zone, which aligns with the 0.886 HTF Fibonacci retracement.
📌 Entry Trigger:
Look for a 1H close above 0.8700. That would confirm short-term bullish sentiment and open the path higher.
📌 Confluences Supporting the Long Bias:
Fibonacci Confluence → 0.5 retracement support at 0.8500 + 0.886 retracement at 1.1000.
Intermarket Correlation → ADA has a ~85% correlation with ETHUSDT and a ~79% correlation with BTCUSDT. With ETH showing bullish structure, ADA statistically tends to follow.
Open Interest Dynamics → OI has been bleeding out since 20 Aug, yet price barely reacts. Leverage is being flushed out, but spot/passive buying keeps absorbing liquidity.
CVD Data → Both CVD spot and CVD futures are trending down while price holds firm and even swings higher. This hidden bullish divergence = absorption in action.
📌 Invalidation:
A daily/1H close below 0.8420 invalidates the setup.
⚠️ My View:
The confluence here is strong — Fibonacci structure, intermarket correlation, OI flush, and CVD absorption all point to underlying strength. Until 0.8420 breaks, I’m leaning bullish with eyes on 1.0400 first, then 1.1000.

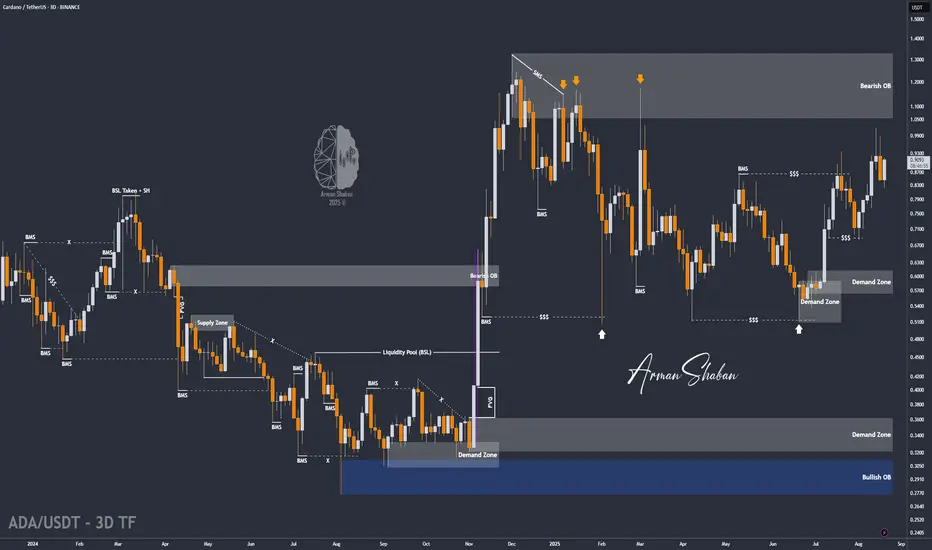
ADA/USDT | Cardano Breaks All Targets – Next Stop: Above $1?By analyzing the Cardano (ADA) chart on the 3-day timeframe, we can see that the price has surged exactly as expected, beautifully hitting all three targets at $0.85, $0.93, and $1! This move delivered an impressive 48% return. Following Jerome Powell’s remarks about the possibility of interest rate cuts in the coming months, Cardano saw renewed demand and has already risen from $0.82 to $0.91 so far. I expect this bullish momentum to continue, with a potential break and hold above the $1 level soon.
Hope you made the most out of this analysis!
Please support me with your likes and comments to motivate me to share more analysis with you and share your opinion about the possible trend of this chart with me !
Best Regards , Arman Shaban
ADAUSTP LONG TERM BYBIT:ADAUSDT.P maybe we gonna be see this flag formation on ADA I think its blow up before the rate

adausdt short trade i didnt get confirmation to short but i think in this zone it has great potential to reverse price and going down
lets see what happen

Cardano Maintains Bullish Structure as ADA Targets $1.19Cardano (ADA) continues to display strength on the weekly chart, holding firmly above $0.88 support with consecutive higher highs and higher lows. The structure favors continuation, with $1.19 emerging as the next major resistance.
Cardano has established itself as one of the more structurally bullish altcoins in the current cycle, with its weekly chart showing a clear pattern of consecutive higher highs and higher lows. This structure confirms a strong upward trajectory that remains intact despite minor pullbacks. Currently, ADA is retesting the $0.88 support zone, and early price action has shown a bullish reaction from this level. The defense of this region will be key in maintaining momentum for a rotation higher.
Key Technical Points:
- $0.88 Support: Critical level now being retested, providing the base for continuation.
- $1.19 Resistance: Next high-time frame barrier to overcome, likely to attract profit-taking.
- Point of Control Cleared: Price action is above the POC, shifting focus to the value area high as next volume resistance.
From a technical standpoint, ADA’s positioning above the point of control (POC) is a bullish sign in itself. The POC is often where the largest amount of trading activity has taken place, and regaining it typically reflects renewed buyer strength. With this reclaim, ADA has opened the path to challenge the value area high. If the value area high is exceeded, it would likely trigger a fresh wave of bullish expansion toward the $1.19 resistance level.
The importance of the $0.88 support cannot be overstated. Not only does it act as a structural pivot, but it also represents a zone where demand has consistently shown up to absorb supply. As long as ADA can sustain closes above this area on higher time frames, the bullish bias remains valid. Conversely, failure to hold $0.88 could shift focus back to lower levels, but at present, market structure strongly favors continuation upward.
Volume analysis also adds weight to the bullish case. Trading activity around the $0.88 region shows healthy accumulation, with buyers actively stepping in during retests. This behavior is typical of strong uptrends, where participants use pullbacks as opportunities to enter rather than exit. The presence of demand at support aligns with the ongoing weekly structure and signals confidence in higher valuations.
What to Expect in the Coming Price Action
Cardano remains well-positioned for further upside as long as $0.88 holds. The most immediate objective is to reclaim the value area high, which would likely ignite momentum toward $1.19 resistance. Consolidation above support would only strengthen this setup, as it would confirm market acceptance of higher levels. Traders should watch for continuation patterns and volume confirmation, as these will dictate the timing of ADA’s next move higher.

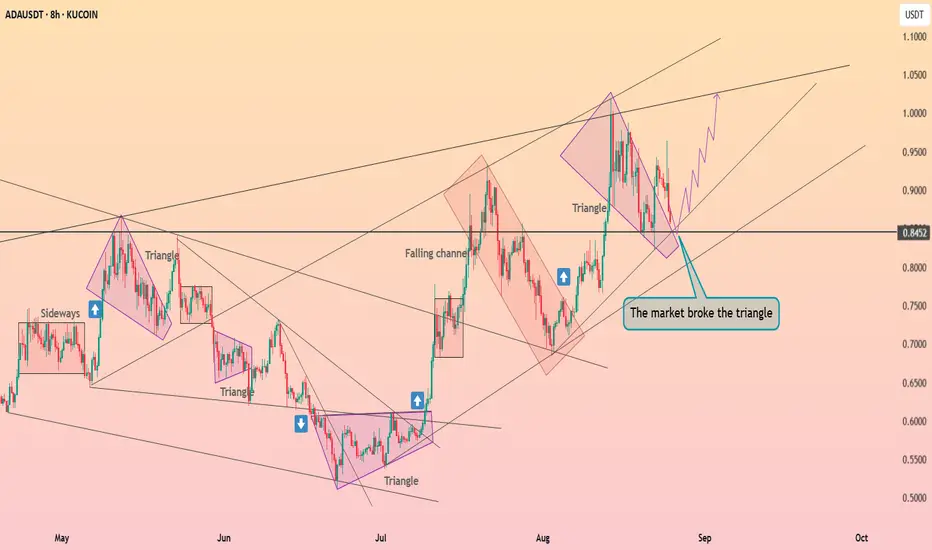
Cardano broke the triangle ┆ HolderStatBINANCE:ADAUSDT on the 8h timeframe broke cleanly out of a triangle pattern around $0.85. The market had earlier respected support from a falling channel and is now showing a bullish structure of higher lows. Continuation above $0.88 could trigger a rally toward $0.95 and $1.00, while maintaining $0.84 as the key invalidation level.
ADAUSDTmy entry on this trade idea is taken from a point of interest below an inducement (X).. I extended my stoploss area to cover for the whole swing as price can target the liquidity there before going as I anticipate.. just a trade idea, not financial advise
Entry; $0.8472
Take Profit; $0.9872
Stop Loss; $0.8260

Cardano Update · All Perfect, Straight Up!Cardano is super bullish right now. Just one day red and the next day green while trading above support.
The rise is an ongoing phenomena. Cardano has been rising since 22 June. We know there has been lots of consolidation after the 3-February low. Some challenge of resistance, some tests of support.
The bulls once more gained the upper hand. ADAUSDT is showing the highest volume 14-August since March. The highest prices since March as well have been activated again.
Resistance was found at $1.01 and notice that this is the 0.618 Fib. extension number for our next wave. This confirms the numbers are good and this reveals the next target to be $1.83. Just as we had a stop at $1.01, we will have a stop at $1.83. This is a major level but these are only short-term to mid-term targets, you know we are going high long-term.
Ok. I wanted to show you the daily and what is happening now. The truth is that everything is fine. The market conditions solid. ADAUSDT is moving forward. This chart shows a classic bullish impulse unfolding. The candles are likely to continue pushing higher, always putting pressure on resistance and breaking it, then higher with swings as well. Retraces just like late July. Hopefully only one correction.
Cardano is trading above all moving averages. The RSI is very strong. The MACD looks great. We will see more growth, additional growth, long-term. It is already happening and it will continue to happen.
Namaste.

How holders React When Price Hits All Time HighHave you ever felt the market is deliberately tiring you out?
The moment your hope runs out is when the real flight begins.
This analysis explains why market makers change the game exactly then.
Hello✌️
Spend 2 minutes ⏰ reading this educational material.
🎯 Analytical Insight on Cardano:
Fundamentally:
Cardano got a boost as Grayscale set up a Delaware trust, echoing its pre-ETF moves for BTC and ETH.
ETF approval odds jumped to 85%, with ADA up 18% in the same week.
History shows ETF wins can drive big rallies, but SEC delays could slow the hype. 📊🚀
technically:
Cardano has successfully breached its key psychological resistance at $1 and is now contending with Dogecoin among the top ten cryptocurrencies. A nearby daily support could hold, potentially fueling a 15% upside toward $1.13. Keep a close watch on price action and manage risk prudently. 🚀📊
Now , let's dive into the educational section,
🚀 ATH Hits and Trader Psycholog:
💡 Whale Behavior and Volume Patterns
As price approaches ATH, whales move large volumes.
This can make smaller traders feel selling pressure or see an opportunity.
Watch volume closely; sudden spikes without price growth often indicate whale sell-offs.
Pro traders wait for confirmed breakout, not just a touch of ATH.
🔥 FOMO and Trader Emotions
FOMO hits when price reaches ATH and strong news spreads.
New traders often jump in without checking volume or indicators.
This leads to short-term volatility spikes.
Using the tools above helps reduce risk.
🛡️ Risk Management and Entry Points
Always have a risk plan before buying or selling at ATH.
Set logical stop losses and small profit-taking points to reduce emotional decisions.
Successful traders often use defined risk-reward ratios for entries and exits.
📈 On-Chain Data and Market Insights
On-chain data can predict market behavior.
When big wallets accumulate, it signals new capital inflow.
If big transactions are selling, short-term pullbacks are more likely.
💰 Profit-Taking and SL on Gains
Some traders like to place Stop Loss on Profit.
This ensures part of your profit is secured but may reduce total gains if not planned.
Experienced traders usually set precise entry and exit points.
For beginners dealing with stress and uncertainty, SL on profit can prevent bigger losses.
Example: price hits $200, your profit-taking zone.
If emotions run high, set SL at $180.
If market reverses, you exit with profit; if price climbs, you gain new decision points.
This method helps newcomers lock in gains and avoid full losses during downcycles.
📊 TradingView Tools and Indicators
One of the key tools for analyzing ATH behavior is Volume Profile and RSI.
Volume Profile shows where most traders are entering or exiting, highlighting real support and resistance zones.
RSI helps spot overbought or oversold conditions.
For example, when price nears ATH and RSI is above 70, emotional reactions are likely.
Also, VWAP can pinpoint safer entry points.
Practical tip: open a Bitcoin or any altcoin chart, apply a 30-day Volume Profile, and check where cumulative volume is highest.
Add RSI and VWAP to see where traders might react.
This approach helps you make smarter decisions at ATH and avoid panic selling.
📌 Summary and Recommendations
Trader behavior at ATH is a mix of fear and greed.
Using Volume Profile, RSI, VWAP, and on-chain data makes decisions more logical.
Risk management and clear entry/exit points reduce emotional impact.
For beginners, SL on profit can help secure gains and build confidence.
Always check market conditions and volume before reacting to ATH.
✨ Need a little love!
We pour love into every post your support keeps us inspired! 💛 Don’t be shy, we’d love to hear from you on comments. Big thanks, Mad Whale 🐋
📜Please make sure to do your own research before investing, and review the disclaimer provided at the end of each post.

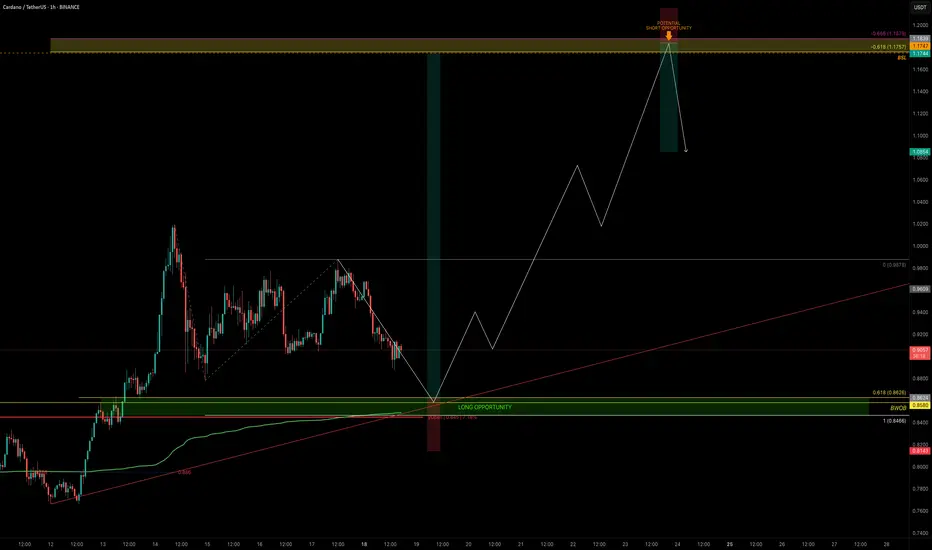
ADA — Is Cardano Ready to Break $1?ADA is coiling just beneath the $1 psychological barrier. The chart is setting up for a decisive move: the high-probability long entry aligns with the yearly open (yOpen), supported by multiple confluences.
🧩 Confluence Factors: 7
Yearly Open (yOpen): $0.845
1.0 Trend-Based Fib Extension: $0.8466 (aligned with yOpen)
Weekly Bullish Order Block: $0.8580
0.618 Fib Retracement: $0.8626
Anchored VWAP (green line): Supporting this zone
Sell-Side Liquidity (SSL): Positioned below recent lows
0.886 Fib Speed Fan: Adding further structural support
🟢 Long Trade Setup
Entry Zone: $0.863 – $0.847
Stop-Loss: Below yOpen (~$0.84)
Take-Profit Zone: $1.1747 (Buy-Side Liquidity sweep)
R:R: 1.6+ depending on SL placement
🔴 Short Opportunity
A secondary setup could arise on a sweep of the key high ($1.1757–$1.1879 BSL zone). This would only be valid with confirmation of rejection.
Entry Zone: After sweep/rejection above $1.1747
Stop-Loss: Above ~$1.20 (post-sweep rejection)
Target: Around $1.10
✍️ Confirmation is critical: the long requires strong defense of the confluence zone, while the short requires a failed breakout and rejection above key high (BSL).
Key Levels to Watch:
Support Zone: $0.863 – $0.847
Resistance / GP Zone: $1.1757 – $1.1879
🔍 Indicators used:
DriftLine — Pivot Open Zones → For identifying key yearly/monthly/weekly/daily opens that act as major S/R reference points
➡️ Available for free. You can find it on my profile under “Scripts” and apply it directly to your charts for extra confluence when planning your trades.
_________________________________
💬 If you found this helpful, drop a like and comment!
Cardano (ADA): Strong Bullish Movement Incoming | Be Ready!ADA looks promising after that successful retest of EMAs. Easy: 150% of movement from the current market price, so do not miss the upcoming push we are about to have!
More in-depth info is in the video—enjoy!
Swallow Academy

ADAUSDT – TECHNICAL BUY CALL | 1D TF | 6:45 PM GMT ADAUSDT – TECHNICAL BUY CALL | 1D TF | 6:45 PM GMT
The coin recently broke structure on the bullish side, pulled back, and then surged in a spike fashion, achieving a high of 1.016. After a retest and another pullback, the pullback now seems to be over, and the coin is ready to move upward.

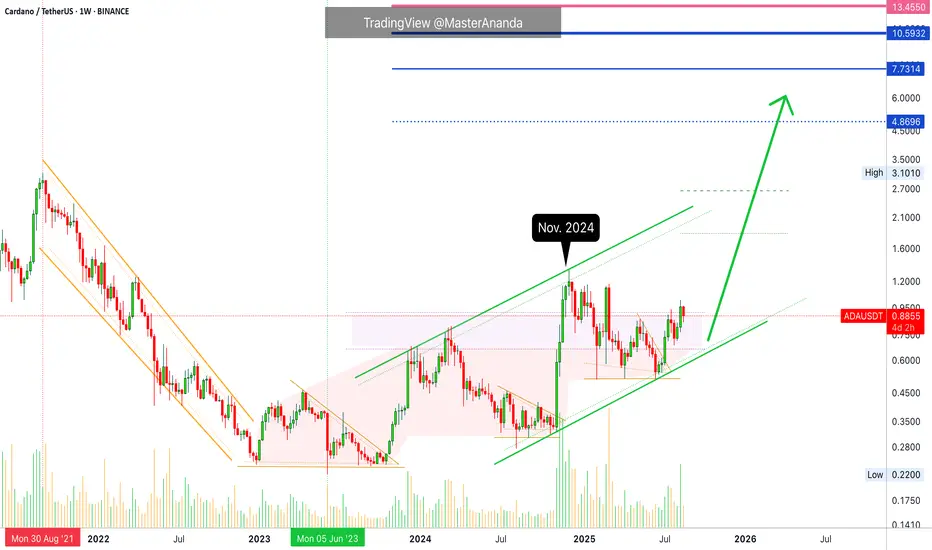
Cardano · $1.83, $2.65, $3.47, $4.87, $7.73, $10.59 & $13.45Cardano has been rising since June 2023, 798 days. Recently, ADAUSDT hit $1.01, the highest price since March 2025. Since late 2023 ADA has been moving within a rising channel and now is preparing to produce a major higher high.
The higher high target within the current trend and rising channel is $1.83 and $2.65. Likely $2.65 will be the end target because the last high was $1.32. This seems too close for a major bullish move. Cardano is likely to continue growing and hit higher to later produce even higher targets based on the broader 2025 bull market cycle.
Bitcoin hits a new all-time high (check). XRP does it and Solana several months back. Ethereum is only a few dollars away. What about Cardano? Cardano is part of the TOP altcoins by market cap and will not stay behind, it will catch up and surprise with performance off the chart.
The all-time high is $3.10. The next all-time high, the first one, is $4.87. This is the standard ATH projection and should be an easy hit.
The next target, which is the main one and one we have been seeing for years, is $7.73. This is a strong resistance and is the 2.618 Fib. extension. This is still part of the standard bull market projection and in each bull market we are seeing prices move to 3.618 and even beyond. This would mean for Cardano a target of $10.59. So the final result should be between $7.73 and $10.59 depending on the strength of the bull market. If the bull market becomes really strong, we can aim even higher, we have a target at $13.4.
Namaste.

ADAUSDTI have conducted a technical analysis of 1150 using the Janne School methodology, combining both numerical and temporal analysis. Based on my findings, I believe that 1150 is poised to reach a target price of 44 rs. My analysis incorporates various

ADA/USDTLooks like price is just retesting from the break of this weekly bull flag. Next move from here should bring us close to the previous ATH

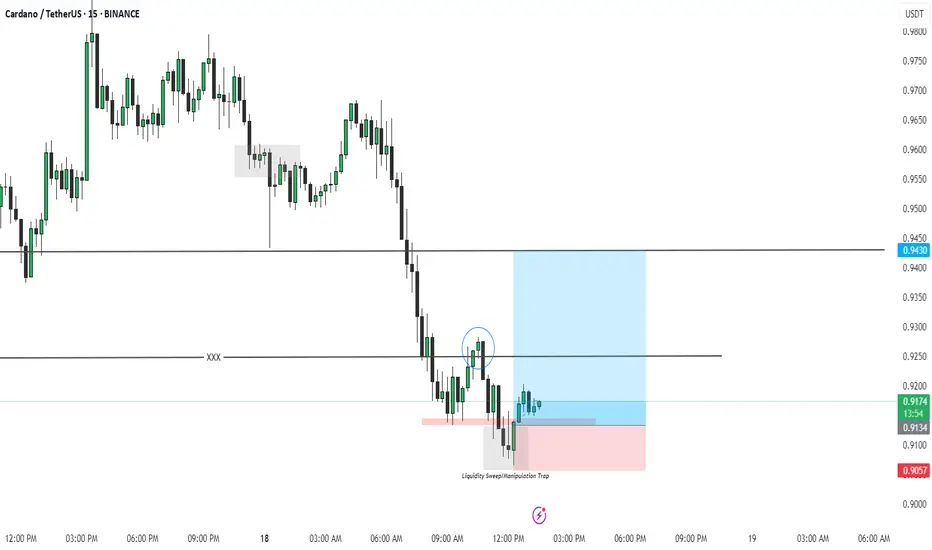
ADA/USDT – Liquidity Sweep & Reversal Setup ADA/USDT – Liquidity Sweep & Reversal Setup (15m TF)
Price recently swept liquidity below the prior low, triggering a manipulation trap. After the liquidity grab, bullish momentum started forming, confirming rejection from the demand zone.
Entry: Taken after the liquidity sweep confirmation.
Stop-loss: Placed below the manipulation low to protect against deeper downside.
Target: 0.9430 resistance zone (major supply level).
This setup is based on liquidity sweep, manipulation trap, and demand zone reaction, expecting a move back to the upside.
Risk management is key – waiting for structure confirmation before continuation.
ADA: Are you ready for a productive flight?ADA
Cardano has managed to break the downtrend line by forming 3 bottoms at one level and is currently consolidating with 4 daily candles.
If it can fully consolidate, it could move towards higher targets.
Given the technical conditions of the cryptocurrency market, I approach the bullish scenario with a probability of 70% and enter a medium-term long position.

cardano next targetsI think Cardano has started the new cycle and can reach the target that I mentioned

ADA USDT TARGET ZAMANI🌊🐋 Cardano (ADA) – The Giant Awakens for a New Era! 🐋🌊
💰 Current Price: $0.89 – this is just the ignition. The real fireworks haven’t even started yet.
🔥 ADA has been through accumulation, silence, and endless waiting. But every cycle tells the same story: once ADA breaks its chains, it moves with unstoppable force. This time, the targets are not small – whales are looking far beyond $1, beyond $2… straight into the legendary $3+ zone.
🎯 Whale Targets Ahead:
$1.05 → First breakout confirmation – the spark that ignites the fire.
$1.25 → Whale accumulation phase – where big money enters aggressively.
$1.45 → Momentum explosion – ADA turns into a rocket. 🚀
$2.00 → Psychological barrier – massive FOMO triggers retail rush.
$2.50 → Acceleration zone – liquidity floods in, whales dominate the market.
$3.20 → Final Moonshot 🌕✨ – ADA completes its full cycle and proves once again why it’s called a sleeping giant.
⚡ Why Whales Love This Setup:
1. Deep liquidity pools = easy accumulation.
2. Strong breakout structure = perfect technical entry.
3. Market sentiment shifting = ADA back on everyone’s radar.
⏳ The clock is ticking. Whales don’t wait for confirmations, they create them. By the time the crowd realizes, ADA will already be sprinting past $2 on its way to $3+.
🚀 ADA isn’t walking… it’s preparing for liftoff.
The only question: will you ride with the whales, or watch them disappear into the skies?
