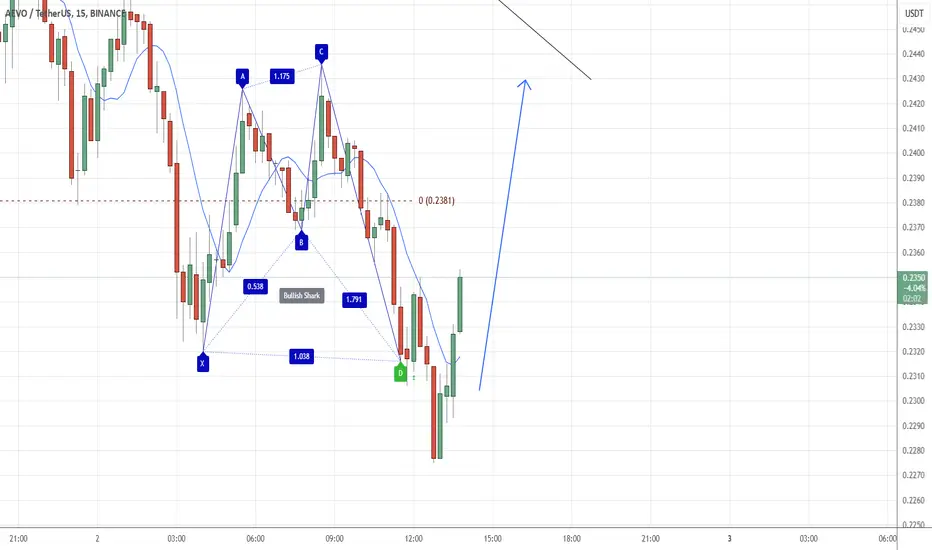
AEVO/USDT Long Trade Setup Analysis (15M Timeframe - Binance)🔍 Market Context:
- AEVO/USDT is currently showing signs of a bullish reversal after reaching a low point.
- The price has bounced from a key support level, near the 0.2320 area, forming a potential bullish shark pattern.
- Fibonacci retracement levels and previous price action suggest resistance zones to watch above.
📊 Trade Entry Criteria:
- The price has reacted strongly at the 0.2320 support, with a sharp upward movement forming a potential bullish pattern.
- A bullish confirmation is expected if the price breaks above 0.2345 resistance, continuing the upward move.
- A rejection from the resistance could result in a retest of the lower levels.
🎯 Trade Targets & Risk Management
- Bullish Scenario:
- Entry Price: Above 0.2345 USDT
- Take Profit (TP1): 0.2380 USDT (38.2% Fibonacci)
- Take Profit (TP2): 0.2400 - 0.2420 USDT (50%-61.8% Fibonacci)
- Stop Loss (SL): Below 0.2320 USDT
- Bearish Scenario:
- Entry Price: Below 0.2320 USDT (break of support)
- Take Profit (TP1): 0.2300 USDT (27.2% Fib extension)
- Take Profit (TP2): 0.2270 USDT (61.8% Fib extension)
- Stop Loss (SL): Above 0.2345 USDT
📉 Profit Target Justification:
- The bullish target aligns with key Fibonacci retracement levels and a previous liquidity zone.
- The bearish target is supported by Fib extensions and the possibility of further downside if support breaks.
📌 Summary
✔ Price is at a key support level, suggesting a potential bullish move.
✔ Fibonacci confluence provides clear trade setups for both bullish and bearish scenarios.
✔ Risk-to-reward ratio is favorable in both directions.
🔻 Invalidation: If price breaks below 0.2320 USDT, bullish setups are invalid. Conversely, a strong move above 0.2345 USDT would invalidate bearish setups.
Trade ideas
AEVO/USDT Short Trade Setup Analysis (1D Timeframe - Binance)
🔍 Market Context:
- AEVO is in a downtrend, with a series of lower highs and lower lows.
- The price has retraced from recent lows and is testing key Fibonacci retracement levels as resistance.
📊 Trade Entry Criteria:
- The entry aligns with the 0.5 Fibonacci retracement level (0.2717), a historically strong resistance point in a bearish market.
- Price is showing rejection wicks around the 0.382 (0.2626) to 0.5 (0.2717) levels, indicating selling pressure.
- The previous strong bearish candles suggest sellers are in control.
🎯 Trade Targets & Risk Management
- Entry Price: Around 0.2648 - 0.2717 USDT
- Stop Loss (SL): Above 0.3106 USDT (-1 Fib level)
- Take Profit (TP): At 0.1576 USDT (-1 Fib extension)
- Risk-to-Reward Ratio: High R:R trade (approximately 1:4 or better)
🛑 Stop-Loss Placement:
- The stop-loss is placed above 0.3106 USDT, beyond the -1 Fib extension, ensuring protection against price spikes.
📉 Profit Target Justification:
- The primary take-profit target is around 0.1576 USDT (-1 Fib extension), aligning with previous swing lows.
- If bearish momentum continues, a deeper drop towards 0.1300 USDT could be possible.
📌 Summary
✔ Bearish rejection at Fibonacci levels
✔ Confluence with overall downtrend
✔ Clear risk-reward ratio (high probability short setup)
✔ Targets key support zones from historical price action
🔻 If price closes above 0.3106 USDT, the trade is invalidated. Otherwise, a continuation lower is expected.

$AEVO at the Lows – Can It Get Any Better?Decided to start buying ASX:AEVO at these levels. It reminds me a lot of CRYPTOCAP:ETHFI , and with CRYPTOCAP:ETH holding up well for now, I'm feeling optimistic.
It's been 5 days without a new low at a key level, so it looks promising. I might get another shot at the lows, so I have some bids placed lower just in case.

pattern cup and handlejust learning about pattern for it to activate
how the pattern that i missed in the first place ive been zooming in to much not seeing the entirety of the chart that what Ive missed it
the pattern is already there but sadly me being a student sometimes ive searching for some other things that arent there specifically the divergence convergence signal hahaha
note for the day
ZOOM OUT

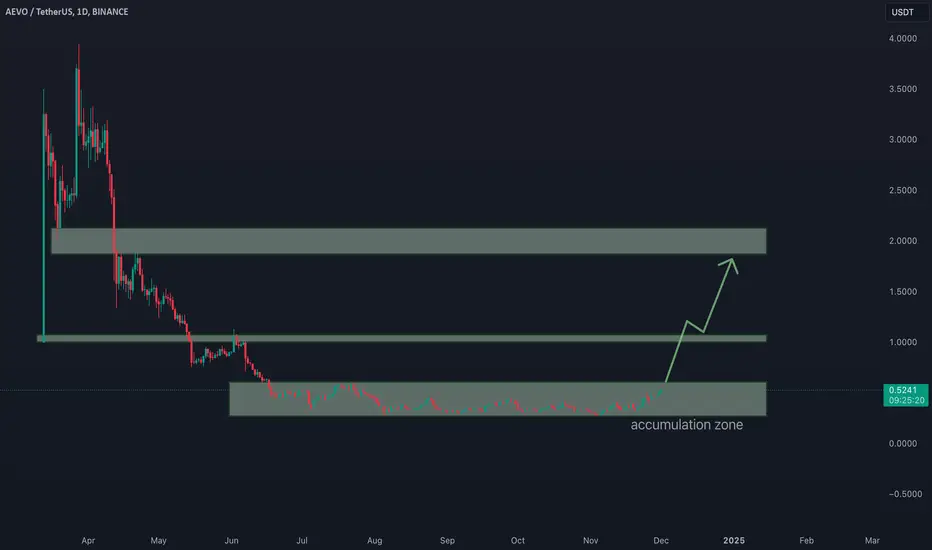
AEVO TIME IS HEREAfter a tough time for Alts in the past couple of weeks, a relief rally is set and Aevo seem ready to take the lead, a breakout upside is imminent.

AEVO/USDT Chart Analysis #AEVO/USDT ( ASX:AEVO )
Rounding Bottom is being formed on weekly🧐
Be ready for a rally once accumulation is over📈
✔️1 Target Zone: 0.9575$
✔️2 Target Zone: 2.7400$

AEVO/USDT$AEVO/USDT
Rounding Bottom is being formed on weekly🧐
Be ready for a rally once accumulation is over📈
✔️1 Target Zone: 0.9575$
✔️2 Target Zone: 2.7400$

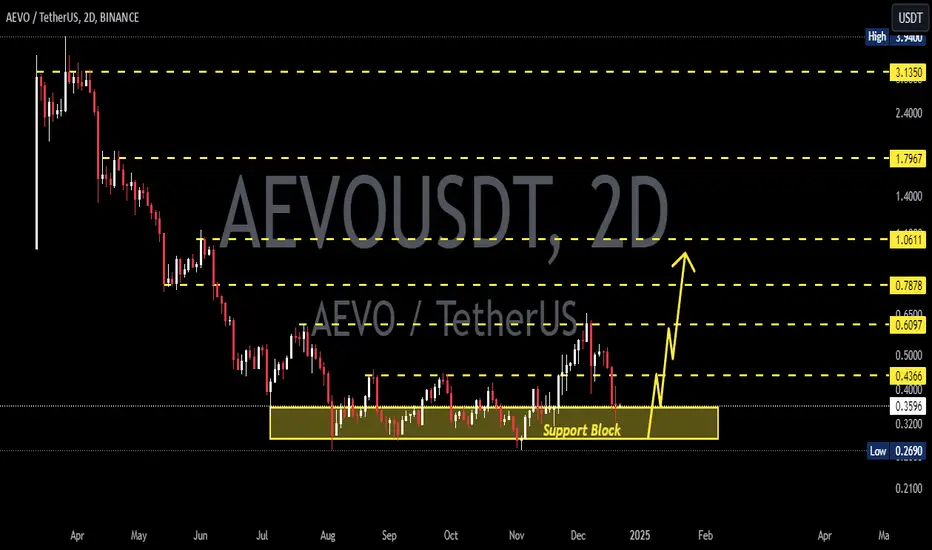
AEVOUSDT 2DAEVO ~ 2D
#AEVO If you still have Conviction on the coin,. Buy gradually within this support block,. with a minimum target of 20%++
AEVO ANALYSIS (1D)It seems to be completing a triangle. If it reaches the green limit, we will look for buy/long positions.
The targets are marked on the chart.
Closing a daily candle below the invalidation level will violate this analysis.
For risk management, please don't forget stop loss and capital management
When we reach the first target, save some profit and then change the stop to entry
Comment if you have any questions
Thank You

AEVOUSDT 2DAEVO ~ 2D
#AEVO If you still have Conviction on this coin,. Buy in stages from here. with a short term target of at least 20%++. Bulls will still pump up prices from here.

AEVO's Ascendant Path: Riding the Breakout WaveAEVO shows good accumulation and several bullish signals. It reminds me of the Goldfinch chart. Overall I would expect a return to the $2 area minimum. I like the project in terms of the funds and the market maker that is here. Wintermute have started to spread coins around the exchanges, this is a signal to fly, the pumping software will be activated soon! Buckle up!
Horban Brothers.

Explosive Long-Term Potential - Aptos Evolved ($AEVOUSDT)I spend time researching and finding the best entries and setups, so make sure to boost and follow for more.
Aptos Evolved ( BINANCE:AEVOUSDT ): Daily Timeframe Analysis for Explosive Long-Term Potential
Trade Setup:
- Entry Price: $0.4505
- Stop-Loss: $0.3109
- Take-Profit Targets:
- TP1: $1.0672
- TP2: $2.5329
Fundamental Analysis:
Aptos Evolved ( BINANCE:AEVOUSDT ) is making waves in the blockchain space with its innovative approach to scalability and decentralized applications. Designed to meet the demands of next-generation DeFi protocols, BINANCE:AEVOUSDT has steadily built a strong ecosystem. Recent partnerships and a focus on interoperability have positioned this project for significant long-term growth.
BINANCE:AEVOUSDT has been consolidating for months, and this moment feels like the calm before the storm. With strong fundamentals and increasing attention from both institutional and retail investors, BINANCE:AEVOUSDT is ready for a breakout. If you’ve been waiting for the right time, this is it—make sure you’re in!
Technical Analysis (Daily Timeframe):
- Current Price: $0.4520
- Moving Averages:
- 50-Day SMA: $0.4250
- 200-Day SMA: $0.3800
- Relative Strength Index (RSI): Currently at 61, indicating increasing bullish momentum.
- Support and Resistance Levels:
- Support: $0.4000
- Resistance: $0.6000
The daily chart shows a classic breakout pattern, with BINANCE:AEVOUSDT breaking out of its consolidation phase. With strong volume support and bullish divergence on the RSI, the setup looks primed for a significant move toward the first target at $1.0672. TP2 at $2.5329 represents the long-term explosion many have been anticipating.
Market Sentiment:
Market sentiment around BINANCE:AEVOUSDT is overwhelmingly positive. Recent developments, such as new partnerships and integrations with major DeFi protocols, have sparked renewed interest. Long-term holders are showing confidence, and trading volume has picked up significantly, reflecting increasing demand.
Risk Management:
A stop-loss at $0.3109 protects against downside risks, while the targets offer exceptional reward potential. TP1 provides a 137% return, while TP2 offers a massive 462% gain, aligning with long-term growth expectations.
Key Takeaways:
- ASX:AEVO is positioned for a significant rally after months of consolidation.
- A strong technical setup combined with growing ecosystem fundamentals makes this a must-watch opportunity.
- Long-term holders should find confidence in BINANCE:AEVOUSDT potential to deliver explosive returns.
When the Market’s Call, We Stand Tall. Bull or Bear, We’ll Brave It All!
*Disclaimer: This analysis is for informational purposes only and does not constitute financial advice. Traders should conduct their own due diligence before making investment decisions.*

AEVO a hidden GEM!Well to be honest if you are looking to 5x money securely then Aevo is one of the hidden GEM not to many people have a lot of Aevo Bags for sure, i am expecting for Aevo to atleast hit 5 usd in short term which is secure 10x.
as we can see the moving avg are also crossing on daily timeframe which means there is a lot of protentional in the market.

AEVO #cryptoI don't have much understanding of cryptocurrency. I have purchased this and a few other coins based solely on technical charts. Since it's a very risky investment, I've only invested a small amount.

TradeCityPro | AEVO : Accumulation Box with Potential for Growth👋 Welcome to TradeCityPro!
In this analysis, I’m going to review the AEVO coin. This project operates in the Premarket space, providing users with charts of coins before they are listed, enabling them to trade within this market.
📅 Daily Timeframe: Accumulation Box
On the daily timeframe, we observe a ranging accumulation box that, unlike most altcoins, has not been broken yet and remains below the resistance level of 0.6160.
💪 There is a critical zone at 0.4472 that acted as a strong resistance prior to being broken. After the breakout, during a market correction, this zone prevented a deeper price drop and provided a strong recovery for the coin.
✨ The RSI indicator has shown a very strong positive divergence since the beginning of the chart, featuring five lows. Currently, this divergence is active and could reflect its influence on the chart.
🛒 The key area right now is 0.6160. If this level is broken, the accumulation box will also break, and we can expect the divergence to manifest its effect on the price action.
📈 Upon breaking this level, the next resistance levels are 0.7776 and 1.0775. The next major resistance is the ATH, located at 3.6599. Considering the project's low market cap, reaching this target is plausible if sufficient buying volume enters the market.
🤝 If you already hold AEVO and are in profit, I recommend continuing to hold, as the coin has not moved significantly yet. Given its high potential, it’s worth holding at least until 0.7776 or 1.0775.
🔽 Correction Scenario
If the price corrects, the first significant area is 0.4472, which has been tested once and has proven to be very robust. In the event of a deeper correction, 0.2823 is the most critical level on this chart and represents the coin’s final stronghold.
📝 Final Thoughts
This analysis reflects our opinions and is not financial advice.
Share your thoughts in the comments, and don’t forget to share this analysis with your friends! ❤️

Aevo to $2 within weeks.BINANCE:AEVOUSDT chart is beautiful. The supply is fully released, and the coin made a very clear bottom around $0.25 in November.
The entire market has corrected over the past couple days, and Aevo has found support at the $0.45 mark. This presents a good opportunity for a long position on Aevo from here - upwards of 100% in a matter of days.
I believe Aevo is preparing for a strong move towards the $1 area within the coming days, and the $2 mark within weeks.
How do you feel about Aevo?
-R

Bullish AevoWe can see how the structure have been changed. We have a wyckoff of acumulation and a reaction from IFVG Weekly, perfect to go straight to 1$.

AEVO Breaks 0.6!! For 17% 0.98 Is Next! For 82%AEVO has just broken the 0.60 resistance level, 17% up from our entry. Upon confirmation we should see some volume pump this to the next target of 0.98 for and 82% return.

AEVO Is About To Make 500% GainsThe technicals for AEVO are well and clear. After a 5 month Consolidation Phase AEVO has broken through the upper side of the range 0.3922 and 0.3209. This is confirms that Bullish moves are ahead.
With simple key Resistance levels highlighted by the higher timeframes, price targets are 0.6 followed by 0.98 and 2.98 for a 500% return.

#aveo 1dThe possible direction of movement of this currency may be like this.
Compliance with the limit is necessary.

AEVOUSDT --> Just One Step Away From a Price SurgeThe AEVOUSDT chart presents an interesting scenario where price action remains constrained within a key resistance zone, but recent developments suggest the possibility of a breakout. Currently, the price is facing significant resistance near the 0.53–0.60 USDT level, a region where sellers have previously maintained control. Despite this, the chart reflects encouraging signs: the formation of a higher low (a newly established bottom) supported by an ascending trendline.
This development is particularly noteworthy in the context of broader market dynamics. As Bitcoin’s dominance in the cryptocurrency market gradually diminishes, altcoins like AEVO are finding opportunities to gain momentum. This shift in capital flow creates a fertile environment for AEVO to realize its bullish potential.
Before the price can decisively break through the resistance, a retest of the trendline is reasonable. This retest, likely within the 0.40–0.45 USDT range, will serve as a litmus test for the strength of buyer support.
If the trendline holds, AEVO will be well-positioned to push higher, eventually targeting the 1.1 USDT mark as investor confidence builds and resistance levels are surpassed.

AEVOUSDT → One step away from a 200-400% RALLYBINANCE:AEVOUSDT is forming a market bottom. Against the backdrop of bitcoin's declining dominance, altcoins have a great chance of realization. And AEVO has an opportunity for a 200-400% rally
Relative to the bottom, the coin is forming a consolidation of 0.269 - 0.534. Consolidation is big enough and if the realization starts, the impulse can be formed quite aggressive, especially on the background of excitement.
Technically, the emphasis is on 0.534 - 0.594. If the price breaks this resistance area and the bulls are able to keep the defense above this zone, the coin will open the way to 0.8, 1.12, 1.34, which is a 200-400% move.
Resistance levels: 0.534, 0.594
Support levels: 0.455, 0.269
A breakthrough of the first line of defense is being formed. The bulls have quite positive chances. Realization can start any minute. Medium-term target is 1.127, long-term target is 1.34
Rate, share your opinion and questions, let's discuss what's going on with ★ BINANCE:AEVOUSDT ;)
Regards R. Linda!

aevo in accumulation zoneaevo has been accumulating for a while. It will make sharp increases after exiting this area. If there are crypto investors among us, I think these areas are good areas to collect.