BREAK OUT ABOUT TO COMMENCE FOR SOLIDUS AI?Breakout falling wedge?
Market structure
Order block
Binance alpha
AITECHUSDT trade ideas
$AITECH Breakout Loading: Compression Breaking, Momentum Rising$AITECH is gearing up for a major breakout move.
After weeks of sideways chop, the coin has been quietly accumulating in a tight range between $0.040 and $0.045 since June 25.
Now? It's knocking on the door of a key resistance at $0.0465, and this time, momentum is shifting. The volume is rising, EMAs are turning, and the structure is breaking out of compression.
This range was a textbook low-timeframe accumulation zone. Smart money likely loaded here while most ignored it. If $AITECH flips the $0.0465 level into support, the next upside leg could be explosive.
Support: $0.040 – $0.045
Resistance: $0.051 – $0.073
A confirmed break above $0.051 opens the path to $0.073 and beyond. The structure is clean, the energy is building, and the breakout looks real.
Watch for a retest before continuation.
DYOR | NFA
#Aitech #Altseason2025

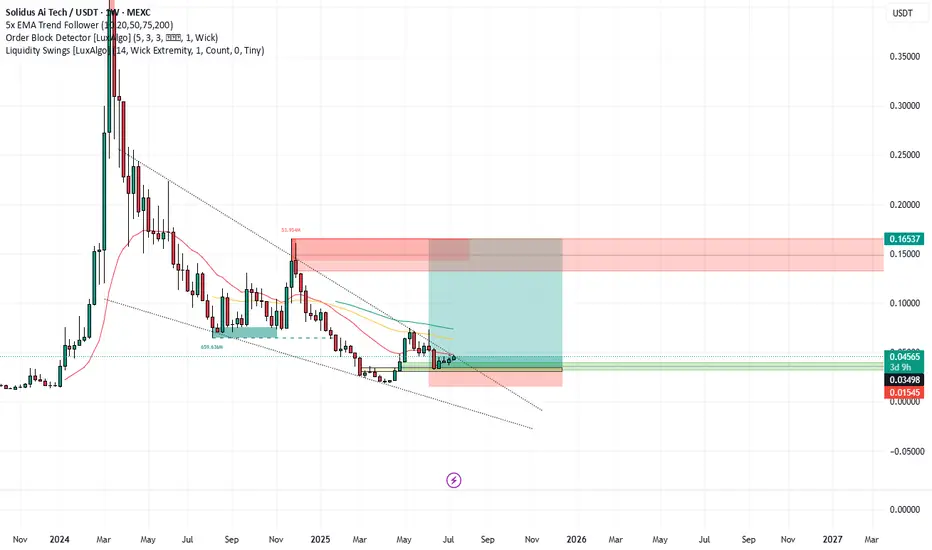
$AITECH/USDT Analysis:🧠 $AITECH/USDT Analysis:
After a long downtrend inside a falling channel, $AITECH broke out with strength, flipping the previous supply zone into support.
- Target: 0.15613
- Potential Gain: +303% from breakout
Watch for a retest & confirmation.
DYOR. NFA.

AITECH Ai token possible 500-800% as soon as correction over.Found this interesting AI token that has nice structure.
In the short-term most likely it will fall to 0.04-0.05$. As those levels are reached price could rise to 0.4-0.5$ which is 500-800% possible profits.
I think 4-5 cents could be reached at the end of january and in early february it will start to go up.

AITECH FOR BUYhello friends
As you can see, the price has entered the correction phase after its rise and succeeded in bottoming out.
Now, according to the price, which is the floor of our support, if the support is maintained, it will be entered into a purchase transaction with capital management.
*Trade safely with us*

Happy Trading!!
AITECH ready to rally, 3-4x!!Join our community and start your crypto journey today for:
In-depth market analysis
Accurate trade setups
Early access to trending altcoins
Life-changing profit potential
Let's analyse AITECHUSDT fundamentally and technically.
FUNDAMENTAL ANALYSIS:
Solidus Ai Tech, symbolized by AITECH, stands out as the world's first deflationary AI utility token. This cryptocurrency is designed to support a variety of real-world applications, particularly in the realm of high-performance computing (HPC) and artificial intelligence (AI).
TECHNICAL ANALYSIS:
AITECH has recently broken out of a bullish triangle pattern, indicating a potential uptrend. The price has found strong support at a key level and is currently being supported by both the 100-day and 200-day Exponential Moving Averages (EMAs). The significant 42% increase in trading volume in just one day further reinforces the bullish sentiment surrounding AITECH.
Key Level:
Entry: $0.12 to $0.09
Targets:
A potential 3-4x gain from the entry point.
If you find this analysis helpful, please hit the like button to support my content! Share your thoughts in the comments and feel free to request any specific chart analysis you’d like to see.

Solidus Ai Tech (AITECH)AITECH is a deflationary artificial intelligence token for the Solidus, which is a state-of-the-art High-Performance Computing (HPC) Data Centre spanning over 8,000 square feet. AITECH token will serve as a payment gateway for licensing Artificial Intelligence as a Service, Blockchain as a Service, and accessing HPC resources via their Infrastructure as a Service platform. Anyway, the project is still young but seems to have potential. Anyway, technical wise, it seems AITECH is oscillating in a somewhat wide descending triangle pattern. Let's see if AITECH can reach the upper line and break it.
#Aitech is about %4000$Aitech 1D;
As of its out of August 2023, it has managed to show a total bullish performance of 4000%.
Although it had its share of the downward trend of the market in March, we can see that its decline has finally come to an end.
Although it managed to make the downtrend breakout upwards, the only obstacle in front of it is the day's close above the $0.09622 level. It will then start an uptrend.
For those who think short-term, OB levels can be considered for profit-taking. However, it is obvious that in the long run, it may test the Ath level again.
#Aitech #AI #Solidus

AITECH Long Position (EMA Breakout)Market Context: AITECH is coiling between the 21- and 200-day EMAs, showing bullish momentum with higher lows. A dip into the $0.09 zone could offer an ideal entry, particularly if the daily close shows a wick, indicating buying interest. A break and close above the 200-day EMA would confirm upward momentum.
Trade Setup:
Entry: Look for confirmation of a break and close above the 200-day EMA.
Take Profit:
First target: $0.166
Second target: $0.21
Third target: $0.28
Stop Loss: Daily close below $0.07.
This setup capitalizes on the bullish coiling pattern and potential breakout. #AITECH #Crypto #EMA

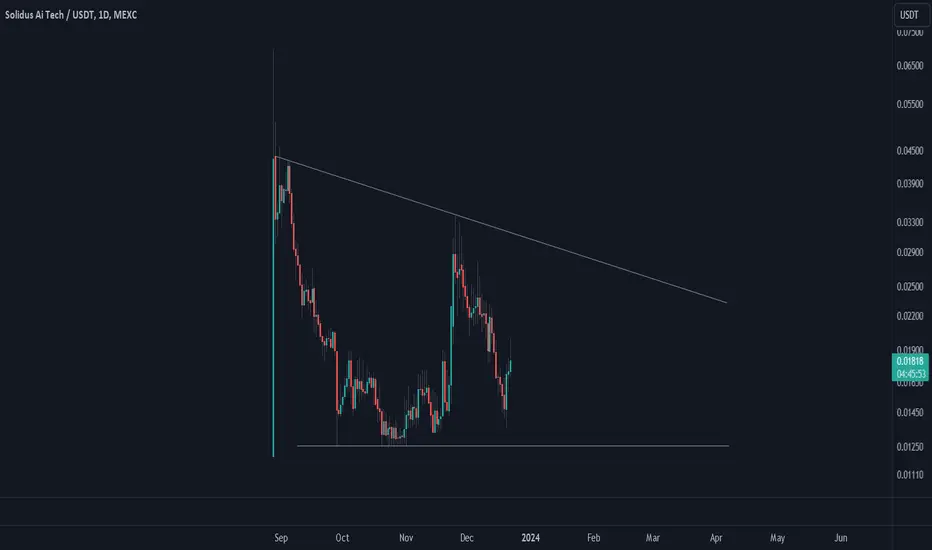
AiTECh Coming IN RangeThe chart displays the price movement of Solidus AI Tech (AITECH) against USDT on the daily time frame. Here's a breakdown based on the chart:
Current Price (September 30, 2024): $0.10873
Green Lines:
Upper Green Line: $0.09968 (First buying support level)
Lower Green Line: $0.09141 (Second buying support level)
These green lines represent potential support levels where traders might look to buy if the price pulls back to those zones. The recent price action shows a strong upward move followed by a retracement, with current levels suggesting the possibility of a bounce from the support zones marked by the green lines.

AITECH could reclaim some lossesAfter the strong fall started in March, the token found high demand around 0.07 and the price started to reverse.
Now is trading comfortably above 0.1 and we could see a continuation to the upside.
Dips under 0.1 should be bought, preferably around 0.09. My target is 0.15
For high speculative purposes ONLY!!!!


Solidus Ai Tech $1.20 2024?1. Weekly Fib on Daily Timeframe 78.6%, 3x rejections.
2.Bull Flag into consolidation of Bullish triangle.
3.EMA Compression looking likely to push price action.
4. AI Marketplace June.
5. AI HPC Data Centre July.
6. Weekly oscillators bottoming.
7. Solid Market stucture & hold.
8. Break out of Symmetrical triangle.
9. MC 23/05/24-$112M.
10. MC to Reach circa $ 725m for Fib Targets.

Break Out of Bullish Falling Wedge?Confluences as per previous chart post
78.6% fib retracement daily
market structure
expansion of channel
ema multi daily support
vmc cash injection green ball
rsi low
mac d due for overchange
volume pending
2 day ema 50 support
weekly ema 20 support
weekly fib 23.60% showing support
multi bullish convergence on multi timeframes Indicators

Solidus Falling Wedge?falling wedge
61.8% fib retracement
market struture
expansion of channel
ema 75 daily support
vmc cash injection green ball likely
rsi low
mac d due for overchange
volume pending
3 day ema 20 support
weekly fib 23.60% showing support
multi bullish convergence on multi timeframes Indicators

#AITECH is preparing for another upward trend in the market! #AITECH is currently forming a falling wedge pattern. This pattern is expected to lead to a good bounce after it breaks out. However, if the support zone is breached, there could be a downward movement. The overall sentiment remains bullish and the 200MA is also working as a good support.
For those who are yet to invest, the accumulation zone ranges from $0.23 to $0.256. It is important to do your own research (DYOR) and note that this is not a financial advice (NFA).. It is important to do your own research (DYOR) and note that this is not a financial advice (NFA).

AitechAitech in a falling wedge pattern
Was in the .786 fib area and popped our of it
22hr stochastic has gas
Target is .59

AITECH Next Move Comingpreviously the show-up chart is still valid with the uptrend channel.
we are an early mover with a project.
stay Relax & Invested..


AITECH _ AI Token AITECH is an AI Platform available on the #BNB chain.
aitech.io
Market Cap: 159M
Total Supply: 2B
Circulation Supply : 500M
Current Price: 0.31$
Future Price Prediction : $5+
Available on MEXC, Kucoin #NFA #DYOR


Aitech going to experience a good pump againCrossing the downtrend, going to repeat the flag ( about 269% pump )

#AITECH: Another bullish really incoming!New entry levels for #AITECH for those who missed
Buy above $0.12 or after the breakout of this bullish flag pattern.
#DYOR
