AIUSDT.P trade ideas

Sleepless Ai InsightSleepless Ai Insight
1d timeframe, as you can see on the chart, we had 2 bearish patterns that ultimately led to a downtrend move. 1st is the Head 'n Shoulder pattern then followed by a bearish continuation pattern which is the Bearish Flag. We take and mark the OBs on both of this area to classify as potential Supply Zones. Price continue downward making an ATL around $0.26 then move sideways. Lined-up all flip zones made along the way and we can see reactions on this levels. If price will be able to breakout from the 0.80 level, next target will be the Bearish Flag Supply Zone. There is also a Golden Crossover of the MA100/200 following the up candle.

AI Completed a Huge C&H on Weekly Timeframe
#AI The handle part of the formation was perfectly supported at the confluence of 0.786 Fibonacci Zone + Key Support Area 👌.
This is a clear sign of re-accumulation before a potential breakout through the Weekly Resistance Zone.
SEND IT ✈️
🎯 Target 1: $1.6895
🎯 Target 2: $2.1041

AI/USDT Chart Analysis AI/USDT
Accumulation inside of Descending Channel is over🧐
Looking for a breakout📈
✔️1Tp - 1.5810$
✔️2Tp - 2.5865$

AIUSDT Analysis: Focused on Key Reaction ZonesIn AIUSDT, I aim to avoid getting lost in intermediate areas . The blue boxes represent zones that are likely to react, making them valuable for strategic positioning. I plan to hold my position until at least the 0.26 level , as it aligns with my overall target.
Key Points:
Reaction Zones: Blue boxes are areas with high potential for price response.
Target Level: Holding positions until 0.26.
Strategic Focus: Avoiding intermediate, less meaningful areas.
Confirmation Indicators: I will use CDV, liquidity heatmaps, volume profiles, volume footprints, and upward market structure breaks on lower time frames for validation.
Learn With Me: If you want to master how to use CDV, liquidity heatmaps, volume profiles, and volume footprints to identify precise demand zones, just DM me. I’d be happy to guide you!
Reminder: Be aware of the market's current state and approach it with caution. Successful trading relies on meaningful levels and robust confirmations.
If you think this analysis helps you, please don't forget to boost and comment on this. These motivate me to share more insights with you! Wishing everyone success in their trades.
If you think this analysis helps you, please don't forget to boost and comment on this. These motivate me to share more insights with you!
I keep my charts clean and simple because I believe clarity leads to better decisions.
My approach is built on years of experience and a solid track record. I don’t claim to know it all, but I’m confident in my ability to spot high-probability setups.
If you would like to learn how to use the heatmap, cumulative volume delta and volume footprint techniques that I use below to determine very accurate demand regions, you can send me a private message. I help anyone who wants it completely free of charge.
My Previous Analysis
🐶 DOGEUSDT.P: Next Move
🎨 RENDERUSDT.P: Opportunity of the Month
💎 ETHUSDT.P: Where to Retrace
🟢 BNBUSDT.P: Potential Surge
📊 BTC Dominance: Reaction Zone
🌊 WAVESUSDT.P: Demand Zone Potential
🟣 UNIUSDT.P: Long-Term Trade
🔵 XRPUSDT.P: Entry Zones
🔗 LINKUSDT.P: Follow The River
📈 BTCUSDT.P: Two Key Demand Zones
🟩 POLUSDT: Bullish Momentum
🌟 PENDLEUSDT.P: Where Opportunity Meets Precision
🔥 BTCUSDT.P: Liquidation of Highly Leveraged Longs
🌊 SOLUSDT.P: SOL's Dip - Your Opportunity
🐸 1000PEPEUSDT.P: Prime Bounce Zone Unlocked
🚀 ETHUSDT.P: Set to Explode - Don't Miss This Game Changer
🤖 IQUSDT: Smart Plan
⚡️ PONDUSDT: A Trade Not Taken Is Better Than a Losing One
💼 STMXUSDT: 2 Buying Areas
🐢 TURBOUSDT: Buy Zones and Buyer Presence
🌍 ICPUSDT.P: Massive Upside Potential | Check the Trade Update For Seeing Results
🟠 IDEXUSDT: Spot Buy Area | %26 Profit if You Trade with MSB
📌 USUALUSDT: Buyers Are Active + %70 Profit in Total
🌟 FORTHUSDT: Sniper Entry +%26 Reaction
🐳 QKCUSDT: Sniper Entry +%57 Reaction
I stopped adding to the list because it's kinda tiring to add 5-10 charts in every move but you can check my profile and see that it goes on..

AIUSDT ANALYSIS
Long cross x3
Entry zone: 0.5368 - 0.478
Targets: 0.61249 - 0.70846 - 0.84290
Stoploss: 0.43645

the Cabal_ Dev_Indicator with Hopium_48 Line of SentimentUnderstanding the Price Action of Narrative
and Putting it into Action
This indicator Covers HOLDERS Analytics
and Bundling of Ownership across informed players from the DEV or Vulture
capitalist taking over float
Green Means Buy
Red Means Sell
that Simple
across timeframes
Settings Setup and Back Tested
search for --> Senyor Developer iNDiCATOR

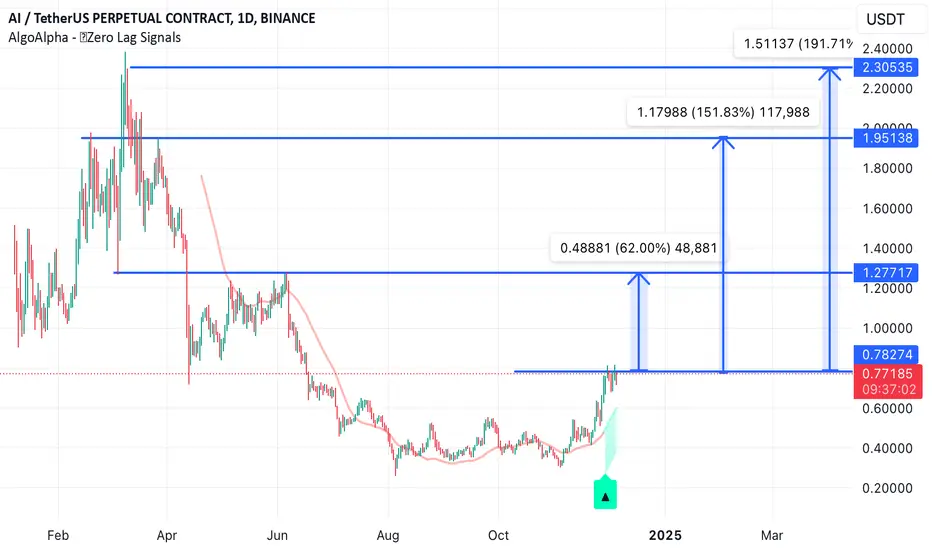
$AIUSDTTrend Analysis:
The AI/USDT pair appears to be in a recovery phase after a prolonged downtrend.
A recent bullish signal is visible, suggesting potential upward momentum.
Support and Resistance Levels:
Support: Around the $0.60 region.
Resistance: Key level observed around $1.50, which may act as a psychological barrier.
Technical Indicators:
The chart includes a moving average (possibly a simple or exponential moving average) that recently crossed below price levels, reinforcing a bullish bias.
Zero-lag signal indicator shows a buy signal, aligning with the price's upward trajectory.
Long and midterm term targets are on the chart.
AIHello, artificial intelligence has been quiet for a long time and I think their time has come. It broke a strong resistance on the AI chart and needs closing above it. I expect a distribution diagram to form after a small accumulation area. The chart is repeating its history as if the price is above 0.65, the uptrend will continue. If it breaks below, the plan will be canceled. The intermediate resistance at 0.85 is the first target and 1 dollars will be the target. We can follow the chart exactly.

Sleepless AI (AI)Sleepless AI is a Web3 gaming platform that utilizes Artificial Intelligence Generated Content and Large Language Models to create diverse gaming experiences and allow players to interact with virtual characters in the game as if they were interacting with real people.
Anyway, AI is still young and not enough candles exist to analyze long term perspective. It is clear that AI was in a downtrend since birth. Then, AI broke the downtrend line and it seems oscillating in a minor channel. For reversal confirmation, AI has to break this channel. Let's see what happens.

AI/USDT: BREAKOUT ALERT! READY FOR 40% MOVE!!Hey everyone!
If you’re finding value in this analysis, don’t forget to hit that 👍 and follow for more updates!
AI Update: It’s looking strong! AI is breaking out of a falling wedge structure on the 4-hour timeframe and appears poised for a 35-40% move to the upside. Consider taking a position now and adding more on dips.
Entry Range: Current Price (CMP) and add more up to $0.39
Targets: $0.445 / $0.481 / $0.555
Stop Loss: $0.369
Leverage: Use low leverage (Max 5x)
What’s your take on AI’s current price action? I’m seeing a promising bullish setup here! Share your insights and analysis in the comments below!

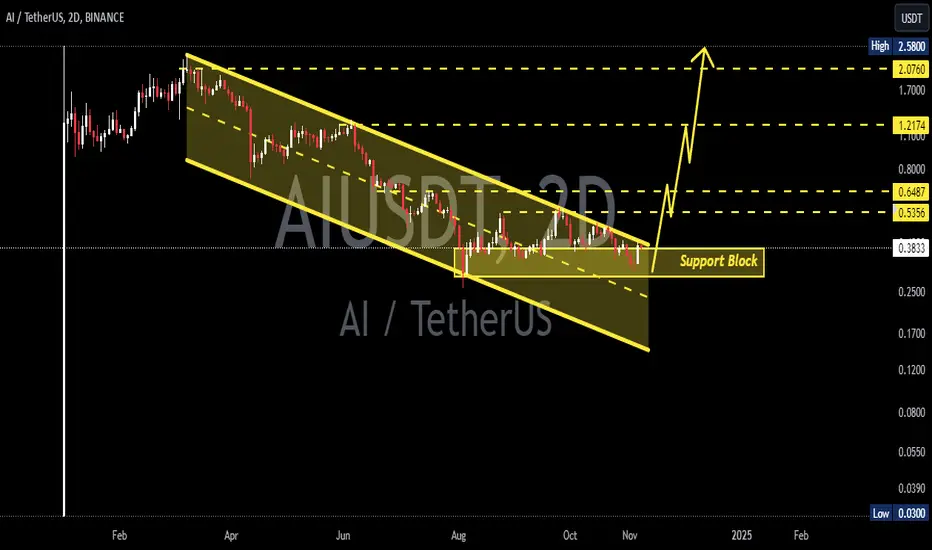
AIUSDT 2DAI ~ 2D
#AI if you have Conviction on the coin this,. Buy gradually on this support block,. with a minimum target of 15%++.
#AI, $AI, #AIUSDT, AIUSD#AI ...... is in a very nice entry point and near stop loss to get high profit
#AI
NYSE:AI
#AIUSDT
#AIUSD
#swingtrade
#shortterminvestment
#ALTCOIN
#Cryptotading
#cryptoinvesting
#investment
##trading
#cryptocurrencytrading
#bitcoininvestments
#Investing_Coins
#Investingcoins
#Crypto_investing
#Cryptoinvesting
#bitcoin
#BTC
#BTCUSDT
BINANCE:AIUSDT

AIUSDTAI ~ 2D ✅
#AI we will never see bulls on this coin,. before this descending channel is successfully broken.
✅ If you have Conviction on this coin,. It's best to wait for this descending channel to successfully break through to make a purchase on this coin.

AI coin look good to go up / september till now 6 WIN 5 LOSSAI coin look good to go up
ENTRY 0.529
SL 0.514
TP 1:1

AI look good to go up / september Till now 5 win 5 loss
AI look good to go up
entry 0.499
SL 0.475
TP 1:1

Sleepless AI: Bullish Breakout and Key Levels to WatchBased on the chart, it is evident that after forming a compression pattern, Sleepless AI managed to break out upwards, surpassing the pattern's ceiling. Following a pullback to the broken level and the accumulation of sufficient liquidity, Sleepless AI (AI) is likely to encounter increased demand and sustain its upward trajectory, provided that the identified support levels hold.
Analyzing the 4-hour time frame chart, several key support and resistance levels become apparent for this cryptocurrency, which could serve as potential areas for future price reactions. These critical levels are as follows:
Short-term support: $0.458
Static support: $0.355
Resistance and supply zone: $0.64 to $0.74
Target and resistance range: $1.29
By closely monitoring these levels, we can anticipate how Sleepless AI might behave in the coming sessions, as they are likely to play a pivotal role in guiding future price movements.

AI/USDT Chart Analysist 1DAI/USDT- It took Breakout so it is good but If it take retest then it may pump more

AI ANALYSIS (6H)AI seems to be inside a large diametric.
It now appears to be inside wave D or inside part of wave E and can react to the red box and reject downwards.
We are looking for sell/short positions in the supply range.
Closing a daily candle above the invalidation level will violate the analysis.
For risk management, please don't forget stop loss and capital management
Comment if you have any questions
Thank You

#AI Technical Analysis in a Daily TimeframeHello everyone, I’m Cryptorphic.
I’ve been sharing insightful charts and analysis for the past seven years.
Follow me for:
~ Unbiased analyses on trending altcoins.
~ Identifying altcoins with 10x-50x potential.
~ Futures trade setups.
~ Daily updates on Bitcoin and Ethereum.
~ High time frame (HTF) market bottom and top calls.
~ Short-term market movements.
~ Charts supported by critical fundamentals.
Now, let’s dive into this chart analysis:
AI is approaching a crucial point where it must break above the resistance trendline and the 50 EMA to continue its bullish rally.
The $0.343 support trendline is critical for AI to hold, as a breakdown and close below this level could lead to a drop toward the lower support trendline.
On the bullish side, AI is targeting $1.27, a 270% rally from the support, but it first needs to break above the resistance.
Key levels:
- Primary Support: $0.343.
- Primary Resistance: 50 EMA & Resistance Trendline ($0.41-$0.44).
- Invalidation: A close below the $0.343 support.
- Bullish Move: A close above the resistance trendline.
DYOR. NFA.
Please hit the like button to support my content and share your thoughts in the comment section. Feel free to request any chart analysis you’d like to see!
Thank you!
#PEACE

AI/USDT LONG SCALP SETUP!!Hey everyone!
If you're enjoying this analysis, a thumbs up and follow would be greatly appreciated!
AI looks good here. Breaking out from the falling wedge-like structure and a retest is also done. Long some here and add more in the dip.
Entry range:- $0.344-$0.354
Targets:- $0.372/$0.394/$0.419/$0.448
SL:- $0.325
Lev:- Use low leverage (Max 5x)
What are your thoughts on AI's current price action? Do you see a bullish pattern? Share your analysis in the comments below!

AI#AI
Now:16h46 22.8.2024 GMT+7, Hanoi, Vietnam
Chart:H2
Contact me by clicking on the link pinned on my profile
Note: I never texted you first.
#giapduclong #crypto #forex #index #stock #trader #signal

AI ANALYSIS🔮 #AI Analysis 💰💰
🌟🚀In daily chart we can see a formation "Falling Wedge Pattern" in #AI. Currently #AI is testing its major resistance level. If #AI breaks and holds this resistance then we will see a good bullish move.💲💲
🔖 Current Price: $0.397
⏳ Target Price: $1.260
⁉️ What to do?
- We have marked some crucial levels in the chart. We can trade according to the chart and make some profits in #AI. 🚀💸
#AI #Cryptocurrency #DYOR #PotentialBreakout
