AIXBT Swing Trade Buy / Long SetupMarket is taking some good correction, Also It has cleared almost all liquidity below side, Now It can move towards upside. Must wait for the entry. It's a swing trade so it can take time on entry and tp. Best Of Luck.

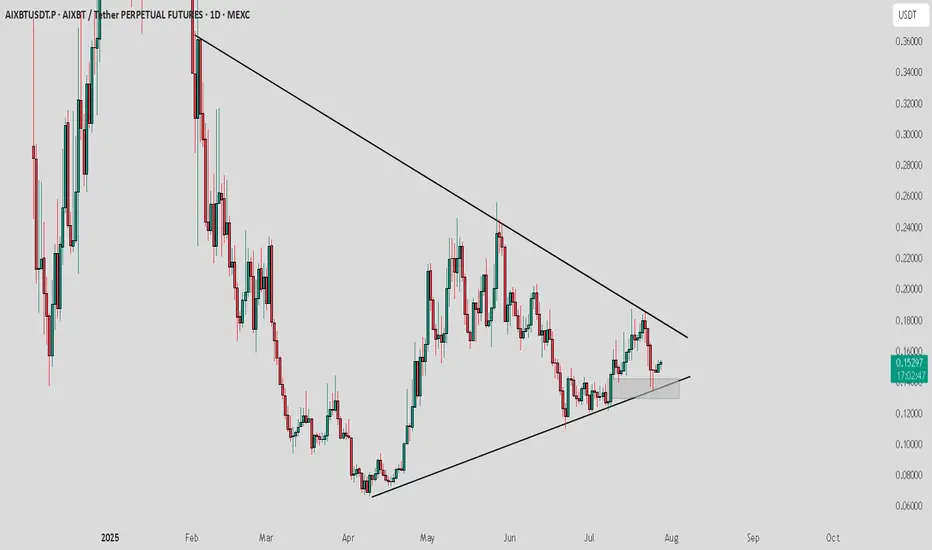
AIXBT / USDT : Getting support and moving towards resistance AIXBT/USDT is currently forming a symmetrical triangle pattern and testing a key support zone. A short-term rally of around 10% towards the upper resistance is expected, leading to a potential breakout.
Bullish Scenario:
A solid breakout above the upper trendline could initiate a major rally, targ
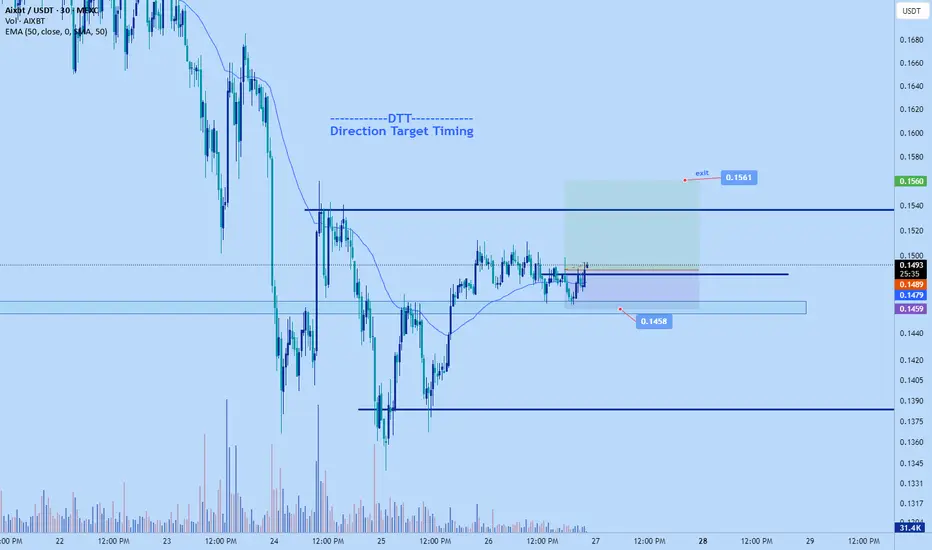
Aixbt long to $01561Just now opened up a long position on aixbt.
sl: $0.1458
TP: $0.1561
Roughly 2.4RR
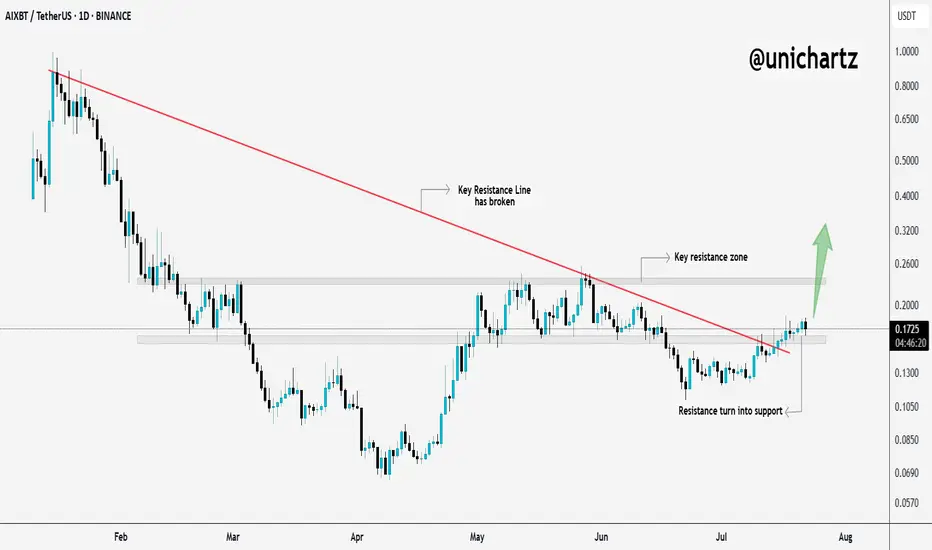
$AIXBT Breaks Trendline – Sharp Move Ahead?$AIXBT just broke out of its downtrend and flipped resistance into support, classic breakout behavior.
It’s now pushing toward a key resistance zone, and if it clears that level, we could see a sharp move up.
Momentum is shifting, this chart deserves your attention.
DYOR, NFA
AIXBT – Ready to Break Out?
This is AIXBT on the daily chart.
Price is now testing a confluence of resistance: the 50MA and the 0.5 Fib level — both aligned in the same zone.
Both systems are in long mode:
* PSAR is bullish
* MLR > SMA > BB Center
The RSI just broke out of a month-long bullish divergence, signalling fresh

#AIXBTUSDT #4h (ByBit) Descending trendline breakout$AIXBT just regained 100EMA support and looks ready for short-term recovery.
BYBIT:AIXBTUSDT.P aixbt.tech

AIXBT/USDT – Symmetrical Triangle Squeeze! A Major Move is Brewi🔍 Market Structure Overview
AIXBT/USDT is currently forming a well-defined Symmetrical Triangle pattern on the 1D timeframe, signaling a tightening consolidation between lower highs and higher lows.
Price is consolidating just above a strong demand zone between $0.1200–$0.1350, suggesting accumula

AIXBT/USDT next LegAfter forming a local top at $0.25, AIXBT/USDT retraced 55% and is now stabilizing in the $0.12–$0.14 range. This zone aligns with previous resistance, which is now acting as strong support, indicating potential accumulation. If the current structure holds, price action is setting up for a move towa

$AIXBT - Scalp Long IdeaBINANCE:AIXBTUSDT | 4h
Valid retest of previous LTF swing point. Potential trendline break out
Ltf demand: .13 to .125
Stoploss: just below .118
TPs:
.142 to .149
.158 to .165
.176 to .182

AIXBT USDT ready to face the highs The overall sentiment appears bearish, with the price respecting the downward trendline and facing resistance from the rejection zone. A break above the rejection zone and trendline would be necessary to signal a potential reversal. Conversely, a breakdown below the order block could lead to furthe

See all ideas
Summarizing what the indicators are suggesting.
Oscillators
Neutral
SellBuy
Strong sellStrong buy
Strong sellSellNeutralBuyStrong buy
Oscillators
Neutral
SellBuy
Strong sellStrong buy
Strong sellSellNeutralBuyStrong buy
Summary
Neutral
SellBuy
Strong sellStrong buy
Strong sellSellNeutralBuyStrong buy
Summary
Neutral
SellBuy
Strong sellStrong buy
Strong sellSellNeutralBuyStrong buy
Summary
Neutral
SellBuy
Strong sellStrong buy
Strong sellSellNeutralBuyStrong buy
Moving Averages
Neutral
SellBuy
Strong sellStrong buy
Strong sellSellNeutralBuyStrong buy
Moving Averages
Neutral
SellBuy
Strong sellStrong buy
Strong sellSellNeutralBuyStrong buy
Displays a symbol's price movements over previous years to identify recurring trends.