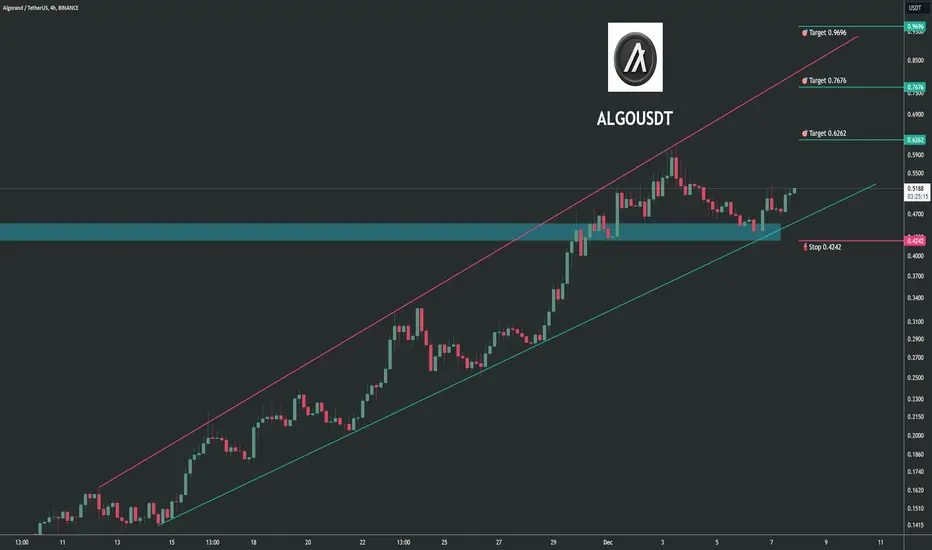
Trading opportunity for ALGOUSDTBased on technical factors there is a Buy position in :
📊 ALGOUSDT
🔵 Buy Now
🪫Stop loss 0.4242
🔋Target 1 0.6262
🔋Target 2 0.7676
🔋Target 3 0.9696
💸RISK : 1%
We hope it is profitable for you ❤️
Please support our activity with your likes👍 and comments📝
Market insights
Algo Bullish Flag Algo BINANCE:ALGOUSDT can reach next target $0.7860. There is a Bullish Flag pattern. Algo was staying around 0.45 dollar for long time. it can turn back to game more powerful.


ALGO to the moonALGO using Elliot Wave Theory.
ALGO went through a brutal bear market but is now finally able to go through its 2nd bull cycle

$ALGO looking healthy on the 4H Algorand seems to be wanting to continue the bullish trend by forming a symmetrical triangle on the 4H timeframe, aiming a possible 37.17% breakout towards this local resistance level. Breaking this local resistance level would be important to continue the trend, but failing to do so would push Algorand back into the accumulation zone around 40 cents.

ALGOUSDT Uptrend Insight
BINANCE:ALGOUSDT has performed promising lately. Given the market uptrend, ALGO can continue its Bull-run by reacting to support level at its Fibonacci 0.5 or breaking previous High at Fibonacci 0.38 going upward.
Breaking below 0.4321 could trigger a downtrend or if supported at 0.3893 (Fibo 0.618) signal a weaker uptrend.

Long opportunity in ALGO/USDTIf the level 0.4933 breaks with 15 Min Green candle, there is an opportunity for long trade.
Disclaimer : I'm not recommending to take this entry. Do with your analysis too.
Reasons : -
. Trend line breakout.
. Falling wedge pattern.
After Breakout :-
Entry : 0.4933
TP : 0.5413
SL : 0.4616

ALGO - where to buy the diphi traders,
After reaching 0,60$ the price has been experiencing the pullback. Don't worry. It's normal as the RSI is super overbought.
We believe that it's not the end of the uptrend yet, but just an opportunity to buy the dip.
Buy the dip and enjoy the 85 % profit in the next few weeks.
Kind regards

algo 11$ by the end of 2029algo 3-4$ by the end of 2025
11$ by the end of 2029
fibonacci ext never misses


Looking at the monthly chart we can expect at least $2 ALGO$2 ALGO is only a month or month and a half away.
I think this is conservative, given how algo smart contracts were not yet live last cycle and with DT as president soon, USA based cryptos are poised to receive a boost across the board.
Im really looking for $3 - $4 but thats just me

#ALGO Algo looking good on HTF here.
double bottom kind of structure & levels line up interesting with HTF downtrend

Algorand Nears $0.45 Resistance: Breakout Targets $0.70 Algorand (ALGO) is experiencing a significant upward trend, with a 25% surge in its price over the past 24 hours. However, resistance levels around $0.45 and beyond may need to be breached for ALGO to maintain its bullish trajectory
Waiting to test the key resistance at $0.45, a breakout above this level could confirm entry opportunities. Targeting the resistance zone around $0.70.

ALGO ... this could be somethingHi guys,
Spotted this setup on ALGO, the target of the cup & handle is situated in the 0,67$ area.
As a "safe" trading setup we still need to wait for a breakout and retest of the 0,23$ area before taking action.
Always take risk management measures while trading ( set stops, maintain risk under 2% etc.).
I hope we all make it !

ALGO PumpAlgorand is one of the cryptos which has shown bigger gains in this bull pump.
There is a major resistance level in the 0.70 zone, which has been important since 2020. I believe this is the next target to the upside.
In terms of Elliott Waves, my primary count considers we are currently in gray wave 3.
Pullbacks are buying opportunities until we reach gray resistance. At that level I'd be more careful since we could see a deeper correction before continuation.

ALGO LongReason: Break out of Downtrend channel pattern. Above strong resistance zone. Chart looks bullish for it. Worth buy for short-mid term quick profits too.
Entry: 0.1218$ - 0.1170$
Targets: 0.1230$, 0.1260$, 0.1290$, 0.1320$, 0.1380$, 0.1450$, 0.1500$, 0.1550$
Stoploss: 0.1140$

Key Factors Driving ALGO's Potential Rise to $0.70We expect ALGO to continue its upward movement towards the $0.70 level if a combination of positive factors supports its price action. The first of these factors is an increase in buying momentum, which reflects strong demand for the currency driven by new investors or institutions looking to capitalize on the potential of the Algorand network.
Breaking technical resistance is another key factor. The currency needs to surpass the nearby resistance level of $0.50 with a strong close to pave the way towards $0.70. Indicators such as a rise in the Relative Strength Index (RSI) or a positive crossover of moving averages could further confirm this upward trend.
Additionally, support from the broader market is essential. If the cryptocurrency market experiences a general upward trend led by Bitcoin or Ethereum, ALGO could benefit from this momentum to achieve significant gains.
Lastly, positive news or new partnerships could act as a catalyst. Announcements about institutional partnerships or the adoption of Algorand's technologies in major projects could increase investor confidence and boost demand for the currency.
However, it is important to note that reaching the $0.70 level depends on the continuity of these supportive factors. Investors should be cautious of potential risks, such as sudden market fluctuations, and consider monitoring key support levels while employing stop-loss strategies to minimize potential losses.

#ALGOUSDT ( double bottom )According to the kinetic shape of the candles,
can hope for the formation of a double bottom pattern.
The middle line of the green channel at the red flash point
can be the entry boundary to the roof of the green channel.

ALGO/USDT - double bottom - retest and long trade potential
I had planned to enter the trade with a strong breakout and then a retest. Such a strong breakout is a positive indicator for a long trade to be taken. Now it's time to wait for the price to reach the breakout area. If this trade is stopped, I can plan a second long trade from the fibbonacci 0.618 region of the last wave with the 2-618 formation.

ALGOUSDT LONGThis is my random guess for ALGO this cycle. I am predicting a short term high of around $5 by the end of January 2025 and a final blow off top somewhere between $15 and $20 by October/November 2025. The volume for this move is massive and it would be very unwise to fade it IMO. I also don't think this is just old retail coming back. It might be because of the rumour that Trump has said there will be no capital gains on US cryptos (they have all gone parabolic in the last few weeks) or it might be because there is some big news coming. ALGO has been focusing on institutional and government adoption whilst the other L1s have been focusing on retail - maybe it will host a CBDC or something equivalent...

ALGOUSDT (Algorand) Updated till 29-11-24ALGOUSDT (Algorand) Daily timeframe range. its working like absolute beast here. with this volume outperforming many alts out there. pin point close to break 0.4562. a clean close above can push it to 0.6156 and beyond. recent support at 0.3328.

Algorand Undergoing Bearish Pressure; 2025 On Sight (GREEN!)ALGOUSDT (Algorand) has already undergone very strong bearish action, but the bears are not letting go, not yet.
On the 27th of September the chart produced an inverted hammer as a candlestick pattern, a very strong bearish signal. There was an attempt to push prices higher but sellers were ready to exit their positions and a bullish session ended up as bearish, that's the hammer.
Then again on the 21st of October another inverted hammer showed up with a big real body on the candle. A lower high, buyers were trying to produce a relief rally as some other pairs did but sellers were too many and a green session ended up red.
Two attempts at higher prices failed. Now we see how ALGOUSDT is trading at a critical support line, seeing the previous selling pressure, we know this level is more likely than not to break. If it breaks, when it breaks, prices are headed toward next support. There is the chance of a long-term higher low or even a lower low on a wick, this doesn't change the fact that this is the last drop.
2025 is now on sight. The market is going green. The end of the correction is close.
Algorand produced decent growth in late 2023/early 2024, 300%. This is nothing compared to the 2025 bull-market, we will see many times that number so get ready. The low prices that will come in the coming days will be an opportunity, the last chance to buy low before maximum growth.
Thank you for reading.
You are appreciated.
Remember, we all mistakes; we are going through live not knowing who we are or where we come from, but this doesn't stop us from learning, adapting, growing and forging ahead. We learn from these mistakes and grow and this growth will finally lead to the moment when we reach our goals. The realization that we are more than a physical body, we are a manifestation of the living Spirit, an eternally living Soul.
Namaste.

#ALGO: Capitalizing on Scalable Blockchain TechDescription:
This trading idea highlights ALGO, the native cryptocurrency of the Algorand blockchain, a highly scalable and secure network designed for decentralized applications (dApps) and digital economies. ALGO powers a blockchain that achieves high performance with low transaction fees and a commitment to sustainability through its proof-of-stake (PoS) consensus mechanism. Algorand has positioned itself as a leader in enterprise-grade blockchain adoption, forging partnerships with governments, institutions, and developers worldwide. With growing use cases in DeFi, NFTs, and cross-border payments, ALGO is well-poised to benefit from the expanding blockchain ecosystem.
However, like all cryptocurrencies, ALGO is subject to high market volatility, regulatory changes, and fluctuations in global sentiment. Investing in digital assets involves substantial risks, and it is essential to exercise caution and adopt sound risk management strategies when trading ALGO or similar assets.
Disclaimer:
This trading idea is for educational purposes only and does not constitute financial advice. Cryptocurrency investments, including ALGO, carry significant risks, including the possibility of losing your entire investment. Conduct thorough research, consider your financial situation, and consult with a financial advisor before making any investment decisions. Past performance is not indicative of future results.
