ALGO/USDT "Double Bottom?"Hey guys 👋
Another coin that caught our attention here is ALGO coin with a great potential for a bullish movement here to happen soon! Waiting for the outcome which can result to at least 20% growth!
If you like ideas provided by our team you can show us your support by liking and commenting.
Yours Sincerely,
Swallow Team 🔱
Disclamer:
We are not financial advisors. The content that we share on this website are for educational purposes and are our own personal opinions.
Market insights

ALGORAND - Massively bullish, 100% upside potentialALGORAND has recently come out of a downtrend... and currently facing resistance around the 0.225 - 0.24$$ region.
the question is what is the safe entry for this?
the token has extremely strong support at the 0.21$ region, an aggressive entry can be taken around 0.215 - 0.21 $
A safer entry can be looked at around the 0.19 - 0.2$ region. This entry can be achieved if BTC retraces back to 29000$ level before continuing its journey to 38 - 40,000 $ level.
after that is a rocket ride.
let's see if PA takes turn in our side

LONG ALGO UPDATEAbove is the chart describing potential swing trade on algorand I mentioned before. Very low risk, stopping if confirms break to the downside

ALGOUSDT - 15m - Bearish IdeaThe declining trend may continue given the trend line holds. The entry point is made on the expected fib retracement level.

ALGOUSDT on daily support, likely to head up to 0.206-0.210This one is also on daily support and likely to bounce from here. It may dip below the support for a while but anyways a long towards daily resistance looks favorable here. The daily resistance is sitting around 0.206-0.210 zone.

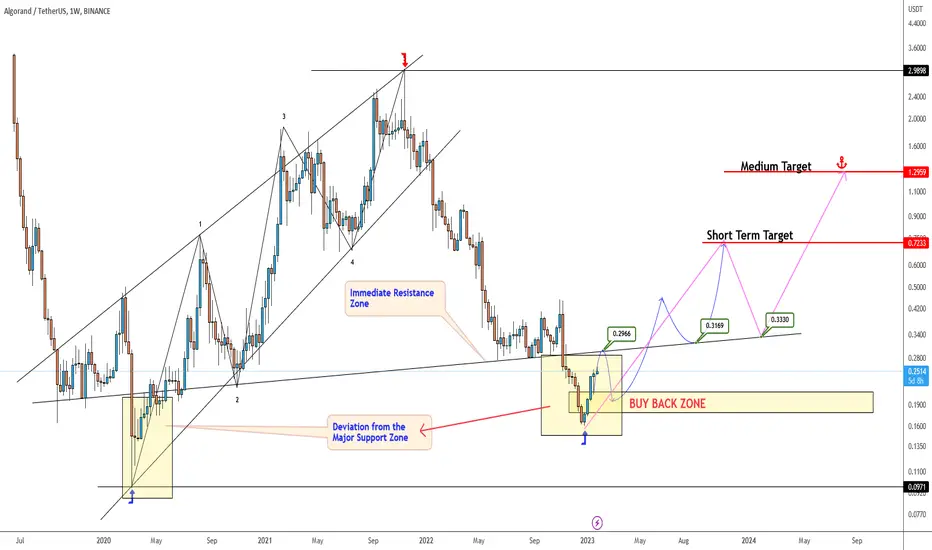
Algousdt Trading opportunityAlgo make massive drop from ATH and found bottom around 78.6% and 88.6% fib retracement level.
We should focus more on immediate resistance zone and expect price to flip it and make it to become support.
Buy back zone is a good zone to pick some bags.

Algo Bulls Need FuelLooking at Algorand/USDT 4H on Binance, it seems like there is a long road ahead for ALGO bulls.
We see two recent rejects at the .5 FIB / $.24. The retracement found support on the 200MA but the subsequent bounce was unable to fully recapture the .382 FIB at $.225. I'd expect some chop between the 200MA & .382 then a drop down towards $.21.
With the two rejections in place at $.24 and little volume supporting the 200MA bounce, I'm generally bearish in the short & long term on Algo. The volume spike that drove it from $.19 to $.24 seems anomalous and without any real momentum.
Should bulls get the fuel they need from somewhere in the ecosystem, its a tough road towards the long time resistance at $.26 (white line). I'd expect multiple attempts & failures at recapturing that level, especially with the .618 so close to it. With so many other charts & cryptos showing bullish indicators, Algo is a tough technical sell in current form.

$ALGO - rise up .. long time no see my friend.
algo bulls would be hoping the longer the accumalation the bigger the pump innit ??
anyways bid as close to blue line or .2050 and stop tad under it
tbh looked at algo cause i figured the risk would be the least
if you're an algo hodler id say try doing a 3x on your spot bags defo get more than staking it or hodling
lets see how this goes not getting a bag just recon its time this started doing something ...
wide stop .2016 or 8% from here
tighter .2048
target blue line or 144%
opening on this a separate account so either i get stopped or target hits ( patience needed )


ALGOUSDT LONGDYOR
ALGO looking good to buy/long in Demand area
GoodLuck guys !
*Follow for another Signal, free!

Algo going down (Short)Supports do not seem to be holding the price resumption downward. I expect the next support to be at 4h timeframe entry price area.
NFA

Algo LongEase run back to the premium zone. Why not, the world is going crazy this should just push to new highs.

ALGOUSDT, Rising Triangle...Hello guys.
ALGOUSDT in Daily TF.
Look for rising triangle in chart...
Thanks.

ALGOUSDT great RRAlgo stands at the double Fibonacci support, which implies a potential short-term rally throughout this week. A new lower low will immediately invalidate bullish outlook, but for now things are looking bright for ALGO.

ALGO ready to go down! (Short)After a minor pullback to change of character area, I expect a liquidity grab from the prior high and go down from there.
NFA

Algorand BullsWonder how this plays out for the SEC, if they have a call record like cramer than this should moon!

Algo/USDT on 4 HR TF4 HR long position, with SL and TP, RSI oversold, Vol comming in weit to breake the suport line. lose smole win big

LONGBUY LIMIT ( Not Now )
EP1: 0.22408
EP2: 0.21880
The stop loss if the 2 entry orders are activated, will be about 5%.
Instead of gambling and entering now The price may return to the entry points shown on the chart
enjoy

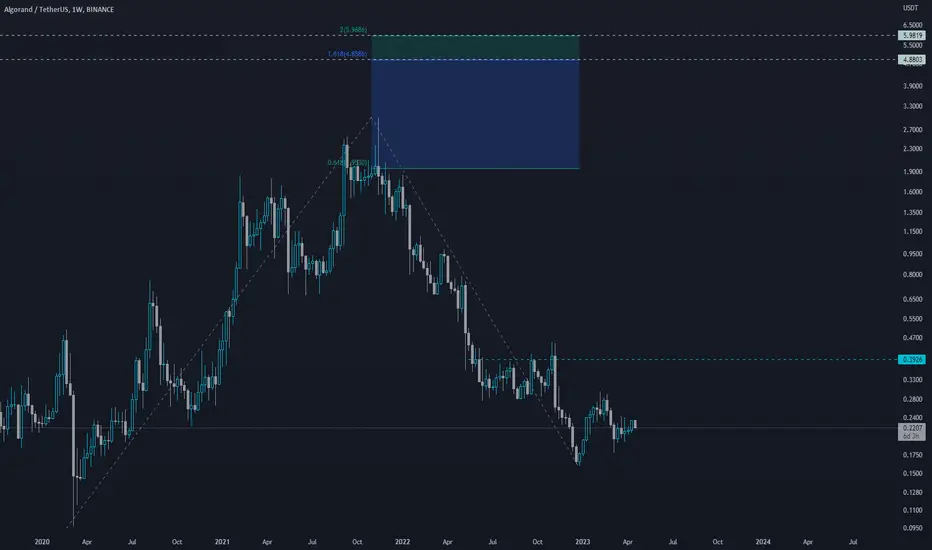
ALGO Short Plan with a few supporting TAOKX:ALGOUSDT
Completeness of Harmonic Pattern with a traditional chart pattern signal.
Break-retest level will be a short plan.
Diagonel support zone which comes from the lowest level of the chart can be a target is also 618 level of the harmonic pattern.
May the force be with you.

ALGOUSDT needs to create a new breakout!BINANCE:ALGOUSDT is currently testing the weekly resistance level at the 0.23 USD area, which is an important level to watch as it has acted as resistance in the past. A breakout above this level could signal a bullish trend continuation, as it would indicate that buyers are willing to push the price higher despite the resistance. Traders may want to wait for a breakout above this level and a retest of this area as new support before considering a long position.
According to Plancton's rules, if there is a breakout above the 0.23 USD area, it would suggest a new long position as it indicates a potential trend reversal to the upside. This rule suggests that traders may want to consider entering a long position in anticipation of a potential price increase.
Overall, the market sentiment for ALGOUSDT appears to be bullish, with the potential for a breakout above the weekly resistance level at the 0.23 USD area.
–––––
Follow the Shrimp 🦐
Keep in mind.
🟣 Purple structure -> Monthly structure.
🔴 Red structure -> Weekly structure.
🔵 Blue structure -> Daily structure.
🟡 Yellow structure -> 4h structure.
⚫️ Black structure -> <= 1h structure.
Follow the Shrimp 🦐
