ALGO Waiting ✋for complete pattern ☕🖐☕Hi dear traders
As you saw in previous analysis we take profit 📈full target ✅
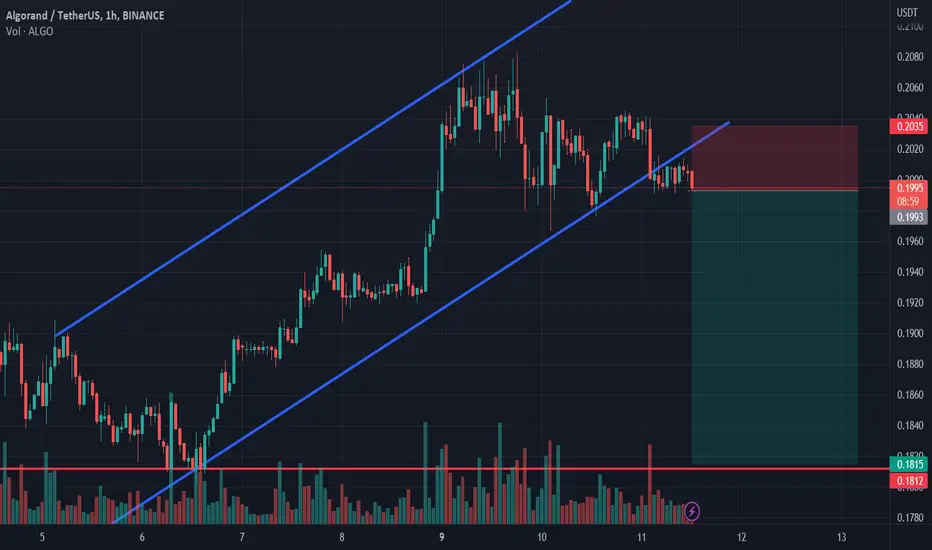
After climbing 19.54%, the price is now correcting.
If it stays above 0.1717, it will correct around 9.63%.
Now it's seems Cup and Handel forming.
The cup pattern is formed and we are waiting for the formation of the handle.
If the pattern is confirmed, the price can climb up to the resistance area of 0.2126.
We have to wait for the market's reaction.
If BTC rises, altcoins will also start to rise.
ALGO is unpredictable, but we can take a good swing and earn profit in both the bearish and bullish cases.
Waiting for breakout and pullback completed for long position.
Let's see what happens
This is not financial advice ( DYOR )
Good luck
ALGOUSDT trade ideas

Algorand shortAlgorand broke trough off the lower boundary of ascending channel. Bearish movement to support level at 0.1815 is expected to happen.
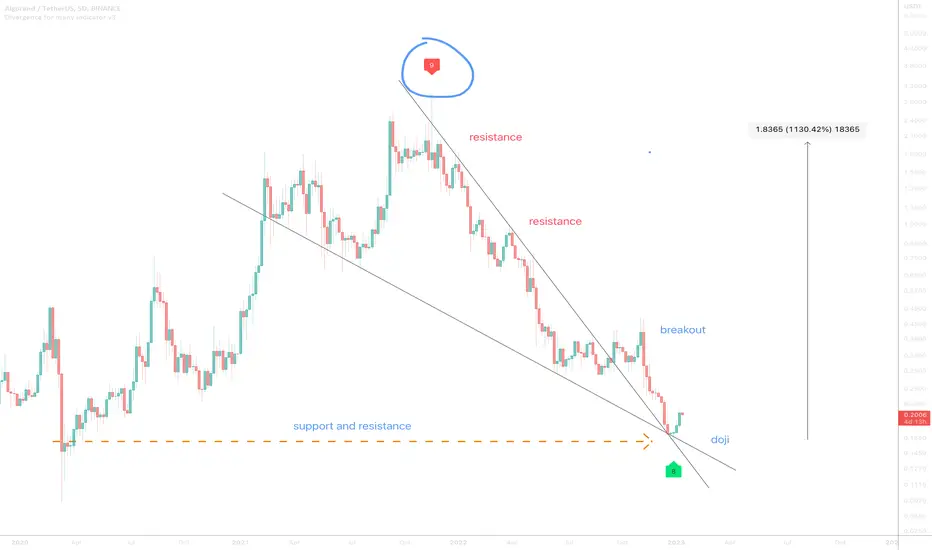
Algorand (ALGO) to $2On the above 5-day chart price action has corrected over 90% since the beautiful sell signal (not shown) on September 2021 @ $2.40. Now is an excellent long moment. Why?
1) A strong buy signal (not shown).
2) Price action is printing as support on past resistance, look left.
3) Regular bullish divergence. Lots of it. Do not ignore.
4) Dragonfly DOJI candle.
Is it possible price action falls further? Sure.
Is it probable? No.
Ww
Type: trade
Risk: <=6% of portfolio
Timeframe: Don’t know.
Return: 10x
ALGO/USDT breaking out!ALGORAND is currently busy to break the bullish pennant structure. after a breakout we can take profit at the 3 boxes I have drawn in

ALGOUSDT - Long by Supertrend, ADX & MA 1/10/20231. ADX INDICATOR: 1h & 4h timeframe have a strong strength for open trade.
- ADX smoothing: 14.
- DI length: 14.
- ADX STRONG > 25.
2. SUPERTREND INDICATOR:
- Long trend when closes candle is above the green line.
3. MOVING AVERAGE INDICATOR:50
- Long trend when closes candle is above MA line.
- BUY/LONG: reject to Supertrend at current timeframe.

Homework ALGO STRATAneed to work more on it
Market Cap:
875.79 B USD
3.24%
24h Volume:
1.47 T USD
1.84%
BTC Dominance:
37.92%

ALGO HOMEWORk long shortloh pidr nado zanovo
Market Cap:
875.79 B USD
3.24%
24h Volume:
1.47 T USD
1.84%
BTC Dominance:
37.92%

4 level touches. Getting ready to fall!The coin has grown well. The price approaches the local maximum around 0.1956. We see weakness on the part of buyers, large red candles and shadows. I expect a pin of 0.195 and a rebound from that level below. In support, an oblique level with 4 touches has formed, the next approach may be the final one before the breakdown. PoC Volume Level Targets

Algo / usdt ( forming sell setup! ) 😥Algo / usdt , his making sell setup for now , and I think it can be crashed here at least 4% down!
Be careful and don't trade like me with high leverages!

ALGO Descending Wedge 👇⏰👇⏰👇Hi dear traders
Descending Wedge forming and we can see bullish divergence between price and RSI.
If breakout correctly we can entery for long position.
All targets specified.
Waiting ✋ for breakout.
Let's see what happens.
This is not financial advice ( DYOR )
Good luck

AlgousdtAlgo Formed Falling Wedge In H4 Timeframe( Bulish Reversal Chart Pattern)
Rsi Printed Massive Bulish divergence ( Bulish Divergence In Rsi Is Also Bulish sign)
Now Algo Needs To Break Wedge To The Upside Then We Can Look For Long Entries
Keep In Mind That Algo Will Remain Bearish Till Wedge Upside Breakout

Algorand longAlgorand broke trough the resistance level. Asset broke trough the descending trendline. Bullish movement to resistance level at 0.213 is possible.

ALGO is looking better than it ever has!This is literally just screaming to be bought. Right now is 1 of only 3 brief periods in ALGO'S history where you could buy at this low of a price. If you buy now then you're buying cheaper than 99% of everyone who's ever bought.
That's called an opportunity, and opportunities like this don't happen very often.
Lead, don't follow!

Right now is the 2nd best time to buy ALGO ever!This is one of only 3 brief periods of time where you could buy ALGO at these levels since its creation. This is beyond a doubt the least risky, ISO 20020 compliant coin on the market.

ALGO USDT (4 hour)Hi guyz
As you can see, we see a divergence
Also, the validly formed upward channel has been broken by the price.
Also, by examining the 1-hour cloud, we see a break of the 1-hour cloud to the upside.
The price in the two-hour chart has also managed to enter the cloud, and there is a possibility of touching the cloud ceiling.
In this case, you can enter into a transaction with less risk, of course, for fluctuation.
The first resistance of this currency is 0.1731, and we expect a partial correction from this area.


ALGO WAVESHello, I hope you are well
I think the pattern is inside a diametric diamond, which still has wave e, f, and g, and the price correction of this symbol is not over. I have such a view on this symbol for a short time
Comment if you have any questions
Thank You

ALGO completes the handleNow there is panic, the bears are slowly running out of steam. In the meantime, charts are drawing future trends.
Not a recommendation. Do your own research.

ALGOUSDT 15min bullish#ALGOUSDT
seems Easy Measy for you...you poor thing
if you don't hit that "rocket" button, you will loose all your money!!
#stop_being_poor

$ALGo after eon's this looks ready for a face melting 10% pump
deviation below red line imo so stop below there targeting white line
stoch crossing gives me hope

SELL SETUP ON ALGOUSDTAccording to 4Hr Time frame trend the market is Bearish signal on Algo , I am expecting the Target as mentioned in chart. Don't use leverage more than 3X. This is not the financial Idea.

algo can go upHi, dear traders. how are you ? Today we have a viewpoint to BUY/LONG the ALGO symbol.
For risk management, please don't forget stop loss and capital management
When we reach the first target, save some profit and then change the stop to entry
Comment if you have any questions
Thank You

Buy yourself some ALGO for ChristmasAlgorand is one of the most sustainable blockchains.
Algorand was always my favorite blockchain. And it will always be my favorite coin to invest in.
Technical Analysis speaking, ALGO is trading at the bottom, it could go lower, but this is still a very good entry. And also, there are reversal signs with ALGOUSD when you look at the 1H chart.
Long term plan is to buy a small among of ALGO here and then buy some more at $0.1 (if we ever get there). And the short-term plan is to go LONG here with a tight stop-loss.
Long Scalping Setup:
Entry: 0.17x
Sl: 0.16
Tp: 0.19
