How ALGO Can Prolong The Ongoing Recovery?Gradual Growth in Bullish Momentum: ALGO's price trend shows a steady increase in bullish momentum, hinting at an upcoming breakout rally.
Rounding Bottom Formation: The 4-hour chart reveals a rounding bottom pattern, indicating a potential exit from short-term consolidation.
Potential for a 20% Jump: A breakout could lead ALGO's price to rise to $0.1717, a 20% increase.
Altcoin Market Recovery Anticipations: With the altcoin market gaining momentum, there's heightened anticipation for market recovery.
Bullish Turnaround in Consolidation Range: ALGO displays a bullish turnaround within its current consolidation range.
Trend Continuation Pattern: Analysis suggests a high likelihood of the prevailing uptrend continuing.
Increased Trading Volume: A surge in trading volume supports the possibility of a speedy upward move.
Consolidation Range Between $0.12 and $0.15: The price has been moving within a consolidation range, showing volatility.
Higher Low Formations Near 200 EMA: Frequent higher low formations near the 200 EMA suggest strong demand.
Current Trading Price: ALGO is trading at $0.1415, following a 4.26% jump, with an intraday growth of 1.51%.
Technical Indicators - RSI and EMA: The RSI is nearing the overbought boundary, and a potential golden crossover between the 50-day and 200-day EMAs is on the horizon.
Breakout Rally to $0.15: The formation of a rounding bottom pattern suggests a breakout rally that could challenge the $0.15 mark.
Downside Risk: A reversal from key levels could see a retest of the 200 EMA at $0.1277.
ALGUSD trade ideas

same but 4hr #ALGO viewALGO is tricky due to the tokenomics ie the early investors got special privileges to sell at reduce loss etc etc etc. (token was released at sever dollers like 4usd or some such) the good news is this is a MIT sponsored project thats def on the short list to be used by some government for some project at some point
T and A looks strong and shes long time due for a run. a lot of old school support at .25 to .33 so there is room for a run b4 the long term HODLers wake up to take profits/break even

same as last post just 1 month #ALGO viewALGO is tricky due to the tokenomics ie the early investors got special privileges to sell at reduce loss etc etc etc. (token was released at sever dollers like 4usd or some such) the good news is this is a MIT sponsored project thats def on the short list to be used by some government for some project at some point
T and A looks strong and shes long time due for a run. a lot of old school support at .25 to .33 so there is room for a run b4 the long term HODLers wake up to take profits/break even

Wedge on AlgoHere price has been consolidating in a descending wedge. This can be a reversal pattern. BTC halving next April/May. I have been buying in the 9.5 to 11 cent range and will continue to buy if price heads to the lower trend line. Not financial advise.

Breakout ALGOPrice broke out of the decending wedge and retested the upper trend line. 200 EMA is around .1435.

ALGORAND Update, time to start buying it?I was wrong on my prevoius idea, it wass maybe too early for ALGO to fly. But the hot zone i marked as resistance and support has worked nicely. We are back to resistance and i think Algorand has enough strength to flip it to support and fly high in the mid term. 0.2 is my target before end of the year

ALGO Long UpdateUpdating my long position on ALGORAND. So far so good, that's what i want to see to continue the good uptrend. In daily TF we are in strong bull trend. Big support (big rectangle) and small resistance to breake.

Will ALGO Shine Brighter This Year?Bullish Sustenance: ALGO displays bullish sustenance above the 200-day Exponential Moving Average (EMA).
Golden Crossover Potential: There is a high possibility of a golden crossover due to the rising 50-day EMA.
Uptrend Momentum: ALGO price could cross the 200-day EMA if the current uptrend maintains its momentum.
Impact of US SEC Decision: The US SEC's nearing decision on the Bitcoin ETF is influencing the market, with Bitcoin sustaining the $36,000 mark.
Altcoin Market Recovery: With the altcoin market turning bullish, Algorand showed resilience, rebounding from the $2.3 support.
Bullish Reversal Pattern: The formation of a rounding bottom pattern indicates a bullish reversal and a new recovery phase for ALGO.
Significant Price Recovery: Over the past month, ALGO has seen a steep recovery, jumping from $0.0877 to $0.148, a 69.2% increase.
Breakout and Recovery: Post-breakout, ALGO reached a four-month high of $0.1452, indicating a solid recovery trend.
Rounding Bottom Pattern: This pattern suggests a transition from a downtrend to a sustainable recovery, with a potential price target of $0.03.
Technical Indicators: The daily Relative Strength Index (RSI) is near the overbought boundary, and the 50-day EMA is rising, indicating bullish momentum.
Sustainment Above 200-day EMA: The analysis questions if ALGO can sustain its jump above the 200-day EMA amidst the recovery rally.
Retracement Levels as Safeguards: The 38.2% and 58% Fibonacci retracement levels are identified as potential safeguard or stop-loss levels in case of pullbacks.

ALGO Update, back on entry?Nice profits on ALGORAND. Price is in resistance zone, will ALGO pull back to entry before go up again or it will keep going up? Let's see, stop on BE is a good idea

ALGORAND Long Limit IdeasALGORAND, one of my top pick, it's clearly going to retest 0.13 level. From there i expect a powerful bull run till 0.25 usd, around 2x from the entry. Good spot and leverage opportunity

I see abc's algo coiling for a big move to the upside, so far its done 4 abc structures so a wave 3 is going to be a sight to behold, most likely a 100%+ move in one day there could be more abc structures develop before the main wave 3
NFA
y axis only

ALGO undervaluedAlgo looks very undervalued from here. Hit Covid lowest level
Clearly formed a bottom cycle

Historic Moment For Algorand Algorand is at a historic moment regaining the 13.5 cent support area.
Weekly & Monthly chart are showing potential for a big rally.
This coins ATH is $3.15 or 23x the current price.
Take a look at that squeeze on the Bollinger Bands!
Price has been very suppressed on this project if you look at the larger timeframes. The boom/bust cycle symmetry is there and there is now potential for exponential growth!
TV please don't delete my post! This chart has the potential to age very well! Always invest at your own risk! Im basing this trade over the next 3 to 12 months.
Don't sleep on Algo!

Ready and waiting my friends. Perspective is promising.Sometimes you need a better view of the market.
Waiting patiently for months and continue to hold and buy weekly.
TA is useless so just prepare and HODL with patience.
Algorand has a level to reach before 2024. This level is needed for
a higher high in the bull market.

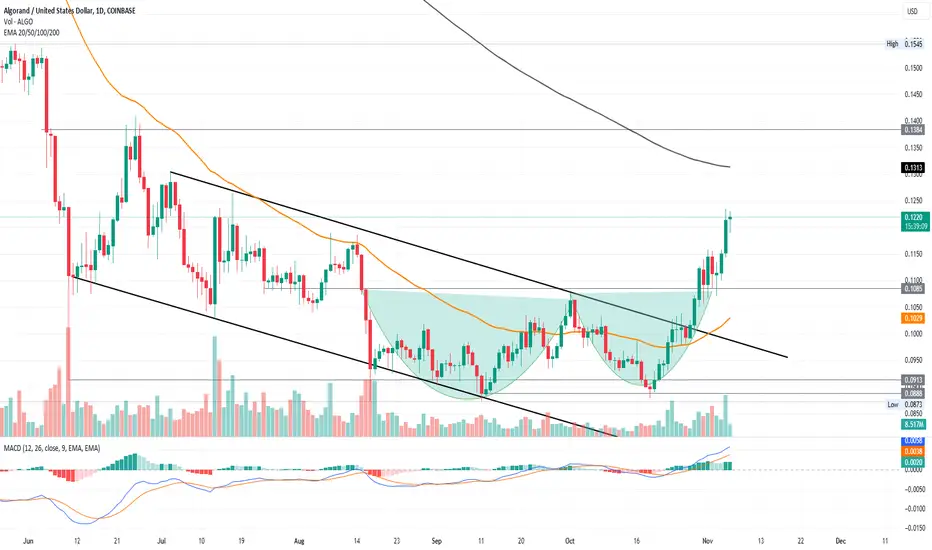
Will ALGO price cross above the 200-day EMA?Channel Breakout: ALGO's price action indicates a bullish channel breakout, eyeing the 200-day EMA.
Golden Crossover: The 50-day EMA's rise hints at an impending golden crossover, a bullish signal.
Market Performance: Algorand emerges as a top gainer, reflecting a positive market sentiment.
Technical Indicators - MACD: The MACD's bullish trend in positive territory suggests strong momentum.
Technical Indicators - EMA: The 50-day EMA's potential crossover with the 200-day EMA could provide dynamic support.
Intraday Trading: ALGO is trading at $0.1205, with a significant 5.47% overnight increase.
Upside Potential: A sustained move above the 200-day EMA could propel ALGO towards the $0.15 level.
Downside Risk: Any pullback from the 200-day EMA might see ALGO revisiting the $0.10 support zone.
#ALGO SPRING Phase! - Macro WyckoffA Descending wedge is taking place and the squeeze is coming in tight.
Im currently 50/50 and dont know how far the C leg is going to be pushed down, but this ISO20022 COIN will definitely be on the pass list when regulations come in.
i smell 1 more fear narrative in Fall 2023 for the last nail in the coffin.
There is going be a massive push up and some grinding along the way.
IMO, SPRING Phase is in!.
BUY!

My wife says DCA pullback incoming. ??????????I am not too sure if this will happen.
My wife is the swing trader i am the macro investor so its a coin flip in my opinion.
I will hold and wait to buy anymore until i have confirmation. The wife is much
smarter than me.

Is Algorand ready to hit the $013 mark?Current Status: ALGO is trading at $0.1063, with a recent overnight jump of 4.72%.
Resistance Level: The $0.1085 mark serves as a significant resistance level for ALGO.
Technical Indicators - MACD: Rising MACD and signal lines, along with growing bullish histograms, indicate increased buying pressure.
Technical Indicators - EMA: The bullish breakout of the 50-day EMA suggests a possible golden crossover with the 200-day EMA.
Recent Performance: ALGO has broken its short-term downtrend, rising from $0.088 and surpassing the 50-day EMA.
Potential Targets: If ALGO breaks the $0.1085 resistance, it could aim for $0.1327.
Downside Risk: A reversal from $0.1085 could lead to a drop to the 50-day EMA at $0.0987.
Market Sentiment: Overall sentiment is bullish, especially if ALGO can break the $0.1085 resistance.
Long-Term Trend: ALGO has reversed its short-term downtrend and is now showcasing a rounding bottom pattern.
Market Catalysts: The overall recovering conditions in the crypto market could boost investor confidence in altcoins like ALGO.
Long-Term Outlook: Algorand price predictions are optimistic, given the improving market conditions and technical indicators.

Xpress deliveryHigh demand for the future.
Every sign is clear.
Socially depressed from a psychological market.
Patterns and technicals are signaling bull market.
TA will not prepare you for this amazing journey ahead.
Hodl strong.

ALGOlooks like a massive ABC bullish correction. For now I think a correction to the box shaded area is likely. But into late 2024 early 2025 I think we see many strong impulsive wave counts taking ALGO over $7


Will ALGO Price Sustain Above $0.088?Declining Trend: ALGO price action shows a downward trend in the daily chart.
Critical $0.10 Mark: ALGO fails to sustain above the $0.10 level, indicating bearish pressure.
Bounce-Back Potential: A rebound from $0.088 could retest the $0.10 ceiling.
Current Price: ALGO is trading at $0.090, forming a Doji candle.
Resistance Trendline: A resistance trendline in the daily chart is limiting upward movement.
RSI Indicator: A minor bullish divergence in RSI suggests a potential comeback for ALGO.
50-Day EMA: The price fails to sustain above the 50-day EMA, indicating bearish momentum.
Morning Star: The Doji candle hints at a possible morning star pattern, appealing to sideline traders.
Optimistic Scenario: If ALGO sustains above $0.088, it could reclaim momentum and potentially cross $0.15 this October.
Pessimistic Scenario: If ALGO fails to regain upward momentum, it could reach a new low of $0.081.
Market-Wide Recovery: Growing expectations of a market-wide recovery could positively impact ALGO.
Distribution Phase: Despite the Uptober season, ALGO faces intense selling pressure, leading to another distribution phase.

ALGO Possible Falling wedge pattern. If algo can get back above both horizontal resistances. It's got a good shot of some positive momentum. Looks to be forming a massive falling wedge and it's getting Tighter and Tighter Plus I'll go looks to be at the end of the downwave as it's been falling forever. It looks like a very low risk opportunity. Would like to see more positive momentum especially getting back above at c19 low
