ALPHA/USDT WCA - Inverted Head and Shoulders PatternHello and thank you for taking the time to read my post. Today, we analyze the ALPHA/USDT chart on the weekly scale, focusing on a classic price pattern called the "Inverted Head and Shoulders Pattern."
Inverted Head and Shoulders Pattern:
The inverted head and shoulders pattern is a bullish reversal pattern that occurs at the end of a downtrend. It is characterized by three troughs or valleys, with the middle one being the lowest (the head) and the two on either side being relatively higher (the shoulders). The pattern is completed by a horizontal line called the "neckline," which connects the highs of the shoulders. In a nutshell, the formation of the inverted head and shoulders pattern signals a potential reversal from a downtrend to an uptrend.
Remember, this is just a brief introduction to the technical aspects of the inverted head and shoulders pattern. As you delve deeper into this topic, you'll discover more nuances and practical applications that can enhance your trading strategies.
Additional Analysis:
As we carefully study the ALPHA/USDT weekly chart (Binance), a diagonal resistance line (blue) emerges, which began on 01/02/2021 and has been acting as a staunch barrier ever since. Another key observation is the 50 EMA still displaying its resistance role, indicating that we should focus on observing rather than trading. The neckline, a vital element of this pattern, has formed in the price area of 0.1831 and is now 350 days old, which corresponds to 11.5 months. This insight is crucial as the longer a price pattern consolidates, the more forceful the breakout will be when it eventually occurs.
The near-perfect symmetry between the shoulders adds an artistic touch to the pattern, and we can also observe positive momentum in the form of a bullish engulfing above the symmetry line. For intrepid traders, this could represent an early entry opportunity, with the stop-loss positioned at the symmetry line. However, we advocate waiting for a breakout above the neckline, as the resistance is undoubtedly formidable. In this case, patience is truly a virtue. Thus, this pattern is more suited as a watchlist candidate than an active trade to enter at this time.
Conclusion:
The ALPHA/USDT weekly chart showcases an Inverted Head and Shoulders Pattern, reflecting a potential reversal from a downtrend to an uptrend. By closely monitoring the pattern's intricacies and the market's subtle cues, traders can be better prepared for any potential price action in the future. As always, it's essential to consider risk management and proper position sizing when trading based on chart patterns.
Please note that this analysis is not financial advice. Always do your own due diligence when investing or trading.
If you found this analysis helpful, please like, share, and follow for more updates. Happy trading!
Best regards,
Karim Subhieh
Market insights

ALPHA CAN GO UP AGAINHi, dear traders. how are you ? Today we have a viewpoint to BUY/LONG the ALPHA symbol.
For risk management, please don't forget stop loss and capital management
When we reach the first target, save some profit and then change the stop to entry
Comment if you have any questions
Thank You

ALPHA! be wild in the next few monthssitting at the lower band of the pitchfork. expecting to touch the upper band. Low marketcap, expect a wild pump in the next few weeks

ALPHA : CHART VIEWInteresting to follow ALPHA to see if it's able to gain the 10-18% range for the day trading in the coming time.
The trend should have first a time frame confirmation before it can gain.

Alpha Venture DAO (ALPHA) - Bullish divergenceOn the above 2-day chart price action has corrected a whopping 95% since the sell signal in February 2021. A number of reasons now exist to be long, including:
1) The buy signal of course.
2) Price action and RSI resistance breakout with support confirmations.
3) Regular bullish divergence. Eight oscillators are currently printing bullish divergence over a 30 day period. Fantastic.
4) Everything that is said above is also true for the 2-day BTC pair (below).
5) Nudge nudge wink wink. Don’t know what I mean? Shame.
Is it possible price action falls further? Sure.
Is it probable? No.
Ww
Type: trade
Risk: <=6% of portfolio
Timeframe: 3 - 18 months
Return: 10x minimum 15x likely
2-day BTC pair

ALPHA/USDT SHORT 🔴ALPHA/USDT SHORT 🔴
leverage 10x
Entry price- 0.1270$
Take profit- 0.1136$
Stop loss- 0.1325$
Stop loss important
@msrcrypto1

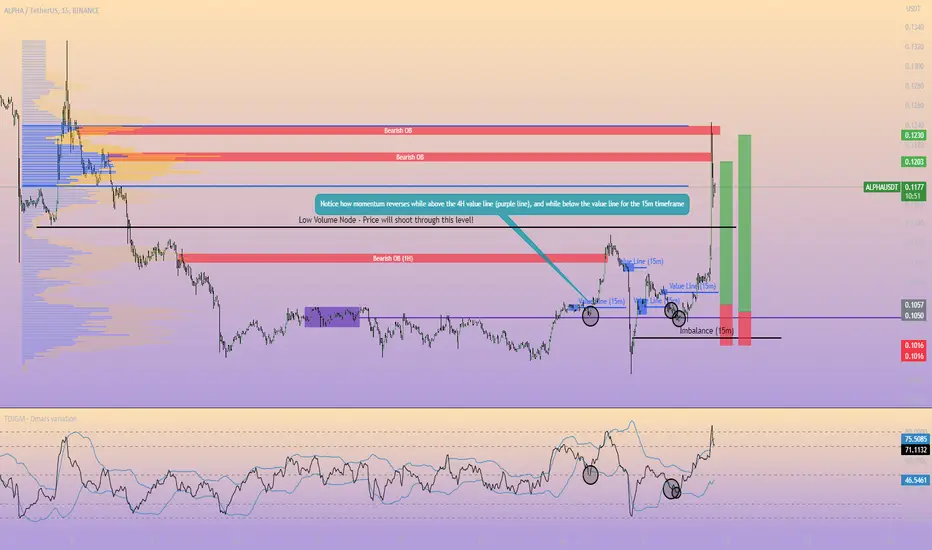
How To Trade Like The InstitutionsI wanted to prove that you can genuenly use some good trading concepts to catch trades in the market. The market is chaotic, but it's not totally random. It's an efficient market that tries to price everything as well as possible!
I used the Volume Profile from the session before the pump to find out value area (where there is most liquidity). Furthermore I found a Low Volume Node. This is a place where there is little liquidity, I know that price will shoot through this level to the next level of liquidity!
I furthermore detected some bearish Order Blocks to aim for as I am looking for longs.
The reason you would be looking for longs, is because that price was trading above the 4H value line (center of contraction). This is typically a higher low, followed by a lower high (or vice versa).
Another important aspect is to go to a lower timeframe, where you can react faster to changes in momentum. Here I used the 15m timeframe to draw more value lines.
Whenever price is below a value line for the smaller timeframe, but above the one for the higher timeframe, we wait for momentum to give us a long.
The changes in momentum for longs are marked in the circles.
By doing this, you can accumulate a lot of good setups. Your targets are typically the high levels of liquidity of the volume profile, the value area and the bearish orderblocks.
Make sure to also look for imbalances, I have linked a previous setup where this was done.
ALPHA on an alpha setup (pun intended, no? ok) lovely lovely lovely 4H pattern which usually ends up with an impulse to the upside. U ready? don't get rekt trade safe hah

Short Setup for ALPHAOKX:ALPHAUSDT
I know I am sharing short setup recently but I trade what I see :)
Two harmonic Setup cross in the box and price action signal is our hand in this case.
Retest time and ready to execute...
Good Luck Everyone.


✴️ Alpha Lab Finance | 365% Growth PotentialHere is another one I found, I shared it vs Bitcoin.
Hadn't done a trade for ALPHABTC since early 2021 so its been a while.
This is the Tether pair but we are entering the everything grows phase so it should be easy to see them all move upwards together.
The chart is the same as hundreds and hundreds of Altcoins that I've shown you, literally.
The 5-Step pattern, the initial 2023 bullish breakout, the correction ending mid-March etc.
All this supported by a bullish cosmic planetary alignment.
All the bullish signals coming from these charts are supported by the fact that the stars are also saying up/growth/go ahead.
When everything converges to one point, that's likely the way to go. Up! Up! Up!
Namaste.

ALPHAUSDT yet another drop incoming ALPHAUSDT is trading right at the resistance. If that resistance holds, we'll see another downside move, potentially producing a new LL.

ALPHAUSDT#ALPHAUSDT
dont's miss up this opportunity MACD is showing bullish EMAs showing a bullish move EMAs is neutral Parabolic SAR is bullish ZELMA is neutral Fib retracement is showing bullish Accumulation distribution is bullish Awesome oscillator in neutral we are in over sold area buy and hold it to the next targets at the chart
and we have powerful support zone

RR=1.72 Buy ideaBullish crab pattern + Strong RSI divergence
PS : never risk more than 2% of your capital per trade

will alphausdt go up??The coin is now ready to go past the trendline resistance it was facing , after many attempts we can see now it is attempting for breakout.
As we all know,
the most number of times price goes to resistance level the resistance becomes weak and weak so have to watch this thing here too ,
weekly closing is very important for this for good rally.

Alpha small scalpALPHA is trying to break the structure to the upside. BTC might dip more so be careful. Risky one.
NOT A FINANCIAL ADVICE + USE STOPLOSS + MANAGE YOUR RISK

#ALPHAUSDT #LQRUSDT #TOBTC #LqiraProtocolImportant static and fibo level resistance at price $0.1665
resistance fibo level 1.27 at price $0.2155
minor suppoer $0.1155

$ALPHA Possible RSI Breakout$ALPHA is on a textbook bump and run pattern.
The RSI breakout triggers the entry.
Bluelines are targets.


APLPHAUSDT | RESISTANCE BROKENALPHA has been trading in a bearish trend .
The bearish trend was well respected by price trading under the resistance .
The price has been making lower lows and lower highs.
Now after taking support from horizontal zone, the price has broken above the resistance zone .
The bulls can take control from here.
Manage your levels accordingly.

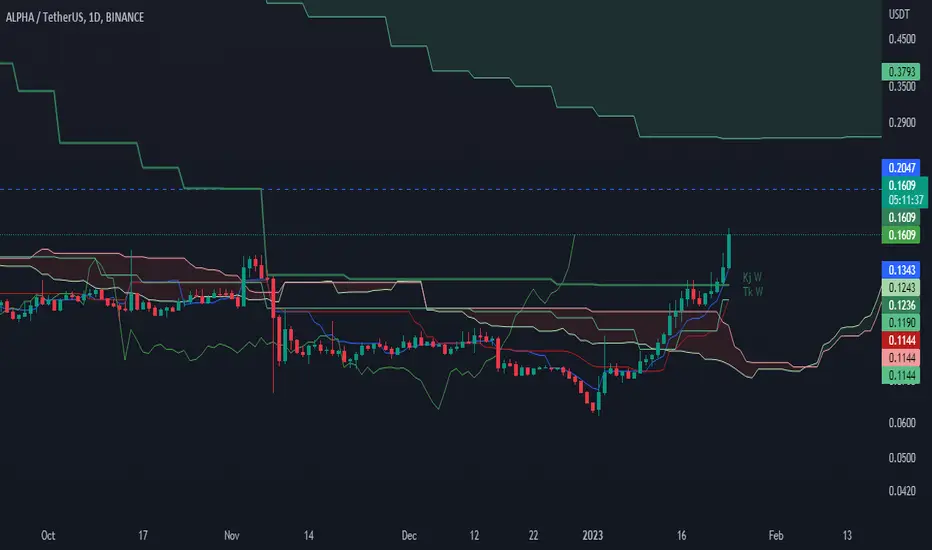
0.2045 is a possible target for ALPHA/USDTHere is the next possible target for ALPHA/USDT, that is a key level on the weekly timeframe (Ichimoku).
ALPHAUSDT is testing the resistanceThe ALPHA/USDT pair appears to have bounced off of a key weekly support level, breaking out of a descending trend. It has retested the previous resistance as support and is currently testing a 4-hour resistance level. The next weekly resistance level could be the next target for price action. Overall, the technical analysis suggests a bullish outlook for the pair in the short-term.
A descending channel is a bearish technical chart pattern that is formed by two downward-sloping trendlines that connect a series of lower highs and lower lows. The pattern is formed when the price action of an asset is moving in a downward direction within the boundaries of these two trendlines. The upper trendline represents the resistance level, while the lower trendline represents the support level. A descending channel is considered a bearish pattern as it indicates that the asset is experiencing a downtrend and that the selling pressure is stronger than the buying pressure. Traders typically look for a break above the upper trendline, or a break below the lower trendline, as a sign of a potential trend reversal.
How to approach it?
We are waiting for a clear breakout of the 4h resistance, According to Plancton's strategy , we can set a nice order
–––––
Keep in mind.
🟣 Purple structure -> Monthly structure.
🔴 Red structure -> Weekly structure.
🔵 Blue structure -> Daily structure.
🟡 Yellow structure -> 4h structure.
⚫️ black structure -> <= 1h structure.
–––––
Follow the Shrimp 🦐

0.20445 is a possible target for ALPHA/USDTIt is pumping since some hours and 0.20445 can be a target for a Long position.
It has been detected by my scanner early this morning :
(UPTREND) All green for #ALPHAUSDT in 5m,15m,1h,2h,4h,6h,12h at 2023-01-24 08:59:24 price=0.1469
