ALT longALT bounced off the support level. Asset broke trough off the descending trendline. Bullish movement to resistance level at 0.506 is possible.
ALTUSDT.P trade ideas

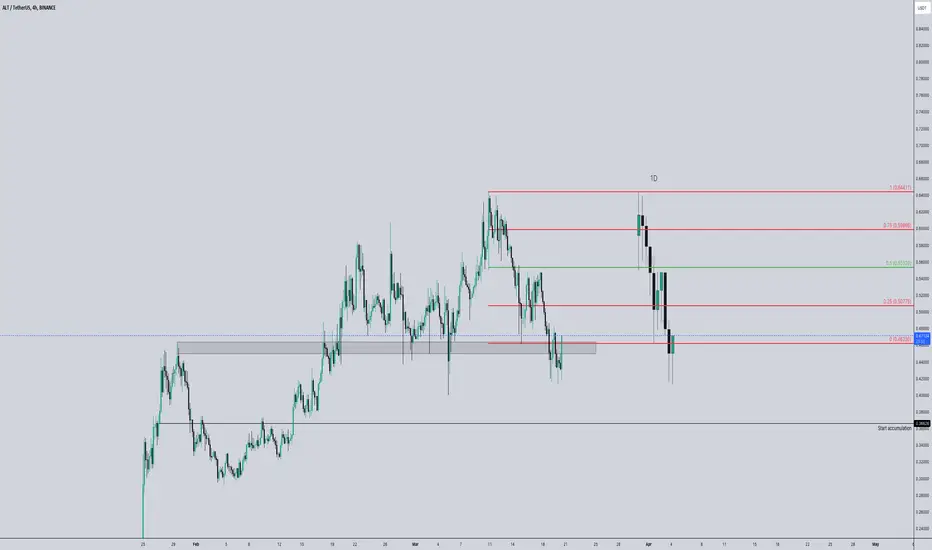
$ALT road to $1 👀Hi.
BINANCE:ALTUSDT
Today, I want to analyze ALT for you in a 6H time frame so that we can have a SHORT-term view of ALT regarding the technical analysis. (Please ✌️respectfully✌️share if you have a different opinion from me or other analysts).
It appears to be moving within a Ascending triangle on the shorter time frame. Currently, it is attempting a breakout. A breakout retest of the triangle would indicate bullish momentum. However, if there is a rejection and a breakdown of the triangle, a bearish move is also expected.
✅ Due to the Ascending structure of the chart...
🟢 High potential areas are clear in the chart.
🟢 AB=CD
🟢Ascending Triangle
Stay awesome my friends.
_ _ _ _ _ _ _ _ _ _ _ _ _ _ _ _ _ _ _ _ _ _ _ _ _ _ _ _ _ _ _ _ _
✅Thank you, and for more ideas, hit ❤️Like❤️ and 🌟Follow🌟!
⚠️Things can change...
The markets are always changing and even with all these signals, the market changes tend to be strong and fast!!

ALTUSDT 12H#ALT is moving inside an ascending channel. RSI is showing bullish momentum. You can put a small risk on it. Targets are:
$0.65
$0.75
$0.83
$0.91
$1.03 risky
$1.17 risky

🔥 ALT Bullish Channel Signal: Patience!In this analysis I want to take a closer look at ALT and the bullish channel it appears to be trading in.
To maximize potential gains (and chances for a bullish reversal), I'm going to wait for the price to reach the bottom support. If BTC reverses in the near future it might be the case that the entry won't be hit, which is fine.
Entry is placed at 0.52 for now, but will be around the bottom support when it's reached.

ALT LONG TRADE IDEALONG or SPOT buy ALT
Entry: Current Market Price
Stop Loss: .467
TP 1: 1.2
TP 2: 2.3
Stop loss at breakeven after TP 1 gets tagged.
Risking 5% of portfolio on this trade

ALT (Altlayer) is getting ready for a BIG PUMP! Do Not Miss it ALT (Altlayer) is getting ready for a jump.
You'll see it soon at 1$.
See My Chart, as soon as my Slant Support (Yellow Line) is claimed then the next target after breaking its ATH (All Time High) is my White Coss and after that the above marked Roof Tops (Blue Horizontal Lines) are expected targets, once ALT will swim in new waters.
BINANCE:ALTUSDT

ALTUSDT.PHello Trader BINANCE:ALTUSDT.P
It's a bit annoying, but for short scalping it's good, short the small resistance area of 0.60405 - 0.61295.
take profit 11%
stop loss 2.6%
Please add a comment and Positive feedback and constructive criticism are important to authors and the community.
Disclamer: Not Financial Advice

ALT USDT - Buy on pullback (especially if BTC pulls back to 64k)ALT USDT has been making higher highs and I don't think its done yet. If BTC is going to pull back to 64k or lower, I think ALTUSDT is a must buy.
Entry: 0.49405 - 0.45522
Targets: 0.547 - 0.603 - 0.85 - 1.00
SL: Will update if needed.

ALT ANALYSIS🔮 #ALT Analysis - Breakout Trading 💰💰
🌟🚀 #ALT was trading in a Ascending Triangle Pattern and here we can see that #ALT is going to breakout the pattern in 12hr time frame. We can expect a long rally in #ALT.💲💲
🔖 Current Price: $0.62750
⏳️ Target Price: $0.80150
⁉️ What to do?
- We have marked crucial levels in the chart . We can trade according to the chart and make some profits. 🚀
#ALT #Cryptocurrency #Breakout #DYOR

ALT - Breakout from the resistance >|||<#ALT/USDT #Analysis
Description
---------------------------------------------------------------
+ The price of ALT is currently hovering around the resistance level, suggesting a potential breakout.
+ If the price manages to successfully breach the resistance level, it presents an opportunity to enter a long position.
+ I plan to initiate a long position once the breakout is confirmed.
---------------------------------------------------------------
VectorAlgo Trade Details
------------------------------
Entry Price: 0.67159
Stop Loss: 0.5388
------------------------------
Target 1: 0.7383
Target 2: 0.7950
Target 3: 0.8173
Target 4: 0.9928
------------------------------
Timeframe: 4H
Capital Risk: 1-2% of trading capital
Leverage: 5-10x
---------------------------------------------------------------
Enhance, Trade, Grow
---------------------------------------------------------------
Feel free to share your thoughts and insights.
Don't forget to like and follow us for more trading ideas and discussions.
Best Regards,
VectorAlgo

ALTUSD 1DALT ~ 1D 📈
#ALT Make purchases gradually when retesting this Support Block. With a minimum target of 20%+ 📈

ALTUSDTALT breakout the trend line and falling wedge type but now consolidating. You can buy some at current price and some at demand in green block.

Keeping an eye on this #ALT breakout!Keeping an eye on this #ALT breakout!
Keeping an eye on this #ALT breakout!
Alt Season

ALT/USDT Breakout alert!!, Indicating continue the upward trend!💎 ALT has recently encountered significant market dynamics, particularly with a breakout of the descending channel pattern.
💎 This breakout suggests a potential continuation of the upward movement, aligning with the prevailing bullish trend characterized by higher highs and higher lows.
💎 With this breakout, ALT may continue its upward trajectory and probability reach new higher highs, particularly targeting levels indicated by Fibonacci retracement.
💎 However, if ALT fails to sustain its upward momentum and does not continue upward, there's a possibility that the price may retreat and retest the support area to gather another momentum.
💎 When ALT reaches the support area, it's crucial for it to bounce, as this area holds considerable importance. Failure to bounce and a subsequent breakdown below the support could signal a shift in momentum, potentially leading to a bearish trend reversal.

ALT shortALT bounced off the upper boundary of descending channel. Asset bounced off the resistance level. Bearish movement to support level 0.42 is expected to happen.

ALT/USDT IDEA Alt/USDT
The market structure appears to be transitioning towards a bullish trend. The breakout from the trendline has already been confirmed, indicating a potential uptrend. It is currently undergoing a retest, and if this retest is successful, we may anticipate a significant bullish rally. There is a possibility that the price could surge up to $1 during this leg up. However, it is important to note that this information is not financial advice and should be considered for educational or informational purposes only.

ALT Are You Ready To Make Some Profit With Just ALTALTLAYER Coin: Short Fundamentals, Recent News, and Disclaimer
Fundamentals:
Limited information available: Similar to SAVM, finding details about ALTLAYER can be challenging due to the vast number of cryptocurrencies.
Further research required: Without more specifics on ALTLAYER, it's impossible to determine its purpose, functionality, or underlying technology.
Recent News:
Unable to locate relevant news: There isn't enough information to identify specific news sources related to ALTLAYER.
Disclaimer:
Proceed with caution: Due to the limited availability of information, investing in ALTLAYER could be risky.
Conduct thorough research: Always research any cryptocurrency before investing, regardless of popularity. Look for well-established projects with clear goals and development teams.
Additional Notes:
Consider established coins: If you're new to cryptocurrency investing, consider starting with more prominent coins with a longer track record.
Beware of scams: Unfortunately, cryptocurrency attracts scams. Be wary of unsolicited investment opportunities or projects with overly ambitious promises.
Recommendations:
If you're interested in learning more about ALTLAYER, try searching for it on reputable cryptocurrency websites or forums.
Before investing, look for a whitepaper or project roadmap that explains ALTLAYER's purpose and functionality.
Consider investing in more established cryptocurrencies with a proven track record if you're new to the market.
Disclaimer:
This information is for educational purposes only and should not be considered financial advice.
Cryptocurrency investments are highly volatile and carry significant risks.
Do your own research before making any investment decisions.

$ALT* S/R flipped already happened (blue box)
* ASY 4HR buy signal is about the be triggered.
* 3x long
1HR:
Bullish trend strength: 26
ADX > 25
MA7 > MA25 > MA99
MA50 > MA100 > MA200
Supertrend is long
Price > MA7
Price > MA50
Chikou Span > Price
MACD > 0
Upper Bollinger Band Breakout
Bearish reversal potential: 1
StochRSI Overbought
4HR:
Bullish trend strength: 21
ADX > 25
MA7 > MA25 > MA99
Supertrend is long
Price > MA7
Chikou Span > Price
Bullish trend strength: 26
ADX > 25
MA50 > MA100 > MA200
Supertrend is long
Price > MA50
Chikou Span > Price
Recent Chikou Span / Price Bullish Cross
MA50 acting as support
MA100 acting as support
MACD > 0
Bearish reversal potential: 4
StochRSI Overbought
Bearish Kumo Breakout

ALT has bullish signs!
🎗#ALT/USDT 🎗
LONG
Leverage: (10.0X)
Entry Targets:
1) 0.565
2) 0.535
Take Profit Targets:
1) 0.593
2) 0.628
3) 0.659
4) 0.691
5) 0.728
6) 0.769
7) 0.797
8) 0.836
Stop Targets:
1) 0.390
🟡Chart is speaking it self!
_ _ _ _ _ _ _ _ _ _ _ _ _ _ _ _ _ _ _ _ _ _ _ _ _ _ _ _ _ _ _ _ _
Thank you for seeing idea .
Have a nice day and Good luck
🔴This is only an idea and not a financial advise ( NFA )🔴

ALTUSDT Good Buy!ALTUSDT Technical analysis update
ALT price recently surpassed its previous all-time high (ATH) and is currently trading above both the 100 and 200 exponential moving averages (EMAs) on the 1-hour chart.
Buy zone : Below $0.475
Stop loss : $0.430
Hexa
Thanks

ALT TO KEEP PUMPING!BYBIT:ALTUSDT.P
Altusdt looks extremely healthy today, so I'll take on the continuation of the trend. let's see if we can pick this one up. I'm trading on the 15m timeframe here.
thanks guys!

ALTUSDT.PALTUSDT.P is in bearish trend.
Bearish divergence also form in RSI.
Double top reversal pattern also form .
We wait and watch for the breakout of last LL.
