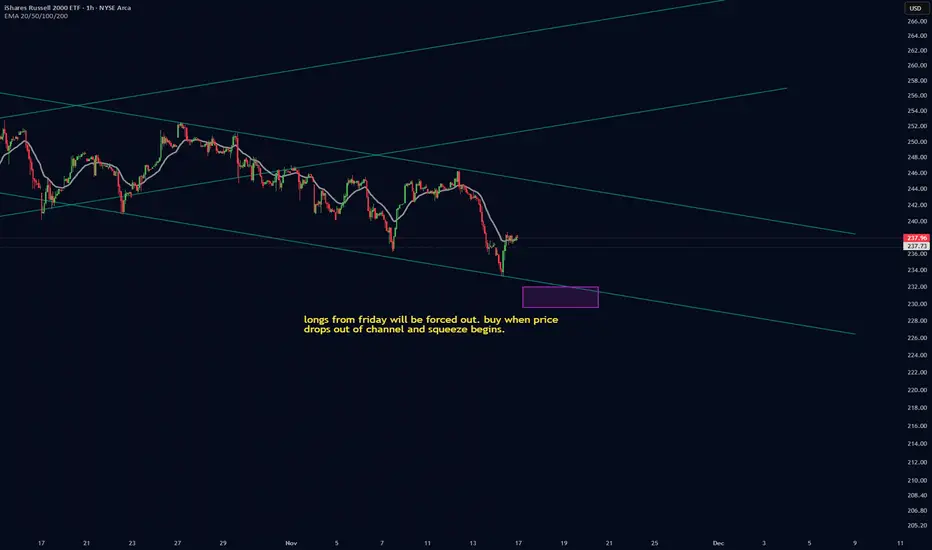
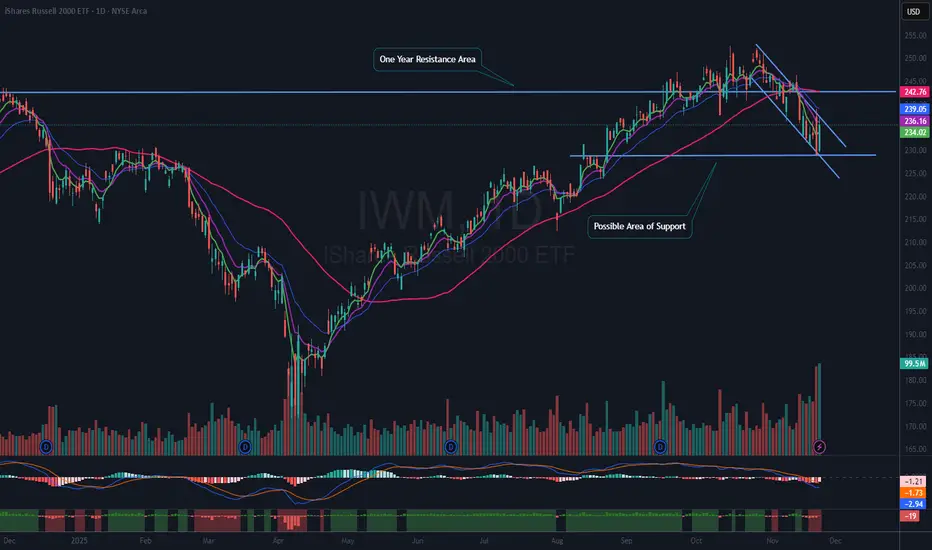
IWM longs will be forced outLongs from friday will be forced out at some point in the next week or two. should be a large move down and a break below the channel that will cause recent longs to exit their positions before the move up. be there to take their long positions when they exit
Key stats
About iShares Russell 2000 ETF
Home page
Inception date
May 22, 2000
Structure
Open-Ended Fund
Replication method
Physical
Dividend treatment
Distributes
Distribution tax treatment
Qualified dividends
Income tax type
Capital Gains
Max ST capital gains rate
39.60%
Max LT capital gains rate
20.00%
Primary advisor
BlackRock Fund Advisors
Distributor
BlackRock Investments LLC
ISIN
US4642876555
IWM is among the best choices in the crowded US small-cap field. The fund tracks the popular Russell 2000 index. IWM's broad basket makes it one of the most diversified funds in the segment. Notably, the fund delves into micro-cap territory, and has often been riskier than our neutral benchmark (as measured by beta) as a consequence. However, including micro-caps is a valid and possibly desirable approach to small-caps, and IWM looks reasonably similar to the benchmark in most other respects.
Related funds
Classification
What's in the fund
Exposure type
Finance
Health Technology
Electronic Technology
Stock breakdown by region
Top 10 holdings
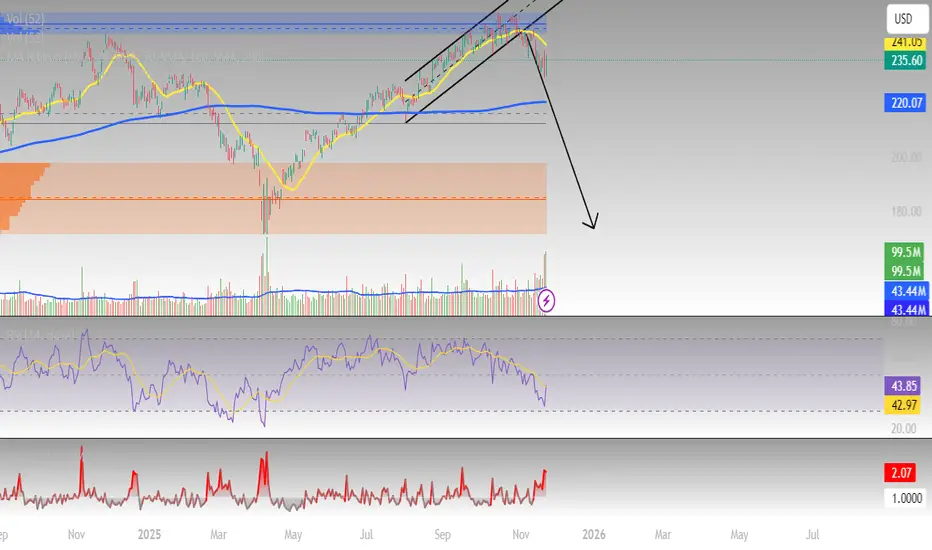
IWM ShortRising wedge pattern breaks down.
Price retracing to major support zone below.
RSI has plenty room to go down lower.
Volume elevated on sell-off.
We might revisit quite deep in the supply zone.
Analysis of $IWM: Flag Pattern or Breakdown?Overview of AMEX:IWM and the Russell 2000 Index
IWM is an exchange-traded fund (ETF) that tracks the Russell 2000 Index. According to Investopedia, the Russell 2000 is the most widely quoted measure of the overall performance of small-cap to mid-cap stocks. This index represents approximately 7%
IWM QuantSignals V3 – Calm Before the MoveIWM QuantSignals Katy 1M Prediction – 2025-11-12
Current Price: $244.10
Final Prediction: $244.59 (+0.20%)
30min Target: $243.99 (-0.05%)
Trend: Neutral
Confidence: 55%
Volatility: 14.4%
Insight:
Katy AI predicts minimal short-term movement
Low confidence and small expected move → no trade recom

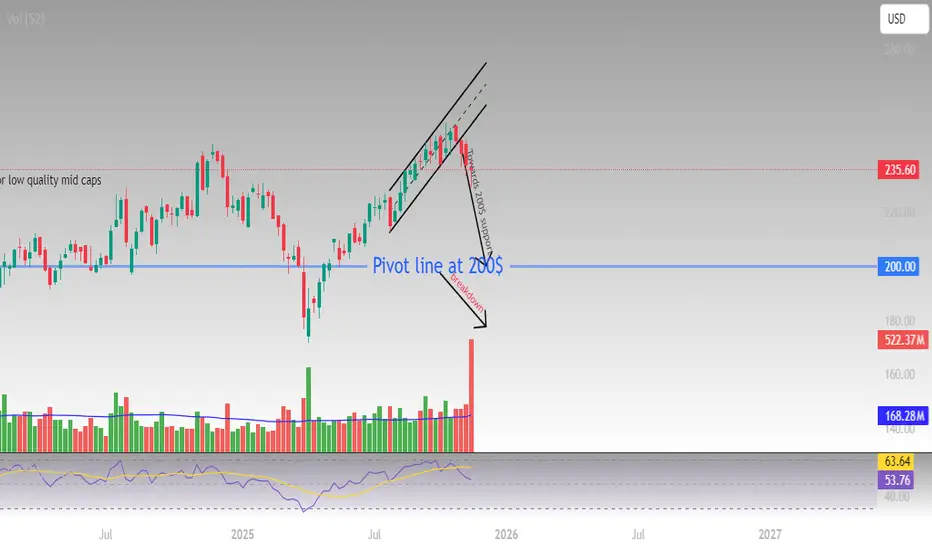
IWM short weekkly confirmation
Seeking confirmation of the IWM short on the weekly
Rising wedge breakdown confirmed on weekly
Key support at $200 could be the floor
Failure at $200 could trigger collapse of low quality stocks
I welcome any constructive criticism on this idea
IWM: Inverse H&S Forming? ⚡ WaverVanir Market Intel — AMEX:IWM Outlook (Nov 10 2025)
Setup Summary:
AMEX:IWM consolidates around $244 after reclaiming the mid-discount zone. The Smart Money Concepts framework shows equilibrium retest before a potential push toward $247 – $251. Institutional DSS and ensemble models align
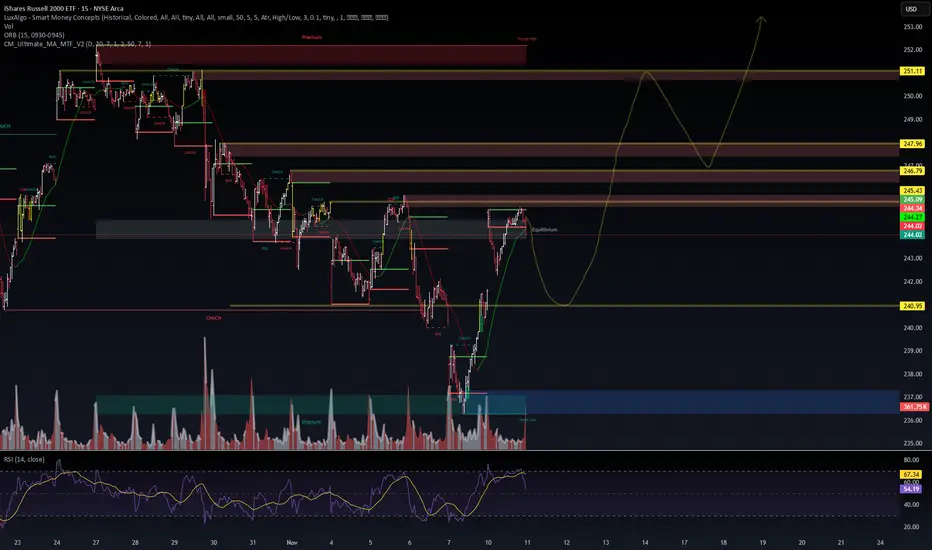
IWM: Trade Setup🧭 IWM 0DTE Setup – Targeting Liquidity Above 246
Symbol: AMEX:IWM (iShares Russell 2000 ETF)
Current Price: 244.34
Session Bias: Short-term bullish → potential exhaustion ahead
🔍 Technical Outlook
Price reclaimed intraday structure after a BOS (Break of Structure) at 241.77.
RSI pushing above
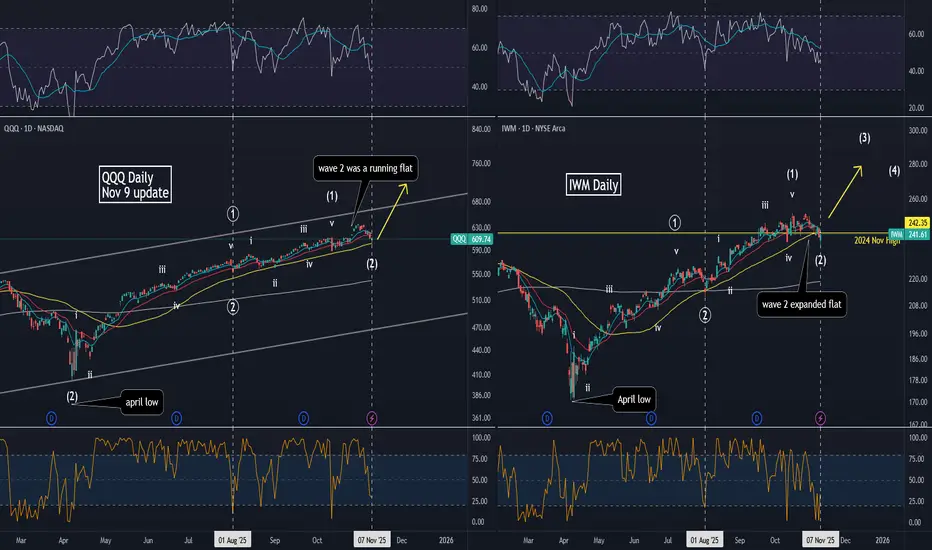
Nov 9: Melt-up wave 3 of (3) starting📈 NASDAQ:QQQ AMEX:IWM (Nov 9 weekend update): index are nesting to the upside with the melt-up wave 3 of (3) starting next week. Signs I see:
1. QQQ price bounced off 50 EMA and closed high with strong volume.
2. Weekly RSI has broken above previous pivot, showing strong momentum. If it w
WSB Contrarian QuantSignals AI Screener 2025-11-06WSB Contrarian QuantSignals AI Screener 2025-11-06
🔥 Most Mentioned Stocks (24h)
NASDAQ:TSLA : 1,754 mentions (1.0x 7d avg)
NASDAQ:NVDA : 751 mentions (1.0x 7d avg)
NASDAQ:HOOD : 384 mentions (1.0x 7d avg)
AMEX:SPY : 333 mentions (1.0x 7d avg)
TSX:VI : 256 mentions (1.0x 7d avg)
AMEX:SPXL : 24

See all ideas
Summarizing what the indicators are suggesting.
Oscillators
Neutral
SellBuy
Strong sellStrong buy
Strong sellSellNeutralBuyStrong buy
Oscillators
Neutral
SellBuy
Strong sellStrong buy
Strong sellSellNeutralBuyStrong buy
Summary
Neutral
SellBuy
Strong sellStrong buy
Strong sellSellNeutralBuyStrong buy
Summary
Neutral
SellBuy
Strong sellStrong buy
Strong sellSellNeutralBuyStrong buy
Summary
Neutral
SellBuy
Strong sellStrong buy
Strong sellSellNeutralBuyStrong buy
Moving Averages
Neutral
SellBuy
Strong sellStrong buy
Strong sellSellNeutralBuyStrong buy
Moving Averages
Neutral
SellBuy
Strong sellStrong buy
Strong sellSellNeutralBuyStrong buy
Displays a symbol's price movements over previous years to identify recurring trends.
Frequently Asked Questions
An exchange-traded fund (ETF) is a collection of assets (stocks, bonds, commodities, etc.) that track an underlying index and can be bought on an exchange like individual stocks.
IWM trades at 235.60 USD today, its price has risen 2.83% in the past 24 hours. Track more dynamics on IWM price chart.
IWM net asset value is 235.52 today — it's fallen 3.26% over the past month. NAV represents the total value of the fund's assets less liabilities and serves as a gauge of the fund's performance.
IWM assets under management is 64.17 B USD. AUM is an important metric as it reflects the fund's size and can serve as a gauge of how successful the fund is in attracting investors, which, in its turn, can influence decision-making.
IWM price has fallen by −4.24% over the last month, and its yearly performance shows a 1.48% increase. See more dynamics on IWM price chart.
NAV returns, another gauge of an ETF dynamics, have risen by −3.26% over the last month, have fallen by −3.26% over the last month, showed a 4.53% increase in three-month performance and has increased by 3.20% in a year.
NAV returns, another gauge of an ETF dynamics, have risen by −3.26% over the last month, have fallen by −3.26% over the last month, showed a 4.53% increase in three-month performance and has increased by 3.20% in a year.
IWM fund flows account for −9.53 B USD (1 year). Many traders use this metric to get insight into investors' sentiment and evaluate whether it's time to buy or sell the fund.
Since ETFs work like an individual stock, they can be bought and sold on exchanges (e.g. NASDAQ, NYSE, EURONEXT). As it happens with stocks, you need to select a brokerage to access trading. Explore our list of available brokers to find the one to help execute your strategies. Don't forget to do your research before getting to trading. Explore ETFs metrics in our ETF screener to find a reliable opportunity.
IWM invests in stocks. See more details in our Analysis section.
IWM expense ratio is 0.19%. It's an important metric for helping traders understand the fund's operating costs relative to assets and how expensive it would be to hold the fund.
No, IWM isn't leveraged, meaning it doesn't use borrowings or financial derivatives to magnify the performance of the underlying assets or index it follows.
In some ways, ETFs are safe investments, but in a broader sense, they're not safer than any other asset, so it's crucial to analyze a fund before investing. But if your research gives a vague answer, you can always refer to technical analysis.
Today, IWM technical analysis shows the neutral rating and its 1-week rating is buy. Since market conditions are prone to changes, it's worth looking a bit further into the future — according to the 1-month rating IWM shows the buy signal. See more of IWM technicals for a more comprehensive analysis.
Today, IWM technical analysis shows the neutral rating and its 1-week rating is buy. Since market conditions are prone to changes, it's worth looking a bit further into the future — according to the 1-month rating IWM shows the buy signal. See more of IWM technicals for a more comprehensive analysis.
Yes, IWM pays dividends to its holders with the dividend yield of 1.02%.
IWM trades at a premium (0.04%).
Premium/discount to NAV expresses the difference between the ETF’s price and its NAV value. A positive percentage indicates a premium, meaning the ETF trades at a higher price than the calculated NAV. Conversely, a negative percentage indicates a discount, suggesting the ETF trades at a lower price than NAV.
Premium/discount to NAV expresses the difference between the ETF’s price and its NAV value. A positive percentage indicates a premium, meaning the ETF trades at a higher price than the calculated NAV. Conversely, a negative percentage indicates a discount, suggesting the ETF trades at a lower price than NAV.
IWM shares are issued by BlackRock, Inc.
IWM follows the Russell 2000. ETFs usually track some benchmark seeking to replicate its performance and guide asset selection and objectives.
The fund started trading on May 22, 2000.
The fund's management style is passive, meaning it's aiming to replicate the performance of the underlying index by holding assets in the same proportions as the index. The goal is to match the index's returns.