SPY/QQQ Plan Your Trade For 6-16 : Up-Down-Up PatternToday's Up-Down-Up Pattern suggests the markets will transition into a moderate upward trending price bar - which is quite interesting in the world we have today.
War and a big weekend of events, protests and other new items could drive market trends over the next few days.
Still, the SPY Cycle Pattern for today is an Up-Down-Up - which suggests last Thursday was an Up bar, last Friday was a Down bar, and today should be an Up bar.
The Gold/Silver pattern is a POP pattern in Counter-trend.
I believe the US markets are benefiting as a safe-haven for capital as the global turmoil drives global investors to seek safety and security for their capital.
That means as long as the world continues to spin out of control, the US markets and the US-Dollar will act as a moderate safe-haven for capital.
Gold and Silver should also benefit from this global chaos.
Bitcoin is benefiting from the strength of the US markets (and the technology sector) as well.
Let's see how this week start to play out. I'm waiting for some more news.
Could be very interesting this week.
Get some.
#trading #research #investing #tradingalgos #tradingsignals #cycles #fibonacci #elliotwave #modelingsystems #stocks #bitcoin #btcusd #cryptos #spy #gold #nq #investing #trading #spytrading #spymarket #tradingmarket #stockmarket #silver
SPY trade ideas

Nightly $SPY / $SPX Scenarios for June 17, 2025🔮 Nightly AMEX:SPY / SP:SPX Scenarios for June 17, 2025 🔮
🌍 Market-Moving News 🌍
📈 U.S. Retail Spending Holds Firm
May’s retail sales were flat month-over-month, defying expectations of a slowdown. Core retail sales (ex-autos) edged up +0.2%, signaling resilience in consumer purchases—an encouraging sign for economic momentum
🤖 Tesla’s Robotaxi Buzz Accelerates
Tesla stock surged after a weekend robotaxi video surfaced ahead of its planned Austin launch. A viral clip showed a Model Y “robotaxi” navigating traffic autonomously, sparking fresh investor enthusiasm despite safety debates
📊 BoJ Holds Rates; Dollar Edges Higher
Japan’s central bank left policy unchanged at 0.5%, maintaining its dovish bias. This lifted the dollar slightly versus the yen, drawing focus to global interest-rate divergence
📊 Key Data Releases 📊
📅 Tuesday, June 17:
8:30 AM ET – Retail Sales (May)
Consumer purchases are tracked, excluding autos. Monitor if activity stays steady despite inflation and rate pressures.
9:15 AM ET – Industrial Production & Capacity Utilization (May)
Provides insight into factory activity and plant usage—a gauge of economic health amid global slowdown concerns.
10:00 AM ET – Business Inventories (April)
Shows stock levels held by wholesalers and manufacturers. Higher inventories with weaker sales may signal slowing demand.
⚠️ Disclaimer:
This information is for educational and informational purposes only and should not be construed as financial advice. Always consult a licensed financial advisor before making investment decisions.
📌 #trading #stockmarket #economy #news #trendtao #charting #technicalanalysis

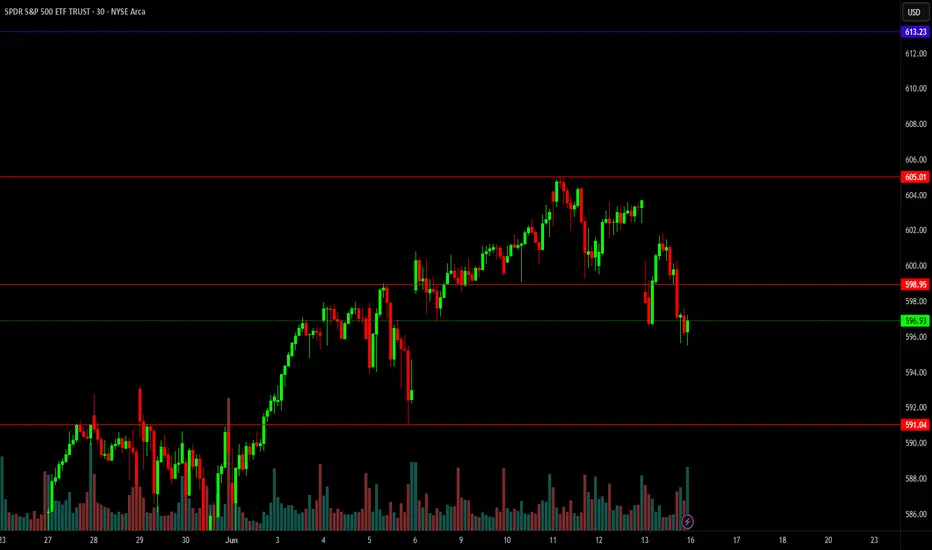
SPY Technical Analysis - Jun 16⏱️ 1‑Hour Chart Overview
Key Zones
* Support: $597–$601 — built on put-gamma support
* Resistance: $605–$607 — topped by call-gamma walls
Bias: Cautiously bullish — awaiting confirmation above $600–601
Trade Idea:
* Structure: Bull call spread (600/605 strikes)
* Targets:
* T1: $605 (initial gamma cap)
* T2: $607 (upper gamma wall)
* Invalidation: Break decisively below $595
Management:
* Entry: Buy near $600–601 with bullish candle and supportive volume
* Scaling: Start small and layer in if price holds
* Exit:
* Take partial profits at $605
* Trail to $607
* Exit if SPY drops below $595
Why It Works: Gamma flows from option expiries tend to provide momentum near the spread’s strikes, and the debit structure defines both risk and reward.
⏳ 15‑Minute Chart (Intraday Entry)
Setup Window: Zooming in for precise entry within 1‑hour framework
What to Observe
1. Pullback to $600–601
* Look for a bullish reversal candle (hammer, engulfing) on 15‑m
* Ideally, with increasing volume
2. Confirmation Signal
* Break above the high of that reversal candle
* Volume support confirms genuine demand
3. Momentum Alignment
* Pair with an intraday oscillator (e.g., Muscle mover, RSI rising)
* Candles should show higher lows or extended wick above support
15‑Minute Trade Rules
* Entry: Market or limit buy on a 15‑m candle closing above reversal high (~$601)
* Stop: Under that candle’s low (e.g., ~$599.50)
* Profit Scaling:
* Partial de‑risk at ~$605
* Full exit planned at ~$607
🚦 Multi‑Timeframe Strategy Summary
1‑Hour: Macro bias and strike framework
15‑Min: Precision entry zone & risk control
Spread Trade: Leverages GEX structure for momentum capture
Risk Defined: Debit known, stops clear
Upside Potential: Push toward gamma-neutralizing walls
Flow Edge: Option hedging dynamics predominantly active around spread levels
🧠 Watchlist
* Price behavior near $600–601 on 15‑m
* Volume surge with bullish candle
* Macro drivers: Fed noise, SPX futures action, sector rotation
* Shifts in implied volatility that may affect spread pricing
Trade with discipline — defined risk, entry precision, steady management.
Disclaimer: Not financial advice. All trading involves risk; do your own due diligence.

Weekly $SPY / $SPX Scenarios for June 16–20, 2025 🔮 Weekly AMEX:SPY / SP:SPX Scenarios for June 16–20, 2025 🔮
🌍 Market-Moving News 🌍
🏦 Fed Holds Rates, Powell Expresses Caution
The Federal Reserve is widely expected to keep rates at 4.25–4.50%, though Chair Powell likely won’t provide fresh guidance. Markets see limited upside without stronger inflation or growth cues
💱 Dollar Strengthens on Geopolitical Risk
The U.S. dollar rose slightly as investors flocked to safe assets amid global tensions with Iran. Treasury yields eased slightly on risk-off flows
🛢️ Oil Near Multi-Week Highs on Mideast & OPEC Dynamics
Oil held near seven-week highs (~$67–70/barrel), buoyed by Iran-Israel tensions and OPEC+ output hikes (411K bpd added from May–July), offset by demand concerns .
⚠️ G7 Summit Faces Heightened Stakes
G7 finance ministers meet in Canada under pressure from Middle East escalation. Watch for policy coordination and commentary on trade, inflation, and global economic risks .
📊 Key Data Releases & Events 📊
📅 Monday, June 16
Regular markets open after Juneteenth holiday
Quiet day; oil & geopolitical headlines dominate
📅 Tuesday, June 17
8:30 AM ET – Retail Sales (May): Signals consumer spending strength/duration
8:30 AM ET – CPI (May): Confirms inflation trend post-CPI cooler reading
10:00 AM ET – Housing Starts & Building Permits (May): Gauges housing market demand
Unexpected Tesla Robotaxi Demo (Austin): Watch for surprise developments this week
📅 Wednesday, June 18
Global Central Bank Day: FOMC, BoE, BoJ policy updates; U.S. Fed will most likely hold steady
📅 Thursday, June 19 – Juneteenth Holiday – U.S. markets closed
📅 Friday, June 20
8:30 AM ET – Existing Home Sales (May): Measures U.S. housing activity
10:00 AM ET – Leading Economic Indicators (May): Early snapshot of economic momentum
⚠️ Disclaimer:
This information is for educational and informational purposes only and should not be construed as financial advice. Always consult a licensed financial advisor before making investment decisions.
📌 #trading #stockmarket #economy #news #trendtao #charting #technicalanalysis

$SPY Watchlist Plan: Week of 6/17Watchlist Plan: Week of 6/17
Stock Near All-Time High
Approaching ATH at 613.23 — key pivot zone
Break and hold above: Look for calls targeting momentum continuation (e.g., 620, 630 psychological levels)
Rejection off ATH: Look for puts targeting a retracement toward 599, then 568
Retracement and Support Zones
599: Micro support on smaller timeframes (15m/1h). Watch for intraday bounce or breakdown.
568: Key downside target if rejection at ATH confirms and 599 fails. Consider swing puts toward this level.
Also monitor the 585–590 range for potential consolidation or minor support.
Game Plan Triggers
Bullish confirmation:
Clean break and hold above 613.23 with strong volume
Market-wide risk-on tone (SPY, QQQ green)
Bearish setup:
Strong rejection at or below ATH
Market-wide pullback or macro weakness (especially in tech or consumer sectors)
Catalysts
June 17 (Monday): Retail Sales Report — gauge of consumer strength
June 18 (Tuesday): Unemployment Claims — snapshot of labor market health
Strong data may fuel market optimism
Weak data could tilt market bearish
Additional Notes
Watch for volume divergence near ATH — breakout with low volume can trap longs
Use pre-market action to frame bias: gap up with follow-through = strength; gap up followed by fade = weakness
Keep an eye on VIX and bond yields for macro pressure indicators
SPY soars to new all time highsThere has been a lot of speculation about where SPY is going next. I believe a significant correction will happen in the near future. However, today SPY is creeping back into the strong uptrend it once had. Looking at chart patterns, SPY is building momentum once more and will be hitting another yet another all time high.

Nightly $SPY / $SPX Scenarios for June 26, 2025🔮 Nightly AMEX:SPY / SP:SPX Scenarios for June 26, 2025 🔮
🌍 Market-Moving News 🌍
💱 Dollar Mounts Decline on Fed Credibility Concerns
The U.S. dollar dropped to a 3½-year low against the euro after reports that President Trump is considering replacing Fed Chair Powell as early as September or October. The move fueled market concern about the Fed’s independence and prompted traders to raise the likelihood of a July rate cut to 25%, with nearly 64 bps of rate cuts priced in by year-end
📉 Markets Stay Cautious Ahead of Powell’s Testimony
Traders remain on edge as Fed Chair Powell’s Capitol Hill testimony continues. He reiterated caution, noting inflation risks tied to tariffs despite growing calls for easing, keeping interest-rate expectations in limbo .
📈 S&P 500 Nears All-Time Highs in Second-Biggest Bi‑Monthly Rally
The S&P 500 has notched its second-largest May–June rally on record (6.2% in May, further gains in June), bolstered by cooling inflation, easing Middle East tensions, and strong AI earnings momentum led by Nvidia. Bull-case scenarios could push the index to fresh highs
📊 Key Data Releases 📊
📅 Thursday, June 26:
(No major U.S. economic release—markets are focused on Powell’s remaining testimony and global risk dynamics.)
⚠️ Disclaimer:
This information is for educational and informational purposes only and should not be construed as financial advice. Always consult a licensed financial advisor before making investment decisions.
📌 #trading #stockmarket #economy #Fed #inflation #geopolitics #technicalanalysis

SPY 15-Min — Weak-High Sweep in Play• Discount BOS at 603.95 → impulsive leg to 606.7 (0.886)
• Weak high tagged at 607.16 – expecting continuation to 1.382 ≈ 608.61 then 1.854 ≈ 610.92
• Invalidation if price closes below 605.45 session VWAP band
• Targets: 608.61 → 610.92
• Risk: stop 604.9 (below 0.5 Fib)
VolanX bias remains risk-on while micro structure stair-steps above the 9-EMA channel.
Educational only – not financial advice
#SPY #SMP500 #OrderFlow #Fib #VolanX #WaverVanir

Monday UpdateSPX and SPY both look like they are trying to decide if the 18ma will hold as support or not, we have to wait for the close. Gold looks like it wants to go higher. Oil and Natural Gas as well. I forgot BTC, I'll do it tomorrow.

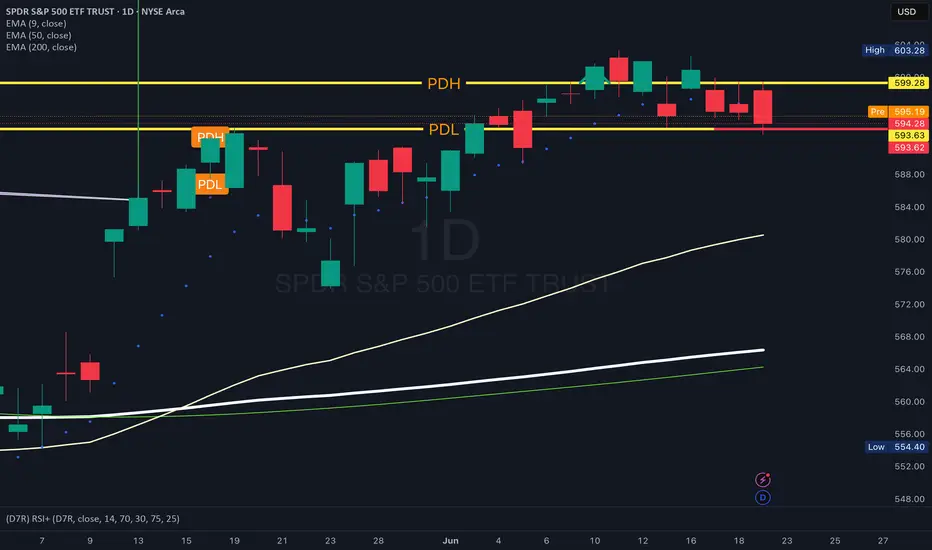
SPY- Premarket readPre-Market Read – June 23
AMEX:SPY
Premarket High: 595.15
Premarket Low: 592.15
Bias: Leaning Bearish
Price got rejected again at that 600–602 zone — that’s been a wall.
All the EMAs (9/50/200) are stacked tight, which usually means something’s brewing.
Institutions bought heavy down around 572–579 — they’re already green, so they might start selling into strength.
I’m expecting chop between 593–595 off the open.
I’ll probably wait out the first 15 min and let the ORB build.
If we break out, I’m watching both sides, but I lean put.
579 spy incoming?I posted this a week or so ago. I think we are finally going to have the momentum, or lack thereof, to make it down to fill the rest of that gap. I have noticed that large gaps that leave a small gap below(you must adjust the indicator to show it) almost always get filled before continuing up. This 579 level also matches up perfectly with the 20ema on the weekly which should provide further support. I will be looking for this level all week while being aware of any short squeezes that could occur on the way down. Will definitely go long at this 579 level as I think we will have a very green July.

Weekly $SPY / $SPX Scenarios for June 23–27, 2025🔮 Weekly AMEX:SPY / SP:SPX Scenarios for June 23–27, 2025 🔮
🌍 Market-Moving News 🌍
🌐 Geopolitics Add to Risk Aversion
The S&P 500 is up about 0.9% so far in June, but analysts warn it’s facing a “precarious” phase amid renewed Middle East conflict and looming U.S. tariff deadlines in July–August. Elevated oil prices could fuel inflation, while fiscal and debt ceiling pressures weigh on sentiment
🎙️ Powell Heads to Capitol Hill
Fed Chair Powell will testify before Congress this week. His remarks on inflation and rate outlook—particularly regarding the Fed’s recent dot-plot revisions and monetary policy uncertainty—will be central to market direction
📈 Nike, FedEx & Micron Earnings Under Focus
Key corporate earnings (Nike, FedEx, Micron) could provide fresh insight into how tariffs and supply-chain disruptions are impacting major U.S. businesses
🛢️ Oil Prices Elevated
Oil remains range-bound at multi-week highs near $75–80/bbl following U.S.–Israel military action in Iran, which briefly spiked prices ~7–11%. Continued dependence on Middle Eastern supply may keep energy complex volatile
⚖️ NATO Summit Tightens Security Focus
NATO leaders meet in The Hague, marking an elevated global defense posture amid geopolitical uncertainty. Defense and aerospace stocks may remain pressured or volatile depending on summit outcomes
📊 Key Data Releases & Events 📊
📅 Monday, June 23
9:45 AM ET: S&P Global Flash U.S. Services & Manufacturing PMI (June)
10:00 AM ET: Existing Home Sales (May)
📅 Tuesday, June 24
10:00 AM ET: Consumer Confidence Index (June)
Testimony: Fed Chair Jerome Powell appears before Congress
📅 Wednesday, June 25
10:00 AM ET: New Home Sales (May)
📅 Thursday, June 26
8:30 AM ET: Advance Q1 GDP (Final Estimate)
📅 Friday, June 27
8:30 AM ET: Core PCE Price Index (May) — Fed’s preferred inflation gauge
⚠️ Disclaimer:
This is for educational and informational purposes only. It does not constitute financial advice. Always consult a licensed financial advisor before investing.
📌 #trading #stockmarket #economy #geopolitics #Fed #oil #charting #technicalanalysis

$SPY Call Credit Spread for 7/3 Expy IdeaAMEX:SPY Call Credit Spread
+1 $604 call 7/3
-1 $600 call 7/3
~$200 credit
1:1 risk:reward
Breakeven @ Expy = $602
We'll see...

SPY repeating patternsSo just look at patterns that coincide with the RSI. Just keep an eye on the levels & channels & paly it smart


SPY Breaks Rising Wedge! Gamma Wall Rejected. Jun 17SPY Breaks Rising Wedge! Gamma Wall Rejected — Bearish Momentum Building Into OPEX 🔻
🔬 GEX (Gamma Exposure) Sentiment Breakdown:
* Gamma Resistance Above:
* Gamma Wall / Call Resistance: $602
* $603–$604.50 = additional CALL walls (2nd & 3rd tier resistance)
* $606.37 = Local high; unlikely to reclaim without macro tailwind
* PUT Walls / Downside Zones:
* $597 = HVL + Key Flip Level
* $595 = 1st Major PUT Support (Highest negative NET GEX)
* $593 / $590 = deeper GEX-supported flush zones
* Options Flow Metrics:
* IVR: 19.4 (slightly below avg)
* IVx avg: 19
* PUT Flow: 91.5% 🟥
* GEX Sentiment: 🔴🔴🔴 (Bearish dealer positioning + skewed delta exposure)
* Interpretation:
* Heavy call rejection at $602 combined with high PUT flow suggests dealers are short gamma.
* If SPY closes below $597, gamma exposure flips net negative — potential acceleration into $595/$593.
🧠 15-Minute SMC Breakdown:
* Current Price: $598.00
* Structure Overview:
* Clean rising wedge break
* Two CHoCHs confirmed at top → shift from bullish to bearish control
* Price broke into demand box (~$597–$598), testing support
* Volume spiked on breakdown = institutional participation confirmed
* Trend View:
* Uptrend is broken.
* Now entering potential distribution-to-downtrend transition phase
🧭 Trade Scenarios:
🟥 Bearish Breakdown Setup (High Probability):
* Trigger: Clean breakdown below $597
* Target 1: $595 (GEX Put wall)
* Target 2: $593 / $590
* Stop-loss: Above $600.50
Gamma flip + SMC structure shift supports downside. Dealer flows likely exacerbate drop under $597.
🟩 Bullish Reclaim Setup (Low Probability):
* Trigger: Reclaim of $602 with volume
* Target 1: $604.50
* Target 2: $606.50 (high)
* Stop-loss: Below $597.50
Only possible with major market strength, such as dovish Fed cues or macro catalysts.
📌 My Thoughts:
* SPY is showing signs of weakness across the board — structure, options flow, and volume confirm sellers stepping in.
* Put flows are extreme (>90%), so bounces may be brief and used to reload shorts.
* This is not a dip to buy blindly — best play is momentum PUTs under $597, tight risk control.
* Ideal setup for zero-day or 1DTE options trades with defined exits.
📉 Conclusion:
SPY failed to hold $602 Gamma Wall, rejected hard, and now tests $597 support. With options sentiment flipping negative and SMC structure breaking down, a drop to $595 or lower is increasingly likely.
Disclaimer: This analysis is for educational purposes only. Always manage risk and trade based on your plan.

S&P 500 OutlookS&P closed below the 9-EMA, showing there is weakness going into next week. Starting to build my watchlist when we get the bounce. If it closes back above the 9-EMA, then I'll start to look for entries.


$spyyieahh
Retest of mid line parallel.
Let's see how thos one works out, by 28 July we should see that touch of mid line and then boom or bust ?

SPY: Expecting Bullish Movement! Here is Why:
The analysis of the SPY chart clearly shows us that the pair is finally about to go up due to the rising pressure from the buyers.
Disclosure: I am part of Trade Nation's Influencer program and receive a monthly fee for using their TradingView charts in my analysis.
❤️ Please, support our work with like & comment! ❤️

Bearish Trend Starting SP500 SP:SPX AMEX:SPY Cannot Across 605 with MACD crossdown & RSI top lower
Last Support 593 If Breakthrough That Signal Confirm Complete Down Trend

SPY (S&P500) - Price Testing Support Trendline - Daily ChartSPY (S&P500 ETF) price has just closed below $600 and is currently under a support trendline.
If price cannot breakout above the $600 and $605 resistance level this month, a pullback could occur down to the support zone.
SPY price could potentially pullback to various levels of support due to:
-USA domestic conflict
-International military conflicts
-Technical chart bearish divergence
-USA federal reserve interest rate news
-Government and corporate news
Support Levels: $595, $590, $585, $580.
Resistance Levels: $600, $605, $610, $615.
The 50EMA/200EMA Golden Cross is still on-going, and support prices of $580 and $568 have yet to be tested significantly.

Update into the closeAnd I cover other charts as well. I expect lower on SPX next weel. Higher on Gold and OIL. Likely higher on Nat Gas, lower on BTC
