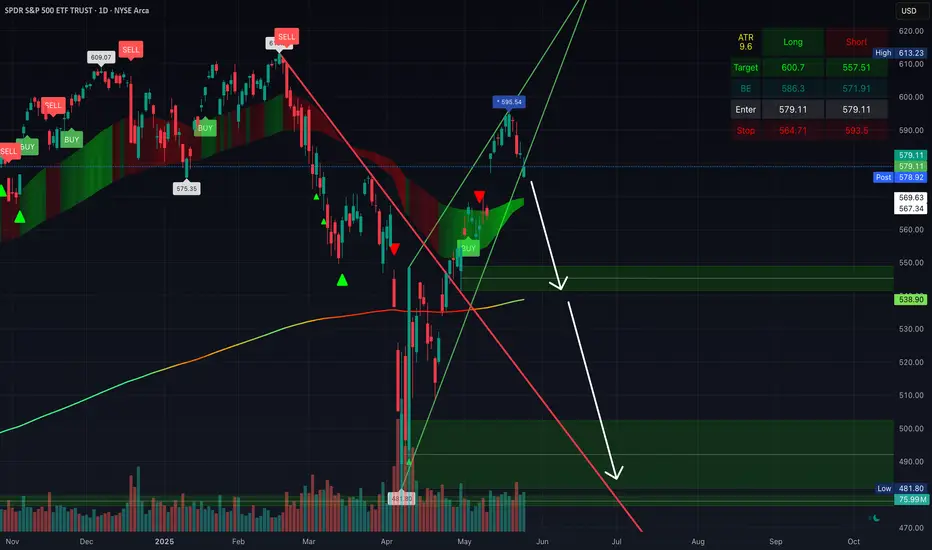
SPY at a CrossroadsUsing the Potterbox strategy on the 4 hour time frame I can see that we are at a huge level of support that is holding at $578, which I think will be crucial in deciding whether we break down or make an attempt to try and head to the upside.
$571 and then $568.50 are downside targets, if we end up breaking down below the $578 support.
Above us, there is a box where price consolidated that we retested the bottom of back on Friday. If we are able to hold support at $578, we are likely to retest and try and secure the floor at $581. With a $582.75 break, which is cost basis, or the median of the box, we are likely to head to the bottom of the next box above us at $588.
SPY trade ideas

05-25-25 Risk Containment & Trading Strategy ExamplesSkilled Traders have learned to manage risk levels using techniques that allow them to preserve capital and move their assets towards future successful traders.
Some beginner traders get stuck trying to swing for the fences.
In this video, I try to share a common Fibonacci price/strategy technique where traders can attempt to limit risks while learning to identify efficient successful trade triggers.
Remember, taking a trade is the easy part. Protecting and growing your capital is much more difficult.
Please use the techniques in this video to learn how to protect and manage your capital.
Get some.
Happy Memorial Day.
#trading #research #investing #tradingalgos #tradingsignals #cycles #fibonacci #elliotwave #modelingsystems #stocks #bitcoin #btcusd #cryptos #spy #gold #nq #investing #trading #spytrading #spymarket #tradingmarket #stockmarket #silver

Technical Signals Point to Potential Downside: Key Gaps and IndiThe MACD on the daily chart is nearing a bearish crossover, signaling a potential sell-off. There's a gap from April 22nd aligning with the 50-61.8% Fibonacci retracement zone. Additionally, the gap from May 9th remains to be filled, which coincides with the 100 and 200 EMA levels.


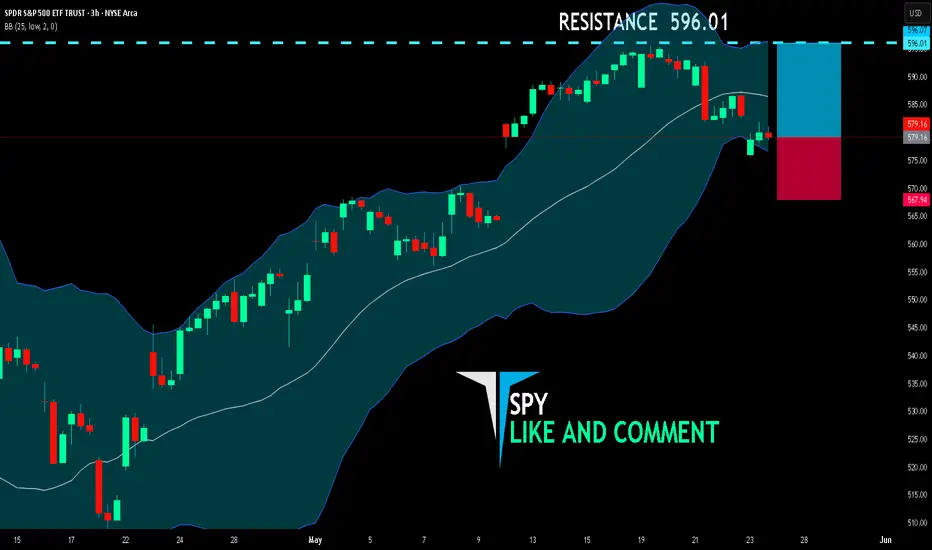
SPY LONG FROM SUPPORT
SPY SIGNAL
Trade Direction: long
Entry Level: 579.16
Target Level: 596.01
Stop Loss: 567.94
RISK PROFILE
Risk level: medium
Suggested risk: 1%
Timeframe: 3h
Disclosure: I am part of Trade Nation's Influencer program and receive a monthly fee for using their TradingView charts in my analysis.
✅LIKE AND COMMENT MY IDEAS✅

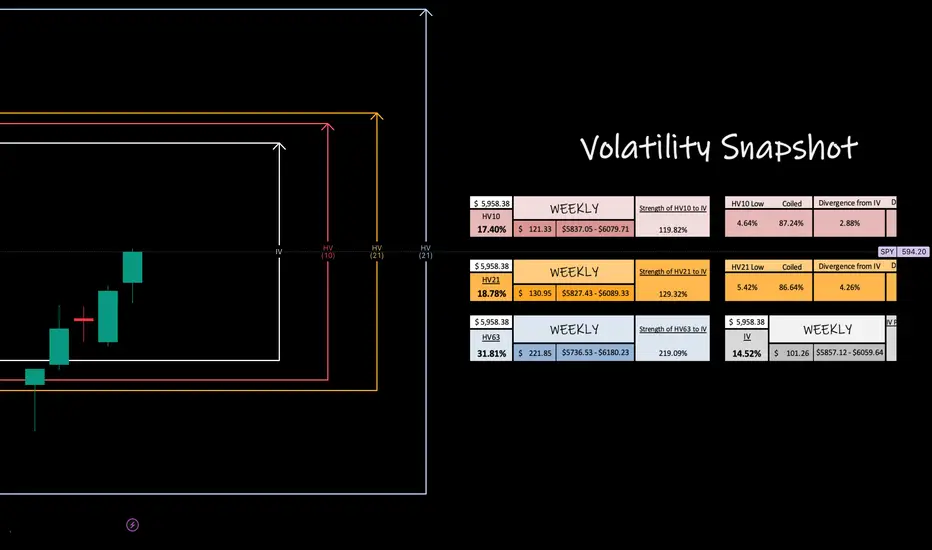
SPY Weekly PotentialVolatility, expressed through standard deviation, quantifies market elasticity and presents a level of probability and precision that humbles us all.
This week with AMEX:SPY bi-weekly trends have risen to just below our monthly values and are currently expansive over the markets IV prediction. Right now as I see it, HV10 is going resonate alongside our monthly values showing continued strength over IV. We could full regression to quarterly means as we move our of corrective territory then see consolidation to cool the markets down.
BOOST the post, drop a follow and comment, BUT don't forget to circle back at the end of the week to revisit and observe how our trending markets preformed!
This is how ChatGPT would write the marketNVDA earnings will not disappoint
PCE will be doable
big money has rebalanced and will let it drift higher (along with yields)
This week was just a nice healthy dip and markets will just shrug off negative news until the tipping point, in which case another sharp repricing will happen. Followed by a relief rally in August but then bitter disappointment in September.
I pause but then I'm sadly strangled to agree... 3Y/5Y hasn't inverted, sentiment is a bit too skittish, and according to chatgpt, this was not a break of the long term pattern and short of super ugly surprises in the original 3 points above, it will not end in capitulation. And again, I might just agree. Even in the midst of the Liberation Day shocks, we barely got into a bear market, there was no massive retaliation and dumping of foreign held treasuries.
Basically we built a pretty good nation. Even when the government takes a chainsaw to itself and companies have to pull out their own arms to import supplies and are pausing any capital expenditures until the picture clears up, financial markets are like, meh, it'll be fine. I thought we'd have a earnings ratio collapse by now, but we're even still higher than our Shiller average....

SPY/QQQ Plan Your Trade EOD Update : Memorial Weekend RisksThis EOD update is to help you try to position for the risks associated with a further breakdown in price trends over the lone Memorial Day weekend.
I know this video will be posted late in the day - but I want you to learn how to hedge against risks and try to learn to take your profits when they are THERE.
This is a really quick video.
Stay safe this weekend and thank you to all our VETS for your service and sacrifices.
We honor you this weekend.
GET SOME.
#trading #research #investing #tradingalgos #tradingsignals #cycles #fibonacci #elliotwave #modelingsystems #stocks #bitcoin #btcusd #cryptos #spy #gold #nq #investing #trading #spytrading #spymarket #tradingmarket #stockmarket #silver

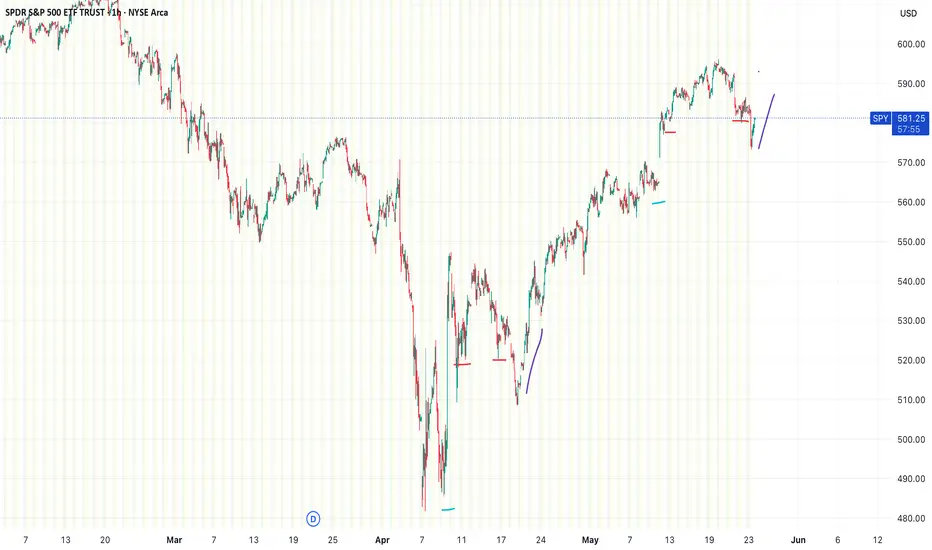
Repeat of Late Apr-May lows & rallyThe chart shows the SPDR S&P 500 ETF Trust (SPY) on a 1-hour timeframe, with a pattern appearing to be repeating itself from late April/May(Liberation day announcements) dip and then boot and rally from trade announcements, all marked by colored lines.
The colored lines (blue, red, purple) highlight a recurring price action setup. Each set of lines seems to mark a sequence of movements:
Blue: Sharp drop, then gap up
Red: Consolidation at a lower higher from gap up, return to high, consolidation back lower at previous lower high
Purple: Breakout & reversal upward.
SPY/QQQ Plan Your Trade for 5-23 : Carryover PatternLooking at the charts today, I want to say that it certainly looks like the SPY Cycle Patterns are blending into a consolidated CRUSH/BOTTOM pattern (see the weekend patterns) today and possibly "carrying over" into the early trading next week.
I have been warning of a pending rollover/breakdown in this uptrend for weeks. Today's breakdown seems a bit aggressive, but it is what it is.
If the patterns are consolidating/blending into a bigger breakdown over the Memorial Day weekend, then we could be looking at a very big downward/rotational move in the SPY/QQQ/Bitcoin over the next 5+ trading days while Gold/Silver continue to rally.
Silver is lagging Gold right now, but I don't think that lasts. Once Gold gets back above $3400, I believe Silver will start to make a big move higher.
The big question in my mind is - how does this carry into Monday's holiday trading schedule and into Tuesday's OPEN?
I'll have to see how things play out today - but it certainly looks like I'll be adding some SPREADS to potentially catch any big move over this weekend.
GET SOME.
This could play out exceptionally well for skilled traders.
#trading #research #investing #tradingalgos #tradingsignals #cycles #fibonacci #elliotwave #modelingsystems #stocks #bitcoin #btcusd #cryptos #spy #gold #nq #investing #trading #spytrading #spymarket #tradingmarket #stockmarket #silver


Nightly $SPY / $SPX Scenarios for May 23, 2025 🔮 Nightly AMEX:SPY / SP:SPX Scenarios for May 23, 2025 🔮
🌍 Market-Moving News 🌍
🇬🇧 Global Bond Yields Signal Rising Term Premium
Long-dated government bond yields in the U.S., U.K., and Japan surged, with the U.S. 30-year Treasury yield touching 5.09%, as investors demand higher compensation for locking in funds amid mounting debt and inflation risks
🏗️ Komatsu Sees Tariff Relief
Komatsu’s CEO says a recent U.S.–China trade truce may cut the company’s tariff hit by $140 million, easing cost pressures on its U.S. operations and brightening machinery sector outlook
📉 U.S. Stocks End Flat as Yields Ease
Wall Street closed little changed, with the S&P 500 and Dow finishing flat and the Nasdaq up 0.3%, after Treasury yields retreated slightly following recent spikes
📊 Key Data Releases 📊
📅 Friday, May 23:
🏠 New Home Sales (10:00 AM ET)
Reports the number of newly signed contracts for single-family homes, a direct gauge of housing demand and consumer confidence.
⚠️ Disclaimer:
This information is for educational and informational purposes only and should not be construed as financial advice. Always consult a licensed financial advisor before making investment decisions.
📌 #trading #stockmarket #economy #news #trendtao #charting #technicalanalysis

Engineering the Hull‑style Exponential Moving Average (HEMA)▶️ Introduction
Hull’s Moving Average (HMA) is beloved because it offers near–zero‑lag turns while staying remarkably smooth. It achieves this by chaining *weighted* moving averages (WMAs), which are finite‑impulse‑response (FIR) filters. Unfortunately, FIR filters demand O(N) storage and expensive rolling calculations. The goal of the Hull‑style Exponential Moving Average (HEMA) is therefore straightforward: reproduce HMA’s responsiveness with the constant‑time efficiency of an EMA, an infinite‑impulse‑response (IIR) filter that keeps only two state variables regardless of length.
▶️ From FIR to IIR – What Changes?
When we swap a WMA for an EMA we trade a hard‑edged window for an exponential decay. This swap creates two immediate engineering challenges. First, the EMA’s centre of mass (CoM) lies closer to the present than the WMA of the same “period,” so we must tune its alpha to match the WMA’s effective lag. Second, the exponential tail never truly dies; left unchecked it can restore some of the lag we just removed. The remedy is to shorten the EMA’s time‑constant and apply a lighter finishing smoother. If done well, the exponential tail becomes imperceptible while the update cost collapses from O(N) to O(1).
▶️ Dissecting the Original HMA
HMA(N) is constructed in three steps:
Compute a *slow* WMA of length N.
Compute a *fast* WMA of length N/2, double it, then subtract the slow WMA. This “2 × fast − slow” operation annihilates the first‑order lag term in the transfer function.
Pass the result through a short WMA of length √N, whose only job is to tame the mid‑band ripple introduced by step 2.
Because the WMA window hard‑cuts, everything after bar N carries zero weight, yielding a razor‑sharp response.
▶️ Re‑building Each Block with EMAs
1. Slow leg .
We choose αₛ = 3 / (2N − 1) .
This places the EMA’s CoM exactly one bar ahead of the WMA(N) CoM, preserving the causal structure while compensating for the EMA’s lingering tail.
2. Fast leg .
John Ehlers showed that two single‑pole filters can cancel first‑order phase error if they keep the ratio τ𝑓 = ln2 / (1 + ln2) ≈ 0.409 τₛ .
We therefore compute α𝑓 = 1 − e^(−λₛ / 0.409) ,
where λₛ = −ln(1 − αₛ).
3. Zero‑lag blend .
Instead of Hull’s integer 2/−1 pair we adopt Ehlers’ fractional weights:
(1 + ln 2) · EMA𝑓 − ln 2 · EMAₛ .
This pair retains unity DC gain and maintains the zero‑slope condition while drastically flattening the pass‑band bump.
4. Finishing smoother .
The WMA(√N) in HMA adds roughly one and a half bars of consequential delay. Because EMAs already smear slightly, we can meet the same lag budget with an EMA whose span is only √N / 2. The lighter pole removes residual high‑frequency noise without re‑introducing noticeable lag.
▶️ Error Budget vs. Classical HMA
Quantitatively, HEMA tracks HMA to within 0.1–0.2 bars on the first visible turn for N between 10 and 50. Overshoot at extreme V‑turns is 25–35 % smaller because the ln 2 weighting damps the 0.2 fs gain peak. Root‑mean‑square ripple inside long swings falls by roughly 15–20 %. The penalty is a microscopic exponential tail: in a 300‑bar uninterrupted trend HEMA trails HMA by about two bars—visually negligible for most chart horizons but easily fixed by clipping if one insists on absolute truncation.
▶️ Practical Evaluation
Side‑by‑side plots confirm the math. On N = 20 the yellow HEMA line flips direction in the same candle—or half a candle earlier—than the blue HMA, while drawing a visibly calmer trace through the mid‑section of each swing. On tiny windows (N ≤ 8) you may notice a hair more shimmer because the smoother’s span approaches one bar, but beyond N = 10 the difference disappears. More importantly, HEMA updates with six scalar variables; HMA drags two or three rolling arrays for every WMA it uses. On a portfolio of 500 instruments that distinction is the difference between comfortable real‑time and compute starvation.
▶️ Conclusion
HEMA is not a casual “replace W with E” hack. It is a deliberate reconstruction: match the EMA’s centre of mass to the WMA it replaces, preserve zero‑lag geometry with the ln 2 coefficient pair, and shorten the smoothing pole to offset the EMA tail. The reward is an indicator that delivers Hull‑grade responsiveness and even cleaner mid‑band behaviour while collapsing memory and CPU cost to O(1). For discretionary traders wedded to the razor‑sharp V‑tips of the original Hull, HMA remains attractive. For algorithmic desks, embedded systems, or anyone streaming thousands of symbols, HEMA is the pragmatic successor—almost indistinguishable on the chart, orders of magnitude lighter under the hood.

SPY Will Keep Growing! Buy!
Hello,Traders!
SPY is trading in an uptrend
And the index made a retest
Of the key horizontal level
Of 579$ from where we are
Already seeing a bullish
Rebound so as we are
Bullish biased we will be
Expecting a further
Bullish move up
Buy!
Comment and subscribe to help us grow!
Check out other forecasts below too!
Disclosure: I am part of Trade Nation's Influencer program and receive a monthly fee for using their TradingView charts in my analysis.


$SPY – Bearish RSI Divergence + Gap Below = Risky Setup👀 The RSI divergence has been signaling weakness for several sessions — with lower highs on momentum while price made higher highs.
And now, we’re stalling right at a volume shelf (see VRVP) with a big unfilled gap looming just below.
⚠️ Things to watch:
Bearish RSI divergence ✔️
Price breakdown confirmation below $582
Gap fill target = ~$572
VRVP shows thin volume beneath current price
If momentum rolls over from here, this could accelerate fast into that gap zone.

SPY SHORTES Futures have decisively broken down from the ascending wedge pattern that had been forming over the past few weeks. This bearish technical breakdown suggests a potential shift in market sentiment and momentum. Given the high correlation, I'm anticipating that SPY will follow suit shortly, especially as macroeconomic pressures intensify.
The catalyst appears to be a combination of bearish fundamental developments:
Moody’s Credit Downgrade: The recent downgrade has shaken investor confidence in U.S. creditworthiness, adding fuel to the bond market selloff.
Bond Market Pressure: Yields continue to climb as investors exit fixed income, concerned about rising inflation, mounting debt, and tightening financial conditions.
Fiscal Uncertainty: The U.S. House has passed Trump’s substantial tax bill, which, while aimed at stimulating growth, raises concerns about further ballooning the national deficit. This is compounded by Trump's new spending package and a proposed debt ceiling increase, heightening fiscal instability and long-term debt fears.
We’re also seeing an uptick in volume following the last downward wave, which may indicate institutional participation and confirmation of the breakdown.
Technical Targets (If Breakdown Continues):
nPoC (Naked Point of Control): A high-probability magnet for price action due to untested liquidity.
50% Fibonacci Extension: Suggests a measured move target based on the size of the previous wave.
0.618 Fibonacci Retracement (Golden Pocket): A key confluence zone that often acts as strong support/resistance due to its high relevance in market algorithms and trader psychology.
These targets present a strong technical confluence zone and may serve as areas of interest for both short covering and potential long re-entries.

$SPY May 22, 2025AMEX:SPY May 22, 2025
15 Minutes.
Last week I expected the retracement towards 580 levels as numbers were far away from moving averages. But AMEX:SPY kept moving towards595 and suddenly broke yesterday towards 582 levels.
I expect it to settle down around 579 - 581 levels then a pull back is on cards as now we have the reverse on the cards with the 200 being away again.
On left side we have a big gap around 570 - 577 levels which I feel will be sorted out before a consolidation.
The weakness below 590 has keto 582 levels.
At the moment if 578 is broken i see support around 573 574 levels.


Nightly $SPY / $SPX Scenarios for May 22, 2025 🔮 Nightly AMEX:SPY / SP:SPX Scenarios for May 22, 2025 🔮
🌍 Market-Moving News 🌍
📈 Treasury Yields Surge Amid Weak Bond Auction
U.S. Treasury yields continued their upward trajectory, with the 10-year yield nearing 4.6% and the 30-year yield surpassing 5%, marking the highest levels since early 2023. This increase followed a weak $16 billion auction of 20-year bonds, which attracted less investor demand and sold at higher-than-expected yields. Factors contributing to the rise include fading recession fears, persistent inflation concerns, and growing fiscal worries related to potential tax cut extensions.
📉 Stock Market Declines as Tech Stocks Retreat
The stock market experienced significant losses, with the Dow Jones Industrial Average dropping 1.9%, falling below its 200-day moving average. The S&P 500 and Nasdaq fell 1.6% and 1.4%, respectively.
💼 Snowflake ( NYSE:SNOW ) Reports Strong Earnings
Snowflake Inc. reported record quarterly revenue of $1.04 billion, surpassing expectations. Product revenue increased 26% year-over-year to $996.8 million. The company raised its full-year forecast to $4.325 billion, reflecting a 25% year-over-year increase. Despite a GAAP net loss of $430 million, Snowflake posted an adjusted profit of 24 cents per share, exceeding the 21-cent estimate.
📊 Morgan Stanley Turns Bullish on U.S. Stocks
Morgan Stanley has shifted to a bullish stance on U.S. stocks and bonds, raising its outlook due to signs of market stabilization and improving growth conditions. The bank maintains a base target of 6,500 for the S&P 500 by mid-2026, with a bullish scenario projecting 7,200.
📊 Key Data Releases 📊
📅 Thursday, May 22:
8:30 AM ET: Initial Jobless Claims
9:45 AM ET: S&P Global Flash U.S. Services PMI for May
10:00 AM ET: Advance Services Report (First Quarter 2025)
⚠️ Disclaimer:
This information is for educational and informational purposes only and should not be construed as financial advice. Always consult a licensed financial advisor before making investment decisions.
📌 #trading #stockmarket #economy #news #trendtao #charting #technicalanalysis
