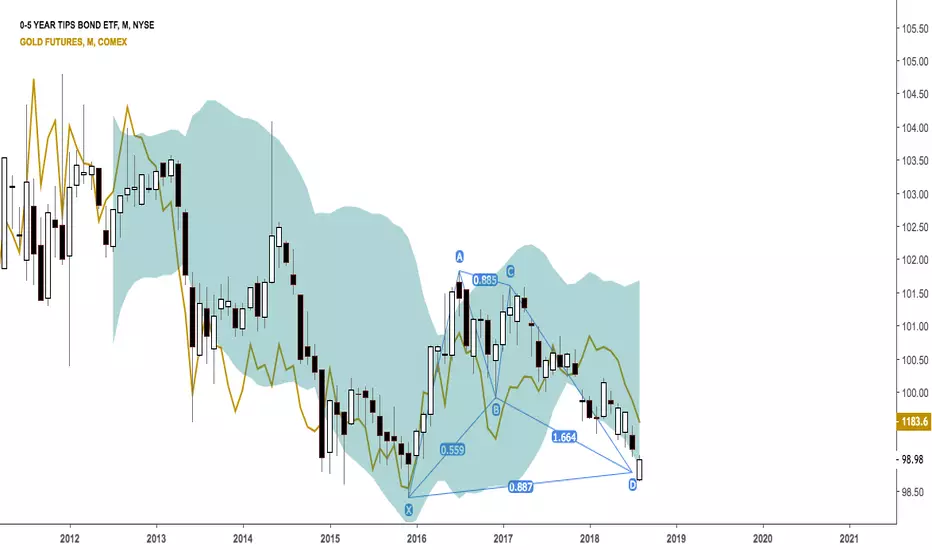
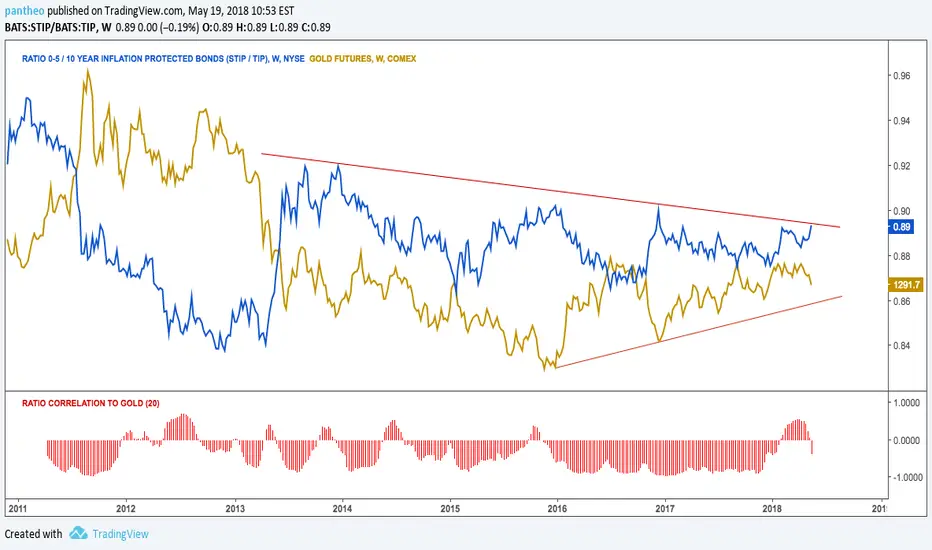
Inflation hedge - STIPCurrent high inflation and expected interest rates to increases over the year, STIP gives good exposure to short-term inflation protection. The technical analysis in Stochastics shows a similar head-and-shoulders pattern similar to 2017.
Key stats
About iShares 0-5 Year TIPS Bond ETF
Home page
Inception date
Dec 1, 2010
Structure
Open-Ended Fund
Replication method
Physical
Dividend treatment
Distributes
Distribution tax treatment
Ordinary income
Income tax type
Capital Gains
Max ST capital gains rate
39.60%
Max LT capital gains rate
20.00%
Primary advisor
BlackRock Fund Advisors
Distributor
BlackRock Investments LLC
STIP offers coverage of the US short-term TIPS market. The fund's duration and yield are typically what we would expect from a short-term TIPS fund. Like all Treasury debts, TIPS are issued by and backed by the full faith and credit of the US government. On top of that, the fund is short-term in nature, so it bears minimal interest rate risk. In all, STIP is a viable option for investors seeking comprehensive exposure to the short-term TIPS market. Prior to January 31, 2023, this fund tracked the Bloomberg U.S. Treasury Inflation-Protected Securities (TIPS) 05 Years Index.
Related funds
Classification
What's in the fund
Exposure type
Government
Stock breakdown by region
Top 10 holdings


Summarizing what the indicators are suggesting.
Oscillators
Neutral
SellBuy
Strong sellStrong buy
Strong sellSellNeutralBuyStrong buy
Oscillators
Neutral
SellBuy
Strong sellStrong buy
Strong sellSellNeutralBuyStrong buy
Summary
Neutral
SellBuy
Strong sellStrong buy
Strong sellSellNeutralBuyStrong buy
Summary
Neutral
SellBuy
Strong sellStrong buy
Strong sellSellNeutralBuyStrong buy
Summary
Neutral
SellBuy
Strong sellStrong buy
Strong sellSellNeutralBuyStrong buy
Moving Averages
Neutral
SellBuy
Strong sellStrong buy
Strong sellSellNeutralBuyStrong buy
Moving Averages
Neutral
SellBuy
Strong sellStrong buy
Strong sellSellNeutralBuyStrong buy
Displays a symbol's price movements over previous years to identify recurring trends.
Frequently Asked Questions
An exchange-traded fund (ETF) is a collection of assets (stocks, bonds, commodities, etc.) that track an underlying index and can be bought on an exchange like individual stocks.
STIP trades at 103.56 USD today, its price has risen 0.39% in the past 24 hours. Track more dynamics on STIP price chart.
STIP net asset value is 103.47 today — it's risen 0.73% over the past month. NAV represents the total value of the fund's assets less liabilities and serves as a gauge of the fund's performance.
STIP assets under management is 12.55 B USD. AUM is an important metric as it reflects the fund's size and can serve as a gauge of how successful the fund is in attracting investors, which, in its turn, can influence decision-making.
STIP price has risen by 0.58% over the last month, and its yearly performance shows a 3.48% increase. See more dynamics on STIP price chart.
NAV returns, another gauge of an ETF dynamics, have risen by 0.73% over the last month, showed a 1.98% increase in three-month performance and has increased by 6.48% in a year.
NAV returns, another gauge of an ETF dynamics, have risen by 0.73% over the last month, showed a 1.98% increase in three-month performance and has increased by 6.48% in a year.
STIP fund flows account for 4.37 B USD (1 year). Many traders use this metric to get insight into investors' sentiment and evaluate whether it's time to buy or sell the fund.
Since ETFs work like an individual stock, they can be bought and sold on exchanges (e.g. NASDAQ, NYSE, EURONEXT). As it happens with stocks, you need to select a brokerage to access trading. Explore our list of available brokers to find the one to help execute your strategies. Don't forget to do your research before getting to trading. Explore ETFs metrics in our ETF screener to find a reliable opportunity.
STIP invests in bonds. See more details in our Analysis section.
STIP expense ratio is 0.03%. It's an important metric for helping traders understand the fund's operating costs relative to assets and how expensive it would be to hold the fund.
No, STIP isn't leveraged, meaning it doesn't use borrowings or financial derivatives to magnify the performance of the underlying assets or index it follows.
In some ways, ETFs are safe investments, but in a broader sense, they're not safer than any other asset, so it's crucial to analyze a fund before investing. But if your research gives a vague answer, you can always refer to technical analysis.
Today, STIP technical analysis shows the strong buy rating and its 1-week rating is strong buy. Since market conditions are prone to changes, it's worth looking a bit further into the future — according to the 1-month rating STIP shows the strong buy signal. See more of STIP technicals for a more comprehensive analysis.
Today, STIP technical analysis shows the strong buy rating and its 1-week rating is strong buy. Since market conditions are prone to changes, it's worth looking a bit further into the future — according to the 1-month rating STIP shows the strong buy signal. See more of STIP technicals for a more comprehensive analysis.
Yes, STIP pays dividends to its holders with the dividend yield of 3.01%.
STIP trades at a premium (0.09%).
Premium/discount to NAV expresses the difference between the ETF’s price and its NAV value. A positive percentage indicates a premium, meaning the ETF trades at a higher price than the calculated NAV. Conversely, a negative percentage indicates a discount, suggesting the ETF trades at a lower price than NAV.
Premium/discount to NAV expresses the difference between the ETF’s price and its NAV value. A positive percentage indicates a premium, meaning the ETF trades at a higher price than the calculated NAV. Conversely, a negative percentage indicates a discount, suggesting the ETF trades at a lower price than NAV.
STIP shares are issued by BlackRock, Inc.
STIP follows the ICE US Treasury 05 Year Inflation Linked Bond Index - Benchmark TR Gross. ETFs usually track some benchmark seeking to replicate its performance and guide asset selection and objectives.
The fund started trading on Dec 1, 2010.
The fund's management style is passive, meaning it's aiming to replicate the performance of the underlying index by holding assets in the same proportions as the index. The goal is to match the index's returns.