Energy ETFs: Policy, Solar, Gas, and NuclearEnergy ETFs serve as a strategic tool for capturing growth in specific sectors while reducing the risk associated with individual stocks. Let’s take ETFs in the alternative energy sector (solar, wind, nuclear). They dominate thanks to favorable policies and decarbonization trends. Natural gas ETFs, on the other hand, remain volatile but offer long-term protection against inflation. Yes, North America is a key driver of growth in solar and wind energy, but political instability and regulatory changes have reduced short-term returns.
If we touch on a broader selection of energy ETFs, AMEX:TAN (Invesco Solar ETF) and AMEX:NLR (VanEck Uranium and Nuclear ETF) are worth a look. The former also has broad exposure to subsectors (e.g., infrastructure, utilities). While U.S. solar and wind energy producers are leading the way, the respective ETFs are limited, and TAN is really the main one. In such a context, there is reason to believe that the SEC's decision on the XRP ETF and the impact of Trump's policies on nuclear power play a key role in the selection process. The SEC's approval of the natural redemption Bitcoin ETF and the impact of Trump's policies on the nuclear energy and oil markets are the most relevant here for this purpose.
To the question of the low returns of some energy ETFs, I tend to highlight those that are most affected by political instability. An example of a bad ETF that illustrates the low returns of energy ETFs is reverse ETFs. Indeed, there are many known problems with inverse leverage ETFs such as NRGD.P and DUG.P. These ETFs exhibit high volatility, in part precisely because of their inverse strategies, thereby amplifying market fluctuations and not keeping pace with decarbonization trends. These are some basic examples of bad choices, especially for long-term investors focused on growth sectors.
In addition, a comparison of one-year and three-year returns indicates that short-term volatility is higher, so diversified, low-cost ETFs with a good issuer reputation should be favored. Of course, political risks increase short-term volatility, but they also create long-term opportunities for nuclear and renewable energy ETFs.
Trade ideas

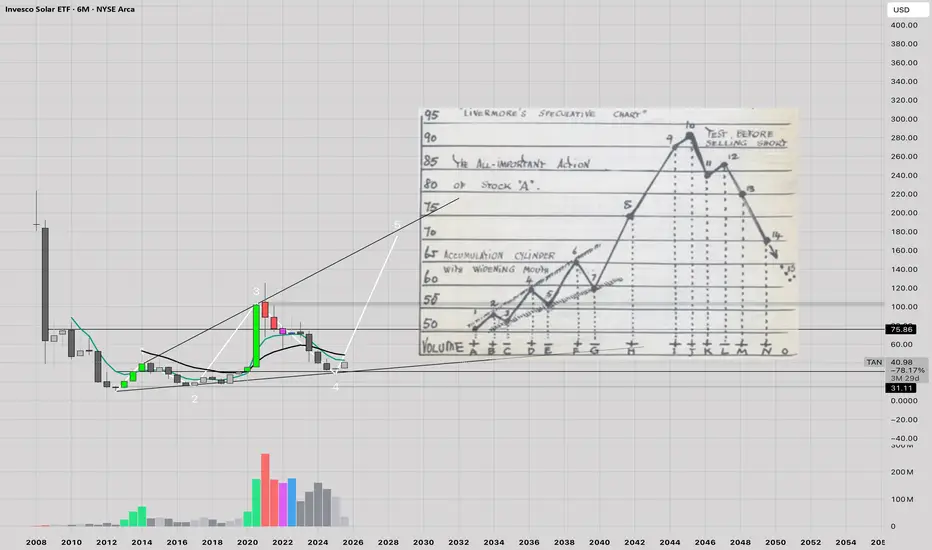
Starlight is the future ?"As we progress along the Kardashev Scale, energy harnessed on Earth will increase a hundredfold and will mostly be solar aka fusion aka starlight.
Then energy harnessed will increase perhaps a billionfold if we make it to Kardashev II, with space solar power, and another billionfold if we harness the energy of our galaxy. " - Elon Musk
If solar energy was really the future wouldn't this get accumulated? I guess we are about to find out .
Targets: higher, stoploss: 0
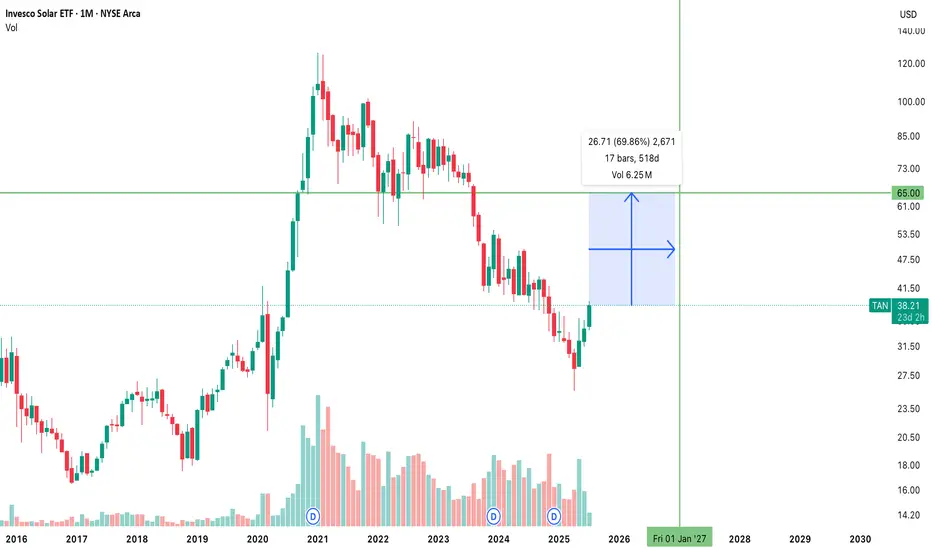
$TAN $65 STRIKE CALLS EXPIRING JAN 15, 2027 (17 MONTHS AWAY)WILL THIS PRINT???
AMERICA WILL RUN INTO A POWER CRISIS 2025-2035
The U.S. power grid is nearing a breaking point as AI, robotics, and data centers drive unprecedented electricity demand. By 2030, data centers could consume 9% of U.S. power, doubling from 2023, with AI queries alone using 10x the energy of a Google search. Robotics and manufacturing add further strain. The grid, however, is unprepared—aging infrastructure, permitting delays, and labor shortages hinder upgrades. Virginia and Texas already face shortages, with grid connection wait times up to 7 years. Renewables can’t scale fast enough without $720B in grid investments. Tech giants’ carbon-neutral goals may falter, relying on fossil fuels. Without urgent action—faster permitting, workforce growth, and innovations like microgrids—power shortages could cripple AI progress and the digital economy.
They can drill baby drill, but the private sector has solar. Tesla should be in this ETF. The US gov't may even print more billions and pump into this sector. ITS BLOODY OBVIOUS.
$TAN Is This Getting Ready for a Stage 2 Breakout?Clean Energy (Solar) has been in a downtrend since January 2021! Every time it looks like it is setting up for a stage 2 breakout, it has broken down. Will this time be different?
Here is what I see on this chart.
TAN
was in a clear downtrend until mid-December 2024. Then it challenged its previous high from the beginning of December. That failed BUT, it seems to have found a bottom as here we are in early February, and it has not sunk any lower than the December lows.
I am optimistic that we may be ready to enter a Stage 2 uptrend. However, it has work to do. The first step is to get up and over the 50 DMA (red). Next it needs to break the Downtrend line. It also needs to put in a higher high and finally put in a higher low. As I said, it has work to do.
Having said all of that, I have an alert set just over the 50 DMA where I will look for a good entry where I can put in a tight stop should I decide to make the trade. IF, it is going to enter a sustained uptrend it “could” be a big winner. All TBD.
These are my ideas, if you think it makes sense for you, please make it your own trade that fits within “your” trading plan.

Opening (IRA): TAN February 21st 32 Covered Call... for a 31.17 debit.
Comments: Still in the top 5 underlyings for IV on my ETF board, with 30-day at 35.0%. Adding at strikes better than what I currently have on after exiting the 33's at 50% max. Selling the -75 delta call against stock to emulate the delta metrics of a 25 delta short put, but with the built-in defense of the short call.
Metrics:
Buying Power Effect/Break Even: 31.17/share
Max Profit: .83
ROC at Max: 2.66%
50% Max: .42
ROC at 50% Max: 1.33%
Will generally look to take profit at 50% max.

Opening (IRA): TAN Nov 15th 37 Covered Call... for a 35.89 debit.
Comments: Relatively decent IV here at 42.8%. Selling the -75 delta call against stock to emulate the delta metrics of a +25 delta short put, but with the built-in defense of the short call.
Metrics:
Buying Power Effect/Break Even: 35.89
Max Profit: 1.11
ROC at Max: 3.09%
50% Max: .56
ROC at 50% Max: 1.55%
Will generally look to take profit at 50% max; roll out short call on test.

Opening (IRA): TAN January 17th 33 Covered Call... for a 32.29 debit.
Comments: ETF IV > 35% with 30-day currently at 39.7%. Adding to my position at strikes better than what I currently have on, selling the -75 delta call against stock to emulate the delta metrics of a 25 delta short put, but with the built-in defense of the short call. Dinking and doinking on "little stuff" running into year's end ... .
Metrics:
Buying Power Effect/Break Even: 32.29/share
Max Profit: .71
ROC at Max: 2.20%
50% Max: .36
ROC at 50% Max: 1.10%
Will generally look to take profit at 50% max.

Opening (IRA): TAN Jan 17th 33 Short Put... for a 1.01 credit.
Comments: Adding to my TAN position at a strike/break even better than what I currently have on. Here, going Plain Jane short put, since there isn't a great advantage to going monied covered call here because the IV skew isn't between the call and put sides isn't significant.
Metrics:
Buying Power Effect/Break Even: 31.99
Max Profit: 1.01
ROC at Max: 3.16%
50% Max: .52
ROC at 50% Max: 1.58%
Will generally look to take profit at 50% max.

Opening (IRA): TAN Dec 20th 34 Covered Call... for a 32.69 debit.
Comments: High IVR/IV at 115.8/57.1. Adding a rung out in December to my position at a break even better than what I currently have on. (See Post Below). Selling the -75 delta call against stock to emulate a 25 delta short put, but with the built-in defense of the short call.
Metrics:
Buying Power Effect/Break Even: 32.69
Max Profit: 1.31
ROC at Max: 4.01%
50% Max: .66
ROC at 50% Max: 2.00%
Will generally look to take profit at 50% max.

Opening (IRA): TAN October 18th 33/40/40/47... for a 3.55 credit.
Comments: Another risk one to make one iron fly in an underlying I'm not currently in with fairly decent 30-day IV at 38.9%.
Metrics:
Buying Power Effect: 3.45
Max Profit: 3.55
ROC at Max: 102.90%
25% Max: .89
ROC at 25% Max: 25.72%
Will look to take profit at 25% max.

TAN breakdown possible . Us Stockrejected from upper trendline
40 below weak
38.50 / 37.50 can test soon
if upper TL break then trade invalid

Opening (IRA): TAN August 30th 38 Covered Call... for a 37.00 debit.
Comments: Back into TAN (30-Day IV: 47.6%), selling the -76 call against stock to emulate the delta metrics of a 25 delta short put, but with built-in short call defense. Going with the August 30th, 46 DTE contract.
Metrics:
Buying Power Effect/Break Even: 37.00/share
Max Profit: 1.00 ($100)
ROC at Max: 2.63%
50% Max: .50 ($50)
ROC at 50% max: 1.32%
Will generally look to take profit at 50% max/roll the short call for duration on test.

TAN Breakout possible , US Stock40.50 above swing high breakout possible
41.50 above trendline breakout possible
41.30/42/43/45/46 can test soon

TAN LONGTAN has been consolidating for the last few weeks on a major support zone. I believe a breakout to the upside is eminent. TAN may be a big winner in the energy sector.

Opening (IRA): TAN August 16th 39 Covered Call... for a 37.86 debit.
Comments: High IVR/IV at 55.1/41. Selling the -75 call against stock to emulate the delta metrics of a 25 delta short put, but with the built-in defense of the short call.
Metrics:
Buying Power Effect/Break Even: 37.86
Max Profit: 1.14
ROC at Max: 3.01%
50% Max: .57
ROC at 50% Max: 1.50%
Will generally look to take profit at 50% max.

Opening (IRA): TAN August 16th 37 Short Put... for a .93 credit.
Comments: High IVR/IV at 51/44. Adding a short put in the vicinity of the 25 delta strike on weakness to my covered call, which has a 37.86 break even. (See Post Below).
Metrics:
Break Even/Buying Power Effect: 36.03
Max Profit: .93 ($93)
ROC at Max: 2.44%
ROC at 50% Max: 1.22%
Will generally look to take profit at 50% max; roll for credit and duration if the TP doesn't hit.

TAN Monthly ForecastLongterm position taken in TAN solar ETF.
Immediate structural resistance near 47. Major resistance at 50-618 fib extension from ATH.
Any break and close of Hagopian line will threaten longer term count.


Solar stocks follow energy prices (crude oil).Solar stocks follow energy prices (crude oil) and AMEX:USO (oil etf) is about to break out. I read that chinese are outcompeting the west in cheaper solar products. ie NYSE:JKS
TNX is at bull market, crude oil and yields correlate (not sure which one cause the other).
I look at everything trough probabilities since nothing is ever known.
Stocks do bad when economy does good. But energy sector performs well during good economy, whilst everything else is falling (Tech). Peak tech means bottom for energy?
I think these are good hedge plays, if you believe rising oil or yields pose risk.
Recently Chinese gov asked Jack Ma to return because their financial markets did poorly. There could be a sentiment shift, where indicator will be NYSE:BABA performance. People might still have an old bias?

$TAN Up 17% in 2 Days!Who says you cannot make big returns on ETF's?
AMEX:TAN the Solar Sector ETF Is on fire. It looks like rotation back into the beaten-up sector. Names Like NASDAQ:FSLR and NASDAQ:ENPH up even more. Rather than take the risk on an individual name I have opened a ¼ sized position in this ETF. I will be looking to bring this up to a full-sized position on any consolidation.
This ETF has institutional accumulation volume going back over a month. It has regained all MAs except for the 40 Week MA in white. All shorter-term MA’s, including the 50 Day Moving Averages are turning up. My stop is set below yesterday’s low and the horizontal line of support / resistance.
Ideas not investing / trading advice. Comments always welcome. Thanks for looking.

Solar recovery? The renewable energy sector has not had a good year because of rising interest rates. Most of the companies are debt-financed with thin revenues but they offer significant future value as companies and households turn to a sustainable source of energy.
If the first rate cut is announced mid 2024, clean/renewable energy companies and ETFs will have a stable recovery moving forward.
We have just added the ETF to our portfolio after a significant sell-off year to date. The volume spike in November is a good indicator that the ETF possibly bottomed out. If not, another sell-off will not be as aggressive, and looking at accumulating for the long haul.

25-30% more downside for renewables: inflation is kryptonite2024 could be another terrible year for renewables.
Renewable stocks have done terribly since inflation picked up. With high rates and therefore high costs of capital, renewables projects "with the promise of zero-to-no OpEx" are facing CapEx rates that are having companies and individuals pull out of renewables commitments one after the other.

