ANKRBTC trade ideas

ANKR/BTC (Key Support 41 sat?)ANKR/BTC
-This coin has dropped over -40% from the High at 85 sat area
-During the Bitcoin breakout, most Altcoins decreased more than -30% its value
-Looking at this coin, The next Key levels to watch are the 41 sat range
-Because this is a confluence of previous resistance and support
-The probability of a strong bounce reaction in this area is High
-Also, 40 sat is a whole number and a good psychological support
-Keep an eye of this asset and enable your Alerts

ANKR - Perfect cup and handle formationAnkr has printed a great cup and handle formation on the daily and looks to be close to the bottom of the handle.
Expecting a 50 - 100% rise from here over the next few months.


AnkrBtc Trading opportunityLooking closely on the wave count of ANKR it shows we just completed wave 3 movement, which means we have huge potential for a drop for wave 4. The idea is based on accumulating through the bottom of wave 4 for the last leg of the upside move.
Focus more on the long back zone and accumulate through it.
Kindly go through the chart and do leave us your comments to let us know how you feel about our view.
Moreover REMEMBER to appreciate our effort with your likes and always subscribe(Click follow) to our profile for fast and quick daily updates on all our trading ideas
Thank you.

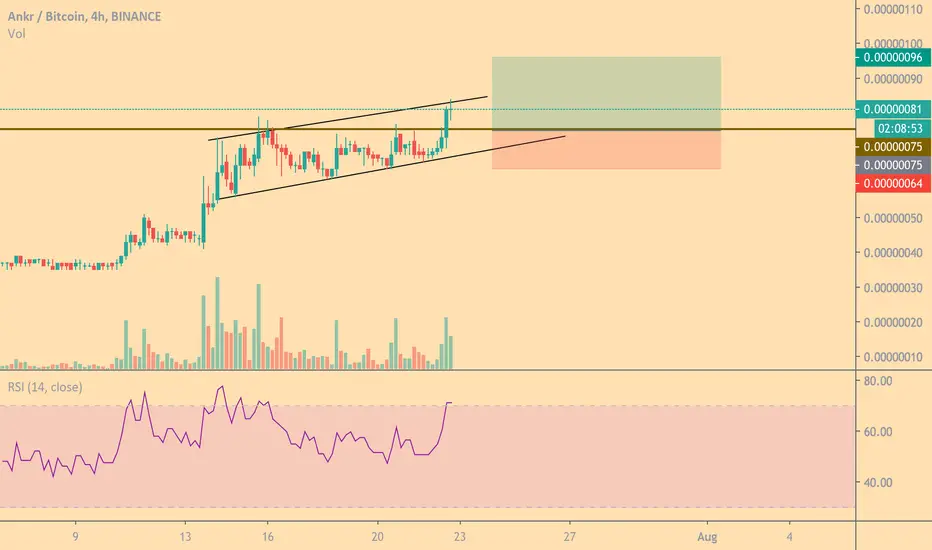
ANKR/BTC LONG POSITIONLooking pretty bullish here after bouncing off trendline support and rising above 50 EMA, buying volume could be taking over
ENTRY: 68
TP1: 74
TP2: 79
SL: 60


buy limit ankrthe price goes down till face to support line and will go up and it claim to make a triangle

ANKR BTCANKRBTC - i love this coin. it will probably just go parabolic. however, we cant fomo in to it. I already took profits so.... here are my re-entry ideas. hoping for just a bounce in the rising wedge, before a parabolic move higher.

Onwards and Upwards Cant promise if you can get an entry on this but if this retests then this is getting sent!
$ANKR breakoutSuper Bullish.
Waiting for breakout. Good Volume. Breakout and then we fly.
TP: 95-108-125
SL: 67 (support holding good)

ANKR opportunityGood mid term opportunity :
Entry between 38 fibo and 50fibo points
between 68 and 70 ...
TP1 70
TP2 74
TP3 79
TP4 85
SL: 4H candle close under 61

#ANKR buy if support holdstrading inside a triangle, buy if support holds
#notfinancialadvisor
#DoYourOwnResearch

ANKR/BTC in a strong uptrend... Take profits while you canUsing Fib extension to determine the next area of resistance for this uptrend... The 1W timeframe gives a pretty clear idea where we are headed...
Current price 0.00000046
Next major resistance point at 1.618 (0.00000060)
Other bullish indicators used to confirm this trend:
MACD: Currently showing bullish and rising...
ADX: currently above 20, and rising... which indicates an increasing strength in the uptrend
You can ride this and take profits... If you havent bought earlier. You can buy in now, and sell at 0.00000060
Like this idea, and follow me. Thanks for your support!

Bullish Push for 100 satsBasic analysis of what I am thinking on ANKR. Looks to be pushing toward that 70 sat range on its way to 100 sats. I tried to identify some areas of support if it falls out of the triangle. Let me know what you think.


ANKRBTC - New highs incoming?ANKRBTC
Entry: 41-46 sats
Target: 54 sats, 67 sats
Stop loss: 38 sats
Bullish Indicators
- Gradual slow uptrend (instead of P&D)
- Channel has been broken upwards and support is building
- About to break its biggest resistance

ANKR trade ideaHello, traders,
ANKR is testing an important support level and the bulls are showing straight next to this important support level, and the price still has a wave 5 to go.
Until we are above the short term uptrend line we are bullish on this asset.
Push the like button and follow us on tradingview.

ANKR/btc$ANKR #ANKR
@ankr
Great Project
-WEB3 cloud Infrastructure
-Supprts #ETH2.0
-Provides staking Servies
-Provides #OneClickNodeIntegration
- #DEX integration
- #DeFi integration


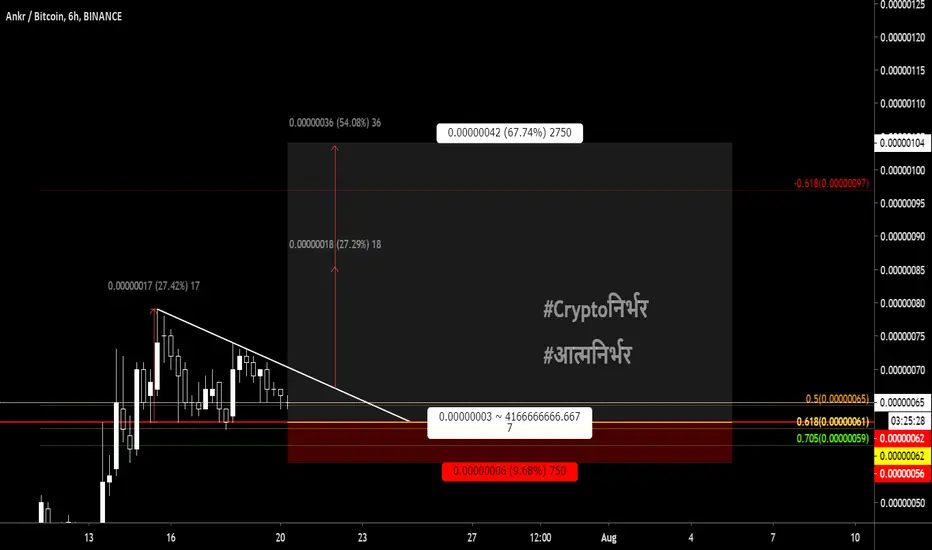
Ankr Network Full Chart AnalysisToday, Ankr Network (ANKRBTC) hit the mid-February high/peak, there is room for more.
Here we have a potential double top forming but also a bullish ascending channel.
Strong resistance is being faced right now and 40 satoshis (0.00000040) is the next challenge.
If this level is conquered, prices moving, and closing above it, we can easily see additional growth (zoom out for more targets).
But if ANKRBTC fails to conquer this level, we will see a drop like last time (red arrow).
Seeing how all the other altcoins are doing, there is good potential to see more up. This is a tricky spot though, make sure to have a plan (and very tight stop-loss) before you trade.
This is not financial advice.
Thanks a lot for your support.
Namaste.
Previous chart | Perfect hit May 5th

#ANKRBTC #ANKR $ANKR CRAB PATTERN BULLISH EYE ON THIS Ankr has harmonic Crab pattern and it seems that it has a good potential
