Might ApeCoin (APE) suddenly pump the same way as AXS did ?ApeCoin (APE) potential growth projection
Gaming and AI is now the new trend.
ApeCoin (APE) Fibonacci projection in 1D timeframe shows mid term potential growth.
Question remains will it show same type of instant boost as AXS did from 5 to 14 within few days only.
ApeCoin (APE) and Axie Infinity ( AXS ) are two my favourites for trading. AXS is not so hype project as the newer APE but has shown lately very nice boost. These two tend to move together, always one first and another soon after.
Gaming is certainly one to look into and APE is certainly very promising one.
In case the bull market lasts this scenario is only question of time, might happen suddenly. I would expect first a correction but a lot depends of the Bitcoin move and the money flow into the industry and macro economics.
APE is one of my favourite for trading in futures , high leverage can be applied easily, a bit slow but quite trustworthy in it's movement.
Good Luck!
When you like what we do give us Boost and comment!
And follow us in different socials: womenincrypto48
Join the Revolution!
Women in Crypto - WiC48
May you have more profit than you could ever wish for !
Market insights

APE USDT forecast✅ ✅ Risk warning, disclaimer: the above is a personal market judgment and analysis based on published information and historical chart data on The trading view,
And only some of these analyzes are my actual real trades.
I hope Traders consider I am Not responsible for your trades and investment decision.

APE falling wedge this is ape on a daily level and as you can see, it’s been traveling in the wedge for quite some time… We are resistance now, but hopefully we can have a break out

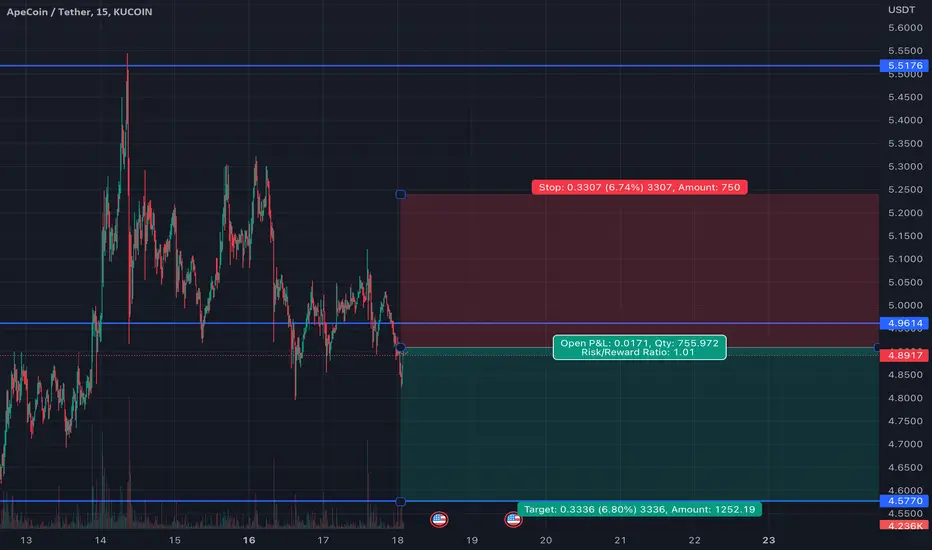
#APE LONGI have set a alarm on 5.760, why ? because that dot dot line is above the major resistence like u can see on VPVR (right side) and TP from my opinion i will set it at 7.220.
Feel free to take it or comment !

✅TS ❕ APEUSD: broke up the down trend✅✅ APE broke the descending channel.
The price is moving in an uptrend.
Possible price increase. ✅
🚀 BUY scenario: long to 6.069. 🚀
----------------------------------------------------------------------------
Remember, there is no place for luck in trading - only strategy!
Thanks for the likes and comments.

Ape Neckline Re-test possibleI'm seeing a bearish divergence on the RSI and since we broke out of this inverse head and shoulders, but had not had our re-test yet, maybe something is cooking here. I think we have to be ready for a possible re-test of the neckline, which coincides with the bottom of the bollinger bands.
If we do drop there, im buying. Such move is not guaranteed by any means, as we are very bullish currently, who knows if crypto will just keep climbing up and up, but its hitting a strong resistance here and there might be some slowdown on the way.

APEUSDT IDEA✅ ✅ Risk warning, disclaimer: the above is a personal market judgment and analysis based on published information and historical chart data on The trading view,
And only some of these analyzes are my actual real trades.
I hope Traders consider I am Not responsible for your trades and investment decision.

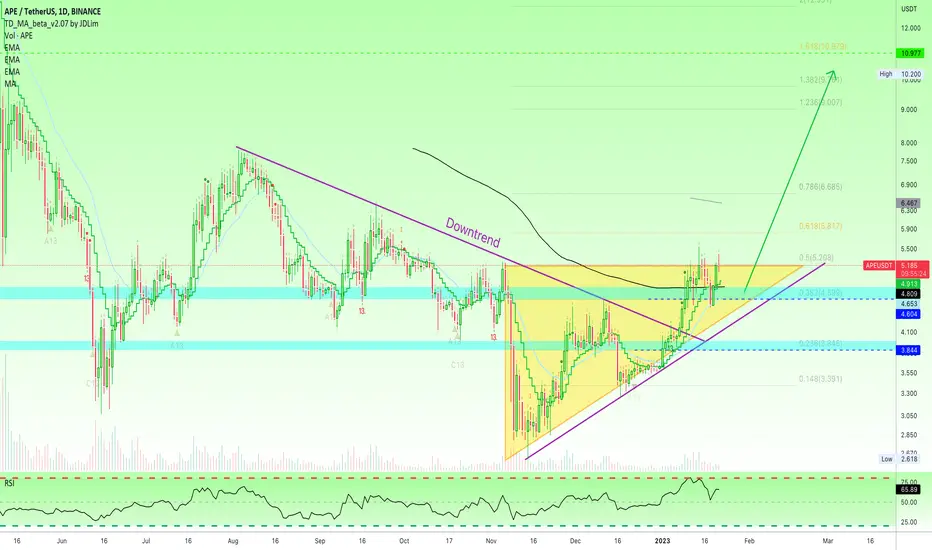
✴️ APE Aims At $10 After Triangle & Broken DowntrendAPEUSDT has come out ahead of a rising triangle and also broke free of its August 2022 downtrend.
Currently trading above MA200 with a bullish cross with EMA10 happening at the same time; EMA10 and MA200 bullish cross.
MA200 was initially conquered 10-Jan., prices moved down and this level was tested as support.
Now that APEUSDT is trading back above it, this is the confirmation that it holds.
Above MA200 = Potential for long-term growth.
As long as the current price is above this black line, we can expect additional growth.
The immediate target is set at $5.815 followed by the range $6.500 - $6.685.
Only after these levels are taken out can we see the light to $10+.
After more than a year of bear action, it is not incredible to see this and other pairs growing for a few months.
Call it a relief rally or a recovery... It doesn't matter as long as Cryptocurrency grows.
Namaste.

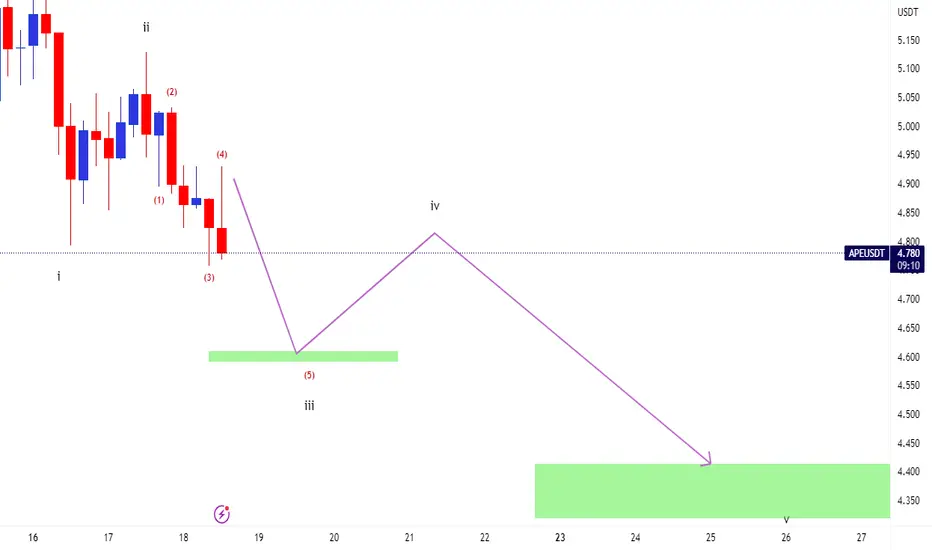
According to the previous analysis, APE is movingApeUsdt in my previous analysis down to complete wave 3 after that wave 4 now start down to wave 5 in c (abc) with stop-loss above wave 4 and target wave 5 in c you can sell it just with money managment and 1% your account, No trade is 100% and only money management is the winning card of the market

APEUSDT By HesamUNTHey traders
lets take a scalp trade at APE
what u think about this swing ??
share ur chart and leave a comment

APEUSD - Up Channel Up channel for APE, the channel is rather small
Falling Wedge also that has broken out
This is the daily chart for APEUSD

Short APEThe recent formation of a bearish divergence on the 12 hour chart, in conjunction with a previous 12 hour doji candle piercing the established EMA, serves as a clear indication of weakness at this current level. It is likely that APE will experience a downward trend and test the .618 Fibonacci retracement level.
This chart based off of The Elliot Wave Theory, Fibonacci, EMA’s, MacD , RSI , Momentum, and resistance/support zones combined with patterns.

APE Down To 4.40 in 4hApeUsdt in 5 waves down and now in wave 5 in 3 waves and down to 4.40 and after that we can enter long position in next my apeusdt analysis , but for now ape is bearish
💀ApeCoin💀Analyze (Road Map)🗺️(Update)🔁Today I updated Roadmap 💀ApeCoin💀 for you.
I suggest you carefully read my previous post about ApeCoin (according to my analysis, ApeCoin moved well).👇✅😎
ApeCoin is moving near the resistance zone on the daily time frame; also, it seems the D point of the bearish AB=CD harmonic pattern has formed in the TRZ(Time Reversal Zone).
I expect ApeCoin to decline to at least the EMA100 & support zone and the downtrend line.
Also, we can see the end of movement at the StochRSI indicator👇.
If ApeCoin can break the resistance zone upwards, we can confirm the end of the main wave Y; otherwise, the main wave X will continue.
ApeCoin Analyze ( APEUSDT ), Daily Timeframe ⏰(Log Scale).
Do not forget to put Stop loss for your positions (For every position you want to open).
Please follow your strategy, this is just my idea, and I will be glad to see your ideas in this post.
Please do not forget the ✅' like '✅ button 🙏😊 & Share it with your friends; thanks, and Trade safe.

💀ApeCoin💀 Analyze (Road Map)🗺️(10/08/2022)!!!Today, I want to show you the road map of ApeCoin. Let's start with the definition of 💀ApeCoin💀.
What Is ApeCoin?
ApeCoin is an ERC-20 governance and utility token used within the APE Ecosystem to empower and incentivize a decentralized community building at the forefront of web3.
ApeCoin holders govern themselves via the decentralized governance framework controlling the ApeCoin DAO, and vote on how the ApeCoin DAO Ecosystem Fund should be used. The APE Foundation administers proposals agreed upon by ApeCoin holders.
ApeCoin is making a Double Three Correction(WXY) these months.
ApeCoin is running in wave Y.
I expect ApeCoin will complete the Double Three Correction at the 🎯targets🎯 I specified in my chart.
ApeCoin Analyze (APEUSDT), Timeframe 12H⏰(Log Scale)
Do not forget to put Stop loss for your positions (For every position you want to open).
Please follow your strategy, this is just my idea, and I will be glad to see your ideas in this post.
Please do not forget the ✅' like '✅ button 🙏😊 & Share it with your friends; thanks, and Trade safe.

APE Coin: We have a bearish view in short term.... 😢Hello everyone!
We are most likely wrong but at the moment we are not attracted by the ApeCoin trend, so our idea is to sell this short-term rally. Technically, we see a area around 3.80 as a potential short-term bearish target.
Next resistance area on 1h chart:
If this idea will be supported by your "Likes" we will continue to follow the crypto with updates below.
thanks for your attention and please... trade with care! 💖

APEUSDT ForecastHello Traders!
After Completing AB=CD pattern in #APEUSDT as you can see in the chart and the Regular Divergence in the top of the chart with check of MACD indicator , I assume the the price will go down to the support line . We have to manage the trade normally as usual . anything can happens!
What do you think?
Please Like and Comments to this post and let's talk technically on this matter.
love you all
Let's Master the Market together!


short per modelI don't short bc I don't have margin or futures but it shows short for the next 300 bars or so. not trading advice. good luck
APEUSDT Channel Low| Daily Resistance| Liquidity| Single PrintEvening Traders,
Today’s analysis – APEUSDT- trading away from its Channel High, losing support will lead to a deeper pullback,
Points to consider,
- Price Action Impulsive
- Channel Low Support
- Naked Single Print
- Lower Resting Liquidity
- Market High Low
APEUSDT’s immediate price action is trading towards an area of support that is in technical confluence with the Channel Low, Single Print, and a Liquidity Points, allowing for a bullish bias.
The immediate objective is the channel high, this will become more probable as resistances get breached on the way up.
Overall, APEUSDT is a valid long with defined risk, price action is to be used upon discretion/ management.
Hope this analysis helps, thank you for following my work
And remember,
“Dangers of watching every tick are twofold: overtrading and increased chances of prematurely liquidating good positions” – Jack Schwager

nfts the metaverse and whatnot, ape got it allape is the leader of the nft (and future metaverse) basket. the possibilities for this shitcoin are endless and they love it including you!
what is apecoin? its a meme shitcoin like doge and shib with utility. right now its groundbreaking (not) utility is to be able to participate in DAO votes and complementary purchases during NFT mint(games) and merch.
these are "micro" targets. on macro the targets are way beyond ath considering the potential of "the other side" (where apecoin most likely will be the leading in-game/metaverse currency)

LONGIt looks like in a good buy area, it might be a bit risky but with a stop loss around 2.5% it's worth the risk
Entry Points on the chart.
Targets and stop loss too.
