apeusdt position tradeWait for correction. And buy on this zone. This is my point of interest of buying accumulating
Related pairs

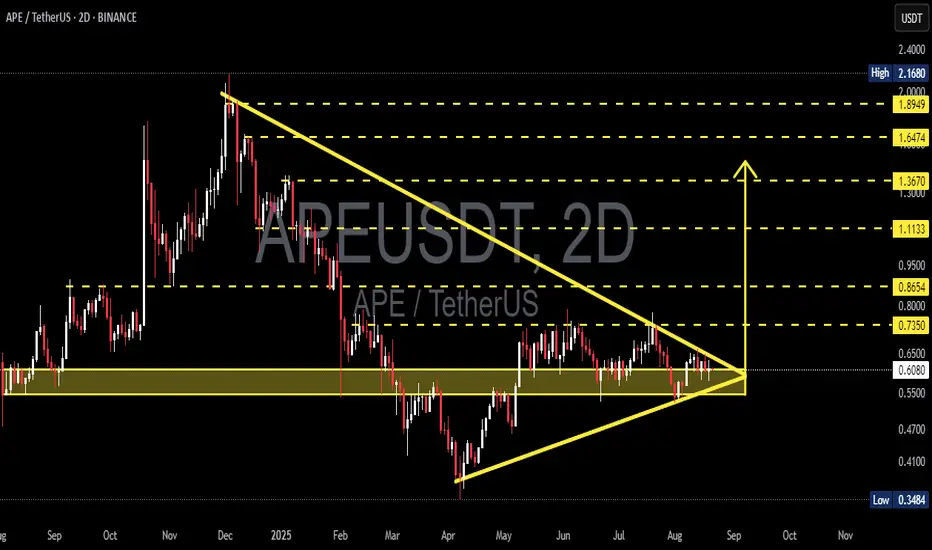
APE/USDT: Symmetrical Triangle – The Next Big Move is Loading!📊 Market Context:
APE/USDT is currently consolidating after a sharp move from the $2.168 high down to the $0.3484 low. The price action has now formed a symmetrical triangle, signaling compressed volatility and accumulation phase.
The $0.52 – $0.62 demand zone remains the critical support, while th
APEUSDT – 1D AnalysisHey traders! 👋
Looking at APEUSDT on the daily chart, we can see that the market has completed a clear 5-wave impulse to the downside. After that strong bearish move, the resistance line was broken, which gave us the first signs of a potential reversal.
From there, we formed a smaller 5-wave impul

APEUSDTAPEUSDT shows strong bullish momentum on the 1-hour chart, supported by MACD and RSI trends. However, the KDJ and Bollinger Bands suggest the asset is nearing overbought conditions, which could lead to a short-term pullback or sideways movement. Traders should watch for confirmation signals before m

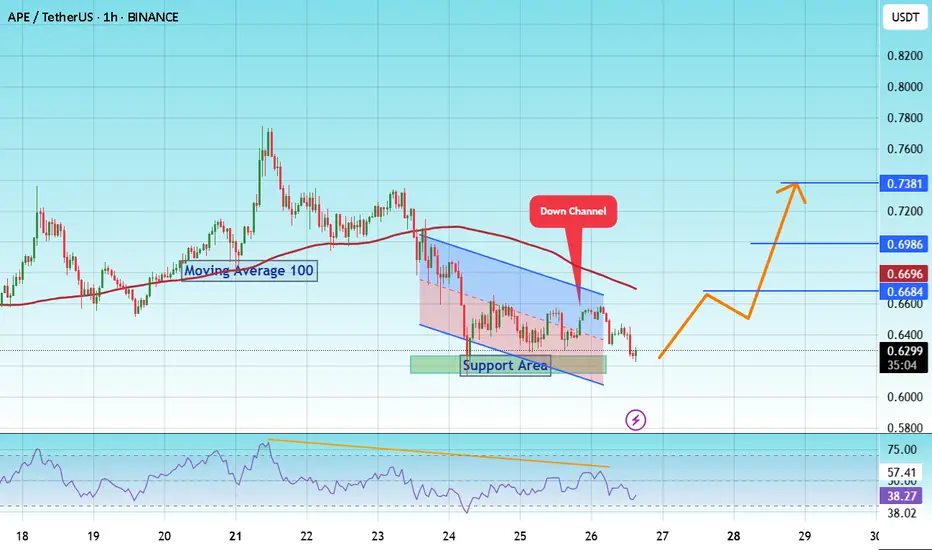
#APE/USDT Low Risk vs High Rewards#APE
The price is moving within a descending channel on the 1-hour frame and is expected to break and continue upward.
We have a trend to stabilize above the 100 moving average once again.
We have a downtrend on the RSI indicator that supports the upward break.
We have a support area at the lowe
Apecoin Technical Analysis · New All-Time High & Easy TargetsAs I told you just recently, the moving averages can be used in different ways. The main way is to gauge the market bearish or bullish potential and this is the classic way. The second one, less conventional, is to know how advanced is a trading pair within the current cycle.
Before everything was

ApeCoin Quick Update —Moving Next#APE
The price is moving within a descending channel on the 1-hour frame, adhering well to it, and is heading for a strong breakout and retest.
We have a bounce from the lower boundary of the descending channel, this support at 0.5827.
We have a bearish trend on the RSI indicator that is about to

Long APEUSDTBullish signal on APEUSDT
- Weekly divergence from RSI
- Reclaim daily resistance --> flip to support.
- Sentiment for crypto is bullish overall
Entry long at the pullback and target the above zones.
APEUSDT Poised for a Breakout! Cup & Handle Pattern Forming"Classic Pattern in a Bearish Market – A Big Move is Brewing!"
🧠 Technical Analysis Summary:
On the APE/USDT daily chart, we can clearly identify a Cup and Handle pattern, a classic bullish reversal structure that often signals the beginning of a significant rally. While many traders may be discou

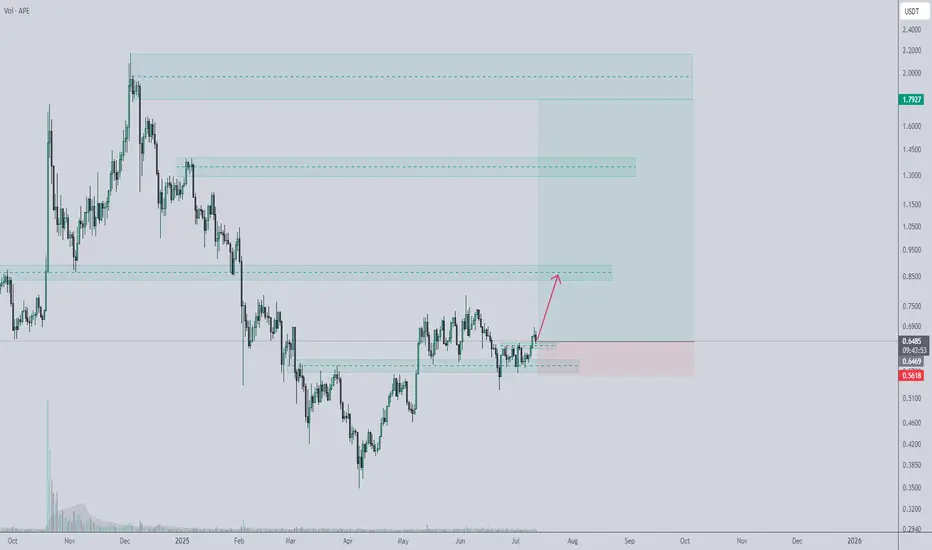
APE/USDT – Reversal Loading Below 0.6000APE is sitting on a major multi-timeframe support zone around 0.595–0.603. Structure already shifted on the weekly — this is no longer a clean downtrend. Price has reclaimed the 0.618 Fib and is now coiling below resistance.
Entries below 0.6000 are golden.
apeing in under 0.6000 and waiting for th

See all ideas
Summarizing what the indicators are suggesting.
Oscillators
Neutral
SellBuy
Strong sellStrong buy
Strong sellSellNeutralBuyStrong buy
Oscillators
Neutral
SellBuy
Strong sellStrong buy
Strong sellSellNeutralBuyStrong buy
Summary
Neutral
SellBuy
Strong sellStrong buy
Strong sellSellNeutralBuyStrong buy
Summary
Neutral
SellBuy
Strong sellStrong buy
Strong sellSellNeutralBuyStrong buy
Summary
Neutral
SellBuy
Strong sellStrong buy
Strong sellSellNeutralBuyStrong buy
Moving Averages
Neutral
SellBuy
Strong sellStrong buy
Strong sellSellNeutralBuyStrong buy
Moving Averages
Neutral
SellBuy
Strong sellStrong buy
Strong sellSellNeutralBuyStrong buy
Displays a symbol's price movements over previous years to identify recurring trends.
Frequently Asked Questions
The current price of ApeCoin / USD Tether (APE) is 0.5798 USDT — it has fallen −0.46% in the past 24 hours. Try placing this info into the context by checking out what coins are also gaining and losing at the moment and seeing APE price chart.
ApeCoin / USD Tether price has fallen by −1.58% over the last week, its month performance shows a −10.62% decrease, and as for the last year, ApeCoin / USD Tether has decreased by −15.97%. See more dynamics on APE price chart.
Keep track of coins' changes with our Crypto Coins Heatmap.
Keep track of coins' changes with our Crypto Coins Heatmap.
ApeCoin / USD Tether (APE) reached its highest price on Apr 28, 2022 — it amounted to 27.3616 USDT. Find more insights on the APE price chart.
See the list of crypto gainers and choose what best fits your strategy.
See the list of crypto gainers and choose what best fits your strategy.
ApeCoin / USD Tether (APE) reached the lowest price of 0.1000 USDT on Mar 12, 2025. View more ApeCoin / USD Tether dynamics on the price chart.
See the list of crypto losers to find unexpected opportunities.
See the list of crypto losers to find unexpected opportunities.
The safest choice when buying APE is to go to a well-known crypto exchange. Some of the popular names are Binance, Coinbase, Kraken. But you'll have to find a reliable broker and create an account first. You can trade APE right from TradingView charts — just choose a broker and connect to your account.
Crypto markets are famous for their volatility, so one should study all the available stats before adding crypto assets to their portfolio. Very often it's technical analysis that comes in handy. We prepared technical ratings for ApeCoin / USD Tether (APE): today its technical analysis shows the sell signal, and according to the 1 week rating APE shows the sell signal. And you'd better dig deeper and study 1 month rating too — it's sell. Find inspiration in ApeCoin / USD Tether trading ideas and keep track of what's moving crypto markets with our crypto news feed.
ApeCoin / USD Tether (APE) is just as reliable as any other crypto asset — this corner of the world market is highly volatile. Today, for instance, ApeCoin / USD Tether is estimated as 3.81% volatile. The only thing it means is that you must prepare and examine all available information before making a decision. And if you're not sure about ApeCoin / USD Tether, you can find more inspiration in our curated watchlists.
You can discuss ApeCoin / USD Tether (APE) with other users in our public chats, Minds or in the comments to Ideas.