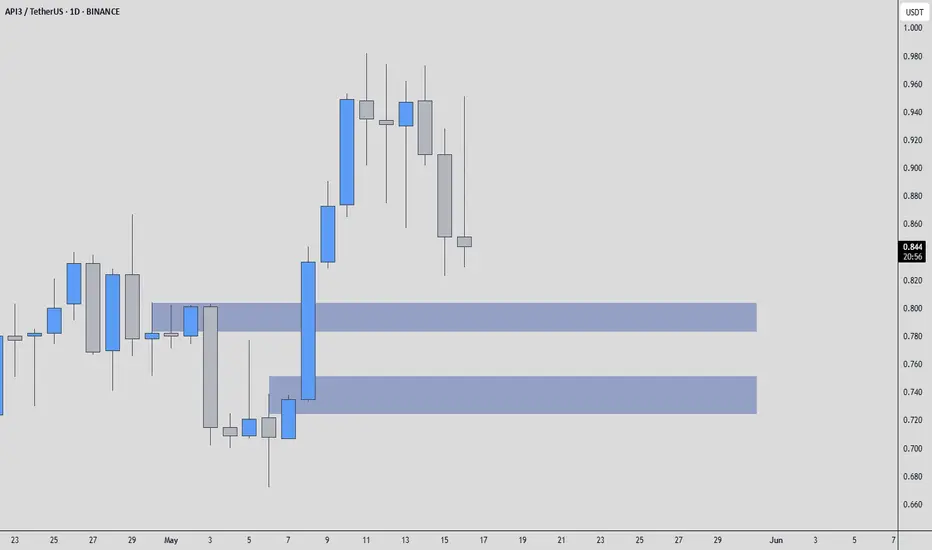
API3USDT - Looks Good!When most traders are looking at flashy pumps, I’m watching structure, confirmation, and where real buyers are hiding. In this case, the blue boxes are not just drawn for aesthetics, they represent potential accumulation zones, places where price might find its footing if approached with the right m
No news here
Looks like there's nothing to report right now
API3: The Perfect Short-Term Trade Setup (174% & 289% Profits)Let me explain why this is the "perfect short-term trade setup."
You know all these Altcoins we've been tracking together they hit bottom last month, 7-April. Here API3USDT hit bottom 11-March 2025 and produced a very strong reaction. It is as if buyers were really ready to rock this one-up.
The i

Trading opportunity for API3USDTBased on technical factors there is a Sell position in :
📊 API3USDT
🔴 Sell Now
🪫Stop loss 1.250
🔋Target 0.820
📏 R/R 1,5
💸RISK : 1%
We hope it is profitable for you ❤️
Please support our activity with your likes👍 and comments📝

API 3 Trade SetupNASDAQ:API 3 is approaching a good liquidity level. I am interested in trading it in the region highlighted in green. I am closely monitoring this region for a potential entry. If I saw a positive reaction i will take a trade.

#API3USDT is showing signs of recovery📉 LONG BYBIT:API3USDT.P from $1.1236
⚡️ Stop loss $1.1030
🕒 Timeframe: 1H
✅ Overview BYBIT:API3USDT.P :
➡️ The chart shows a gradual shift from a downtrend to possible reversal after forming strong support around $1.0680.
➡️ Price is currently attempting to break above the key resistance zon

API3USDT is BullishPrice was in a downtrend, however bullish divergence appeared on daily timeframe that led to the break of previous lower high. Bulls seem to be in the driving seat as first higher high is printed, if the momentum continues then we can expect further upside in price action as per Dow theory. Targets

API3 looks bearish (2H)API3 has not issued a bearish trigger yet, but considering that it has hit a key resistance level, formed a base, and the base has been broken, it is expected that the price will be rejected downward during the pullback.
We anticipate a drop from the red zone downward.
Targets are marked on the ch

API3USDT CHART ANALYSİS - EDUCATIONAL POSTThe NFT Concept
You may already know that each unit of value in a blockchain is called a token. In an open blockchain, all tokens are equal and interchangeable. For example, one bitcoin can be easily replaced with another, and nothing will change.
Non-fungible tokens are a game-changer, which wor

API3USDT(Api3) Updated till 22-03-25API3USDT(Api3) Daily timeframe range. PA having a continuous pullback from its new low. 1.252 is recent resistance if it can get valid close above it, it got long way to go. local support at 0.815 if it dont breaks it will push back.

API3.DAILY.20.3.2025API3.DAILY.20.3.2025
Mua spot API3 / Long API3
Target Spot: 30%
Holdtime: 24h
Entry: 0.891 (spot)
Goodluck!

See all ideas
Summarizing what the indicators are suggesting.
Oscillators
Neutral
SellBuy
Strong sellStrong buy
Strong sellSellNeutralBuyStrong buy
Oscillators
Neutral
SellBuy
Strong sellStrong buy
Strong sellSellNeutralBuyStrong buy
Summary
Neutral
SellBuy
Strong sellStrong buy
Strong sellSellNeutralBuyStrong buy
Summary
Neutral
SellBuy
Strong sellStrong buy
Strong sellSellNeutralBuyStrong buy
Summary
Neutral
SellBuy
Strong sellStrong buy
Strong sellSellNeutralBuyStrong buy
Moving Averages
Neutral
SellBuy
Strong sellStrong buy
Strong sellSellNeutralBuyStrong buy
Moving Averages
Neutral
SellBuy
Strong sellStrong buy
Strong sellSellNeutralBuyStrong buy
Displays a symbol's price movements over previous years to identify recurring trends.