API3CRYPTOCAP:API3 has clearly bottomed and the current structure offers a strong risk to reward setup. If momentum continues to build, I think it can easily reach $1 at the start of next year. This is a clean accumulation zone lining up for reversal.
Trade ideas
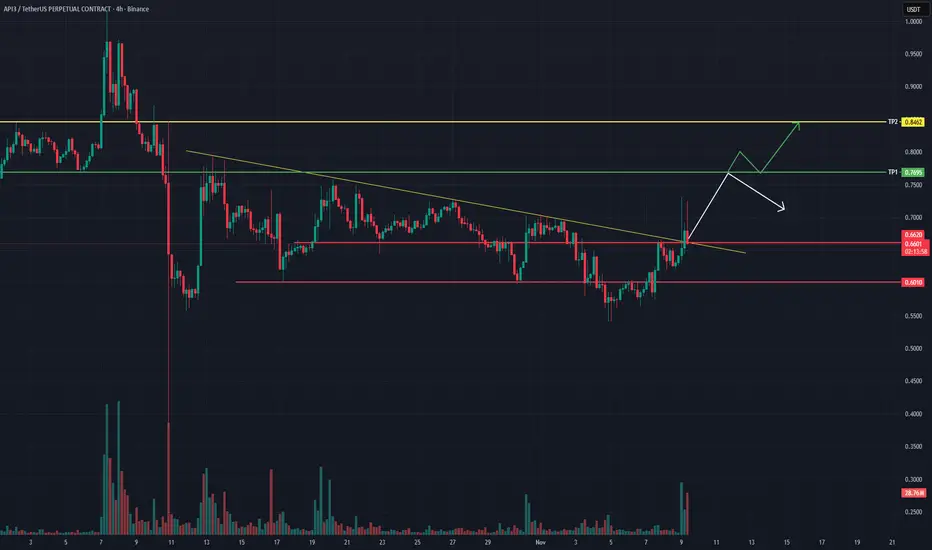
API3USDT 4H ChartThe price has successfully broken out of the descending trendline, showing early signs of bullish momentum.
If this breakout holds, potential targets are:
🎯 TP1: 0.7695
🎯 TP2: 0.8462
Support levels to watch for possible retest:
🟥 0.6620 and 0.6010
A healthy retest followed by strong volume confirmation could lead to a continuation toward higher levels.
📊 Breakout confirmed – waiting for retest and confirmation candle.
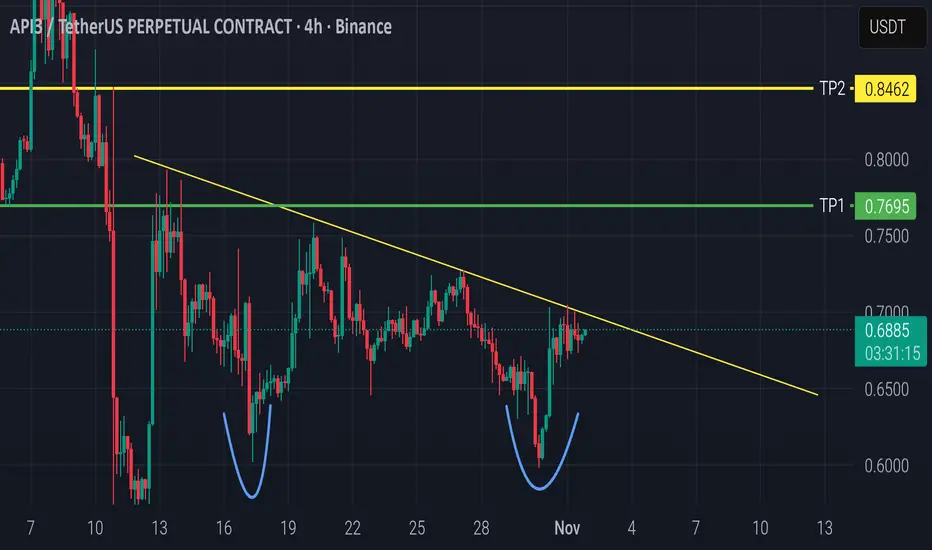
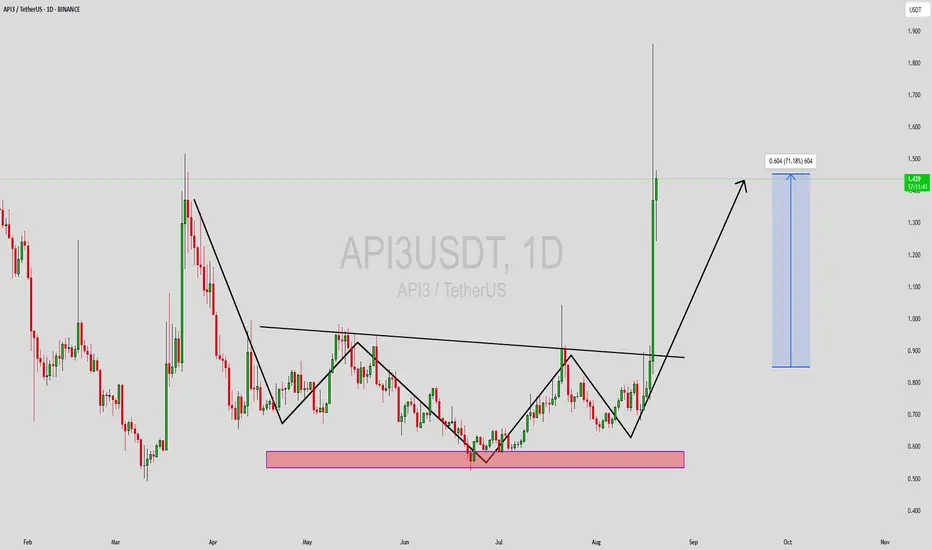
Possible Double Bottom Breakout FormingThe chart shows a clear Double Bottom pattern around the 0.60 zone, indicating a potential bullish reversal.
Price is now testing the descending trendline (neckline), and a confirmed 4H candle close above 0.69 with strong volume could trigger a breakout move.
🎯 Targets:
TP1: 0.7412
TP2: 0.8462
🛡️ Stop Loss: Below 0.67 or the previous low.
Volume is increasing, supporting the potential breakout — so entry can be considered now if volume keeps rising, or after a retest of the trendline for safer confirmation.
#API3USDT #Crypto #TradingView #TechnicalAnalysis #DoubleBottom #TrendlineBreakout
API3USDT Forming Bullish MomentumAPI3USDT is currently showing an impressive bullish pennant pattern, which often serves as a strong continuation signal in technical analysis. After a sharp upward move, the price has entered a brief consolidation phase, forming a tight pennant shape that indicates market indecision before the next breakout. This structure suggests that bulls are maintaining control, and once the price breaks above the resistance level, a powerful rally could follow — with potential gains of 190% to 200%+.
The trading volume behind API3USDT remains strong, supporting the idea of growing accumulation and investor confidence in the project. The consistent inflow of buying pressure and stable market participation are both positive indicators that the current pattern could soon resolve in favor of the bulls. Traders are closely monitoring this setup, as a confirmed breakout with volume could trigger a large upward move and accelerate momentum toward key resistance zones.
Investor sentiment is turning highly optimistic around API3, as it continues to gain attention within the decentralized data oracle sector. With solid fundamentals, increasing ecosystem adoption, and a promising technical structure, API3USDT is positioned as one of the more exciting opportunities in the market right now. If bullish momentum continues, the coin could deliver significant returns in the coming sessions.
✅ Show your support by hitting the like button and
✅ Leaving a comment below! (What is You opinion about this Coin)
Your feedback and engagement keep me inspired to share more insightful market analysis with you!

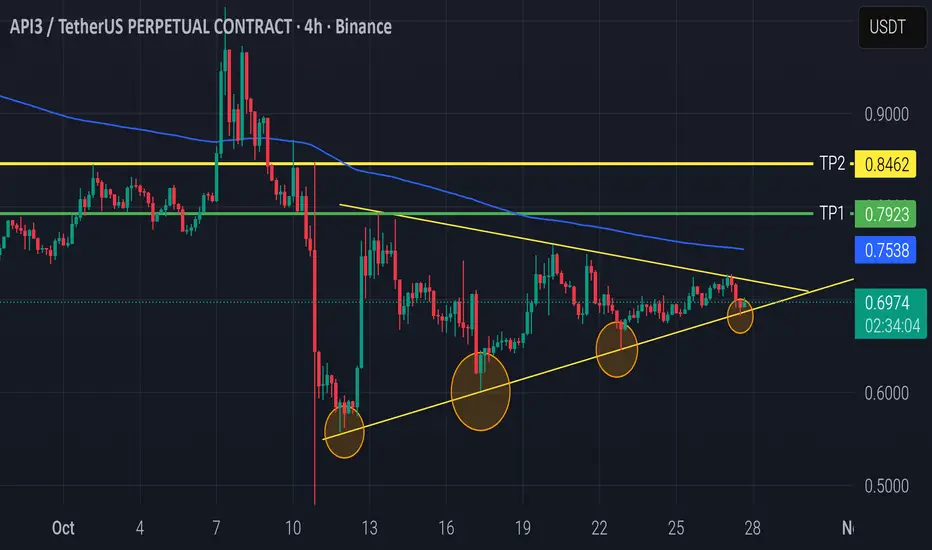
API3/USDT (4H)Price has just bounced perfectly from the ascending trendline, showing strong support and renewed buying pressure.
If momentum continues, we could see a breakout above the triangle and 200 EMA soon.
🟢 Entry idea: Entry can be considered now after the bounce from the trendline, or on confirmation above 0.75 USDT for safer entry.
🎯 TP1: 0.7923
🎯 TP2: 0.8462
🔴 Support: 0.70 (trendline support)
⚙️ Pattern: Symmetrical Triangle
⏰ Timeframe: 4H
📈 Bias: Bullish above 0.70
Volume is gradually rising — a breakout could be near.
What do you think — early entry here or wait for confirmation? 👀
API3USDT UPDATE#API3
UPDATE
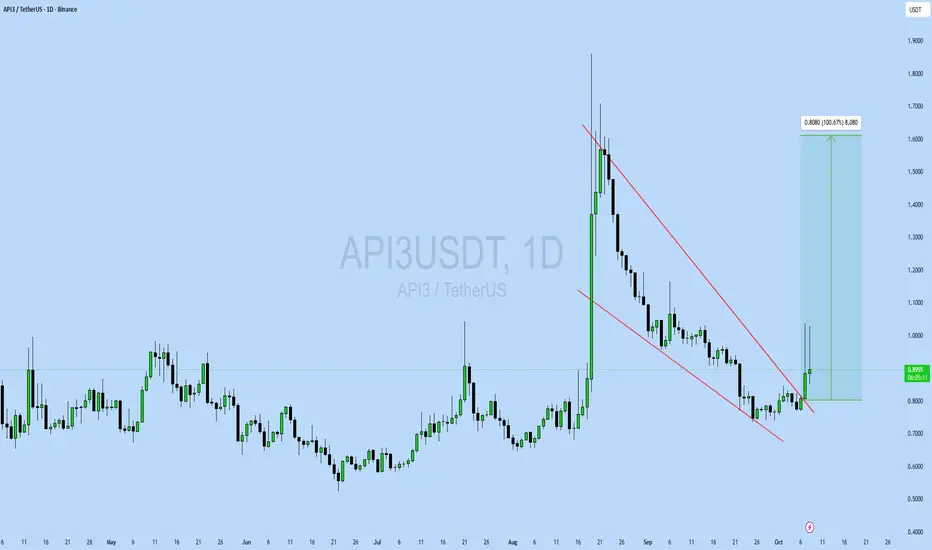
API3 Technical Setup
Pattern: Bullish falling wedge pattern
Current Price: $0.887
Target Price: $1.69
Target % Gain: 100.67%
$API3 is breaking out of a falling wedge pattern on the 1D timeframe. Current price is $0.887 with a target near $1.69, showing about 100% potential upside. The breakout indicates renewed bullish strength and suggests potential continuation if momentum sustains. Always use proper risk management.
Time Frame: 1D
Risk Management Tip: Always use proper risk management.
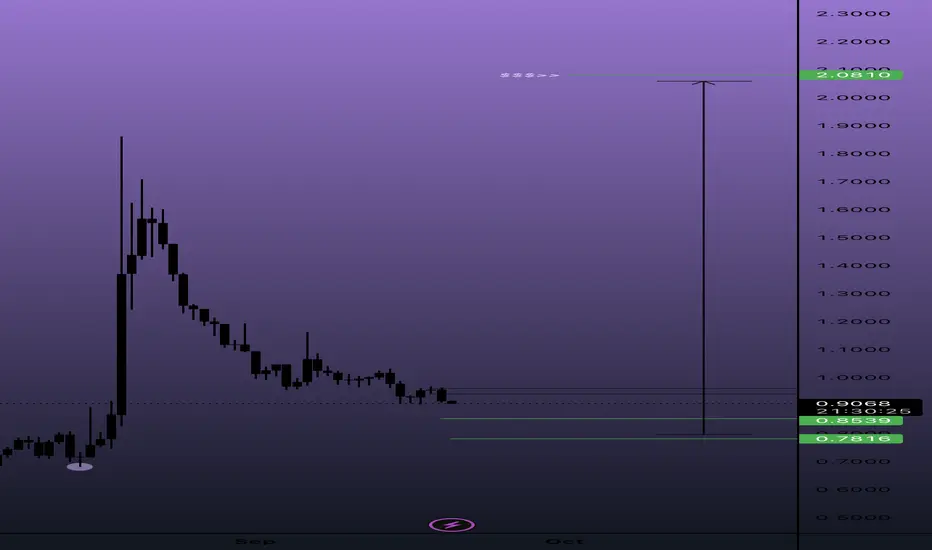
Api3 potential Api3 my current dark horse pick of the bunch!!!!
$0.94 demands a retest imo and if settled above we should see a take of the recent high putting this on a run into $2.08!
Crucial handles here lay at ($0.8539-$0.7816) and as q3 comes closer to an end we could potentially see some low end pricing around $0.65/$0.70 to start out q4.
This point will play @max and will need some higher timeframe closures to judge its run which I believe holds enough fire to kick this back up.
In short, we kick above $1.60 from these handles the run should be smooth into $2.08 which will become it’s biggest hurdle.
Overall targets from there is $3.30 and if supported with closures this should have no problem back into $5 placing this token as something to hold long term…
Happy Trading People!! 😉
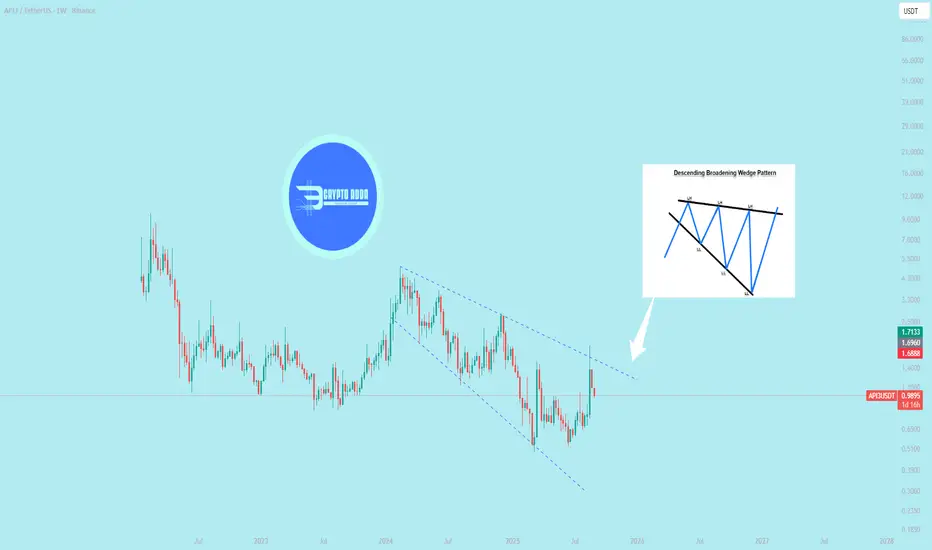
$API3 is encountering resistance **$API3 is encountering resistance at the upper trendline of its descending broadening wedge pattern.**
` Here's a quick refinement for clarity and precision, keeping the structure intact:`
1. **Confirm the Pattern**: Identify the descending broadening wedge on API3’s chart, characterized by lower highs and lower lows with diverging trendlines widening downward.
2. **Await Breakout Confirmation**: Wait for a decisive close above the upper trendline, supported by high trading volume, to validate a bullish breakout.
3. **Plan Entry and Stop-Loss**: Enter a long position post-breakout; set a stop-loss below the lower trendline or recent swing low to protect against reversals.
4. **Define Profit Targets**: Calculate the wedge’s height at its widest point or use nearby resistance levels to establish realistic profit targets.
5. **Control Risk**: Limit risk to 1-2% of your capital per trade, using indicators like RSI or MACD to confirm breakout strength and avoid false signals.
These points provide a clear, actionable framework for trading API3’s descending broadening wedge.
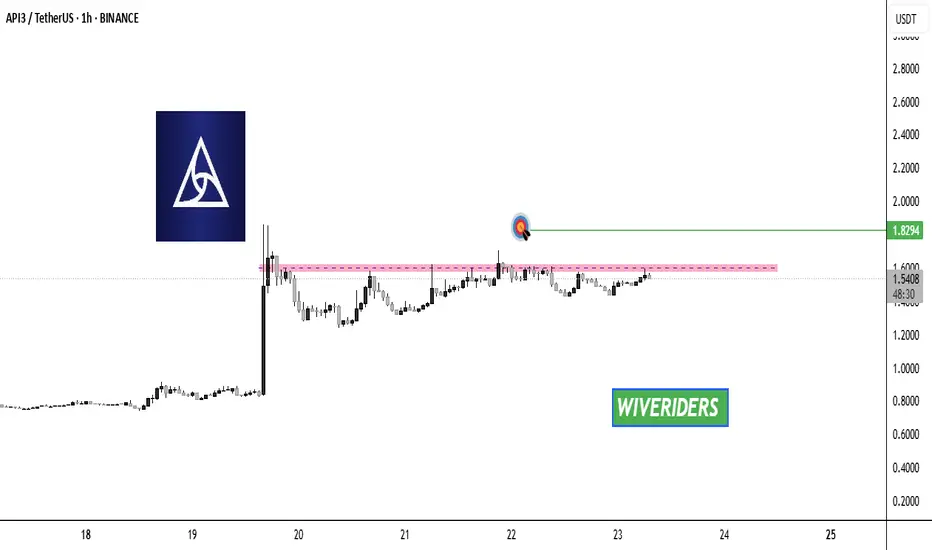
API3 Breakout Alert!🚨 $API3 Breakout Alert! 🚨
$API3 is currently testing the red resistance zone 🔴
If price breaks out, the first target will be the green line level 🎯
A confirmed breakout here would signal bullish continuation and could fuel further upside ✅
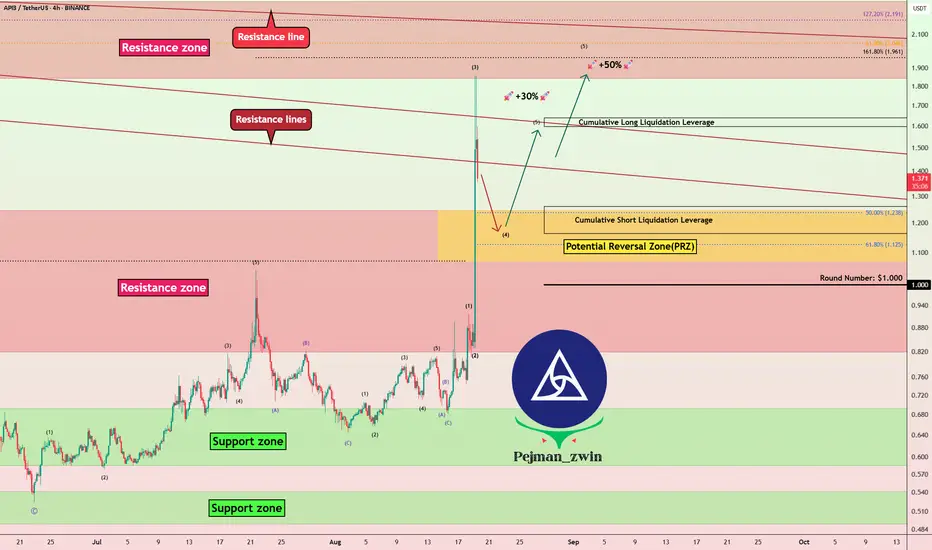
API3 Breaks Resistance – Is the Next Bullish Wave Coming?The listing news of API3 ( BINANCE:API3USDT ) on South Korea’s major exchange Upbit has boosted interest in the project. Starting from August 19, 2025, API3 will be available for trading on both KRW and USDT markets .
Reason for the surge : Being listed on one of the largest Korean exchanges not only brings more liquidity to API3 but also increases investor attention towards Web3-focused infrastructure and decentralized APIs.
API3 is a project designed to provide decentralized APIs for Web3 applications , aiming to give dApps secure and cost-effective access to real-world data without centralized intermediaries.
------------------------------------------
Now let's check whether we can still use the uptrend of the API3 token or not !? To answer this question, we need to refer to the API3 token chart on the 4-hour time frame .
The API3 token appears to have broken the Resistance zone($1.250-$0.820) with high momentum ( due to the above news ).
In terms of Elliott Wave theory , it seems that the API3 token has successfully completed wave 3 near the Resistance lines and is currently completing wave 4 . Wave 4 could be a pullback and complete at Potential Reversal Zone(PRZ) .
Note : Wave 5 could be a truncated wave due to the high momentum of wave 3.
I expect that the API3 token can start increasing again after the pullback(wave 4) is completed and at least +30% .
Cumulative Short Liquidation Leverage: $1.638-$1.597
Cumulative Long Liquidation Leverage: $1.260-$1.164
Note: Worst Stop Loss(SL): $0.923
Please respect each other's ideas and express them politely if you agree or disagree.
API3 Analyze (API3USDT), 4-hour time frame.
Be sure to follow the updated ideas.
Do not forget to put a Stop loss for your positions (For every position you want to open).
Please follow your strategy and updates; this is just my Idea, and I will gladly see your ideas in this post.
Please do not forget the ✅' like '✅ button 🙏😊 & Share it with your friends; thanks, and Trade safe.
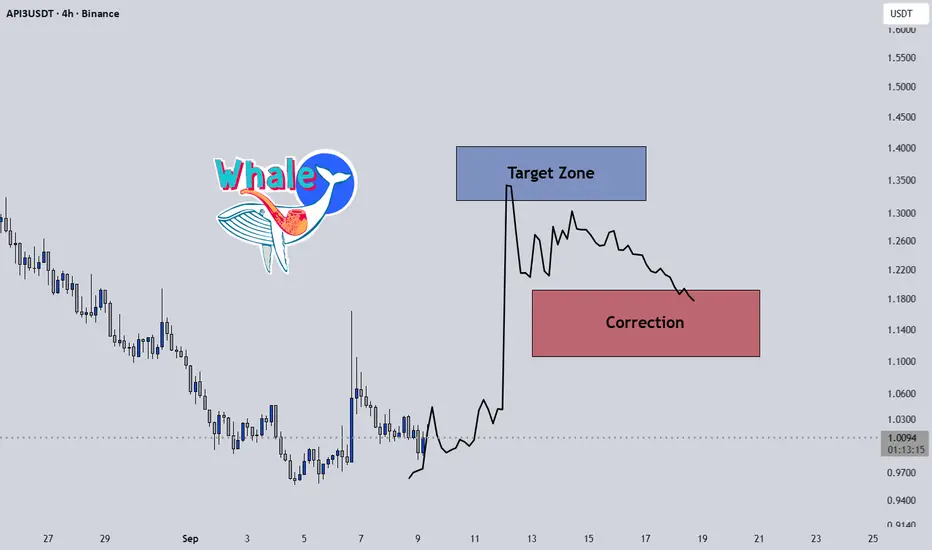
API3USDT Forming Bullish MomentumAPI3USDT has recently broken out of a long-term consolidation range, signaling a strong bullish shift in momentum. The chart clearly shows a breakout from a rounded bottom formation combined with a horizontal resistance level, which has now turned into a strong support zone. This technical structure often leads to sustained bullish rallies, and the volume spike during the breakout further confirms institutional and retail interest converging on this move.
The current market sentiment around API3 is also turning positive as decentralized oracle solutions like API3 are gaining attention in the DeFi space. With its unique fundamentals and a sharp technical setup, API3 is now in a position to potentially deliver a gain of 80% to 90% from the breakout zone. This projected target is based on historical price movement and the depth of the consolidation range that preceded the breakout.
As price action remains above key moving averages and continues to print higher highs and higher lows, traders should keep a close eye on potential retests of the breakout zone. A successful hold above the $1.20–$1.30 area would likely trigger another leg up, making API3USDT an attractive setup in the current market cycle.
✅ Show your support by hitting the like button and
✅ Leaving a comment below! (What is You opinion about this Coin)
Your feedback and engagement keep me inspired to share more insightful market analysis with you!
OGNUSDT UPDATE#OGN
UPDATE
OGN Technical Setup
Pattern: Bullish Wave Pattern
Current Price: $0.0649
Target Price: $0.10
Target % Gain: 51.61%
Technical Analysis: OGN is showing a bullish wave formation on the 1D chart, with higher lows and strong upward momentum. Price has reclaimed key support near \$0.06 and is gearing toward the $0.10 resistance zone, confirming bullish continuation.
Time Frame: 1D
Risk Management Tip: Always use proper risk management.
#API3 Rally Peak: 4H Trading Strategy with RSI WarningBINANCE:API3USDT
Trading Levels:
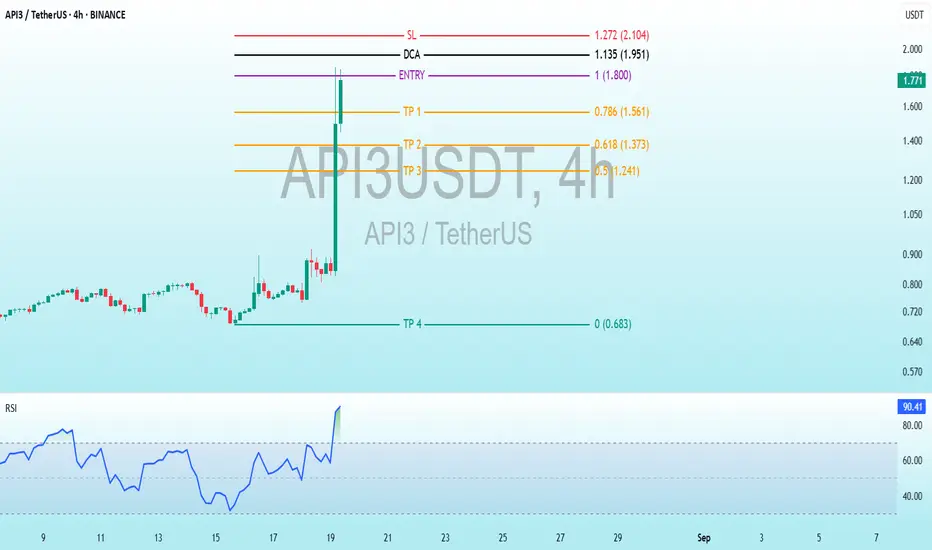
Entry: 1.00 (1.800 USDT) - The level where the initial purchase is planned.
DCA (Dollar-Cost Averaging): 1.135 (1.951 USDT) - An additional buying point if the price rises.
SL (Stop Loss): 1.272 (2.104 USDT) - The level where the loss would be limited.
TP (Take Profit):TP1: 0.786 (1.561 USDT)
TP2: 0.618 (1.373 USDT)
TP3: 0.5 (1.241 USDT)
TP4: 0 (0.683 USDT) - A lower target, possibly a long-term goal or error.
RSI (Relative Strength Index) Indicator:
The current RSI value is 90.30, which is deeply in the overbought territory (above 70 and nearing 90). This suggests the price may be overextended, indicating a potential reversal or correction soon.
Analysis and Interpretation:
Strategy: The chart uses Fibonacci levels to determine entry, exit, and loss points. The entry is set at 1.800 USDT, with a DCA at 1.951 USDT if the price continues to rise, and a stop loss at 2.104 USDT to protect capital.
Profit Targets: TP1 to TP3 are based on Fibonacci retracement levels (0.786, 0.618, 0.5), indicating a technical approach to taking profits incrementally. TP4 at 0.683 USDT seems significantly lower and might be a mistake or a long-term target.
RSI: The extremely high RSI value (90.30) signals a strong overbought condition. This could imply an imminent pullback or consolidation, especially if the price fails to sustain its recent upward momentum.
Recommendation:
Monitor the price closely around the entry level (1.800 USDT) and DCA (1.951 USDT). Given the overbought RSI, exercise caution with new entries or consider preparing for a potential sell-off.
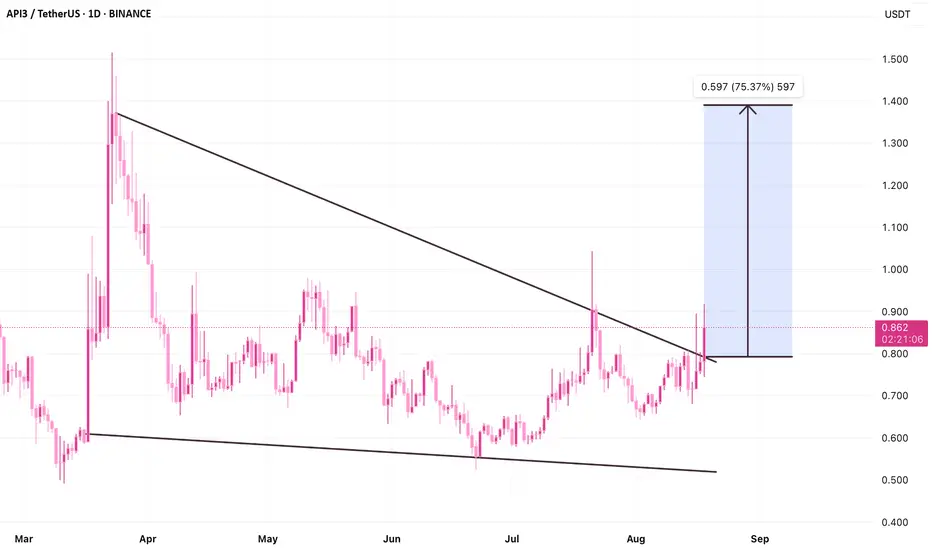
API3/USDT – Bullish Breakout: Falling Wedge Targets +73%API3 has broken out of a multi-month falling wedge pattern, confirmed by a strong daily candle closing above the upper trendline. Current price is 0.867 USDT, up +11.01% for the session.
The measured move from the wedge projects a potential target near 1.50 USDT (+73% from breakout). Price action shows rising momentum on the breakout, suggesting room for continuation to higher levels if buyers sustain control.
Key levels:
Breakout zone: ~0.86 USDT
Projected target: 1.50 USDT
Invalidation: close back inside wedge / below 0.50 USDT
Pattern breakout confirmed – monitoring for bullish follow-through toward upside targets.
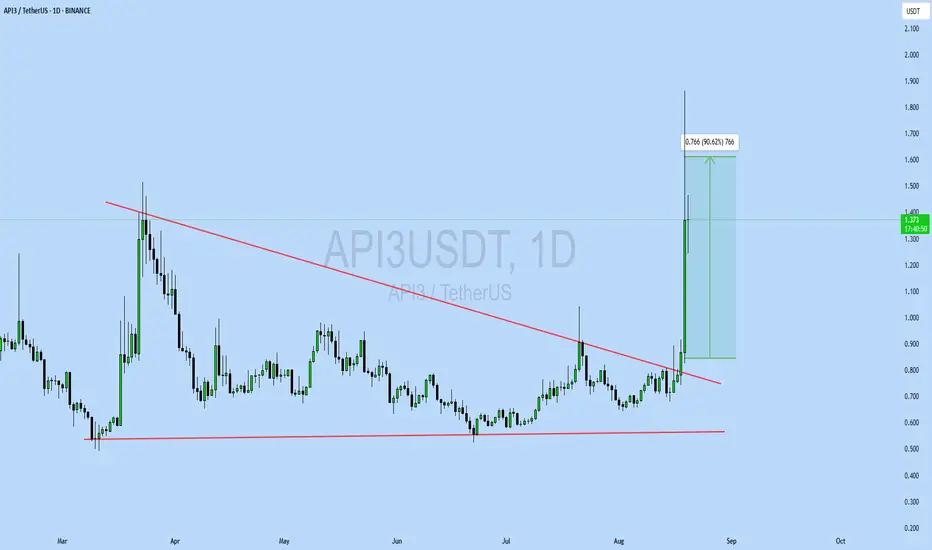
API3 666%API3 has been sideways for 196 days, 6.5 months, a very long time. It is interesting to notice the final portion of the bearish wave is part of the sideways phase. Between 3-February and 11-March.
API3USDT has been quiet for months. Only neutral action. Sideways.
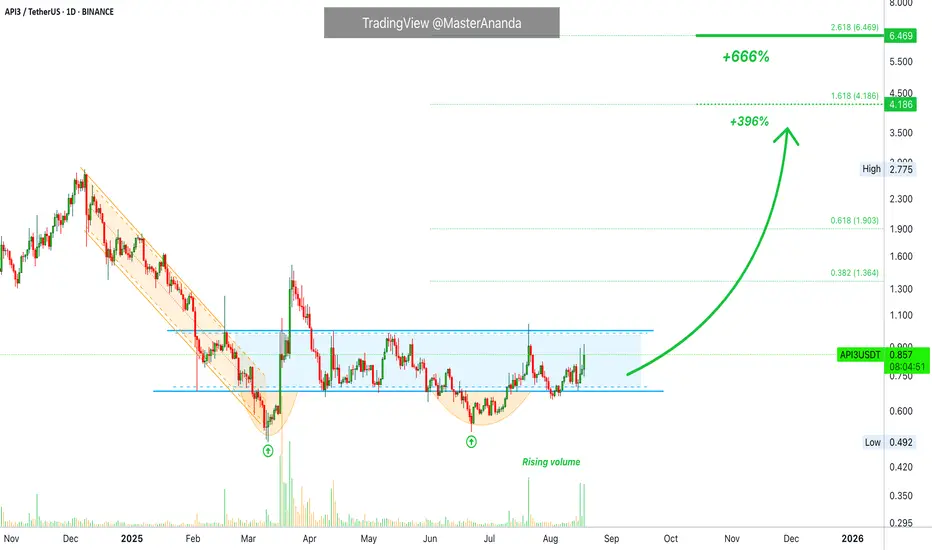
There is first a higher low. The first signal that shows up after the correction bottom. After the higher low we have rising volume. So the market is sideways but pointing higher. Buying is happening behind the scenes and sellers cannot reach support. When selling happens, buyers are present and all selling is consumed. This is all bullish and points toward higher prices.
MA200
API3 is moving above MA200 today and this is the most important signal of all.
The last time this event happened, coming from a low, was in October 2023. This was also the start of the last bullish wave. Right before a major bullish cycle, the action moves above MA200 daily.
This is a nice chart setup. The targets here are meant for the mid-term to long-term.
There can be more if we focus on the bigger picture. This should only be a portion of the 2025 bull market growth and profits potential.
Thank you for reading.
Namaste.
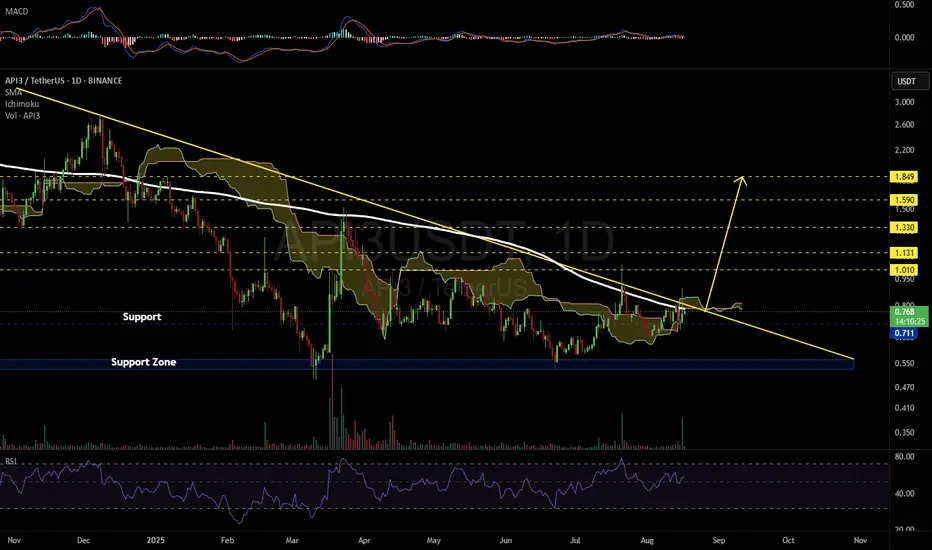
API3USDT 1D#API3 is moving inside a descending triangle on the daily chart. Consider buying some #API3 at the current price and near the support level of $0.711. In case of a breakout above the resistance cluster — which includes the triangle resistance, the daily SMA200, and the Ichimoku cloud — the potential targets are:
🎯 $1.010
🎯 $1.131
🎯 $1.330
🎯 $1.590
🎯 $1.849
⚠️ As always, use a tight stop-loss and apply proper risk management.
API3/USDT: The Ultimate Bounce Setup!📊 CURRENT SNAPSHOT 🔍 KEY TECHNICAL LEVELS
🟡 CRITICAL RESISTANCE ZONES
Major Resistance: $0.800 - Key breakout level
Secondary Resistance: $0.900 - Previous support turned resistance
Target Zone: $0.585-$0.536 - Golden pocket area
🔵 CURRENT BATTLE ZONE
Price: $0.664 - Testing key support
Descending Wedge: Bullish pattern forming
Volume: Declining - Typical before breakouts
🟢 SUPPORT FORTRESS
Immediate Support: $0.585 - Critical level
Ultimate Support: $0.536 - Major bounce zone
Trendline Support: Red descending line
🎯 THE SETUP: "Falling Knife Reversal Pattern"
📱 QUICK SUMMARY - Pattern: Falling Wedge (Bullish) ✅
Entry Zone: $0.52 - $0.55 🎯
Target: $0.80 - $0.90 🚀
Risk/Reward: 1:3.6 ⭐⭐⭐⭐⭐
Probability: 80% Bullish 📈

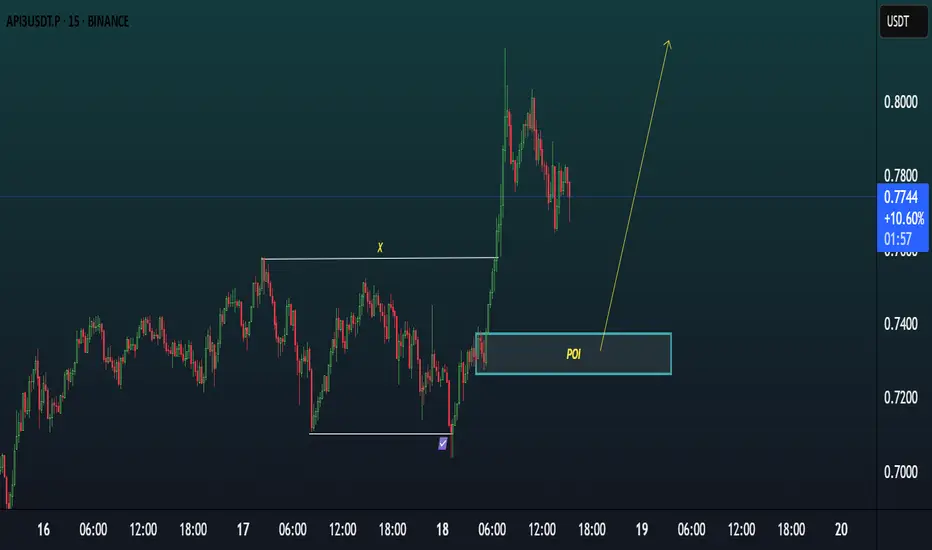
CHART OVERVIEW OF API3USDTChart Overview
Pair: API3/USDT.P
Timeframe: 15 Minutes
Current Price: 0.7728
Market Bias: Bullish (expecting a pullback into demand before continuation)
📌
Setup Summary
Strategy: Smart Money Concept (SMC) + POI (Point of Interest) + Break of Structure
POI Zone: 0.7350 – 0.7425 approx (marked with blue rectangle)
Anticipated Move: Price to retrace into the POI (Demand Zone), then bounce up towards previous highs around 0.8200+
🧠
Detailed Breakdown
1.
Break of Structure (BoS)
There’s a clear bullish Break of Structure, as price made a higher high after breaking the previous internal structure (“X”).
This confirms that buyers are in control.
2.
POI (Point of Interest)
The marked blue zone is a Bullish Order Block or Demand Zone, where institutions or smart money last pushed price upward.
This zone is expected to act as support if price revisits it.
3.
Price Action
After the impulsive move up, price is now retracing with corrective candles (seen as red bearish candles).
The expectation is that it will dip into the POI and then reverse upward.
4.
Entry Plan
Entry: Inside the POI zone (between 0.7350 and 0.7425)
Confirmation: Look for bullish engulfing candle or internal structure shift in lower timeframes (1m/5m) inside the POI.
Stop Loss: Below the POI (around 0.7300)
Take Profit: Previous high around 0.82 or higher (approx. 1:3 RR)
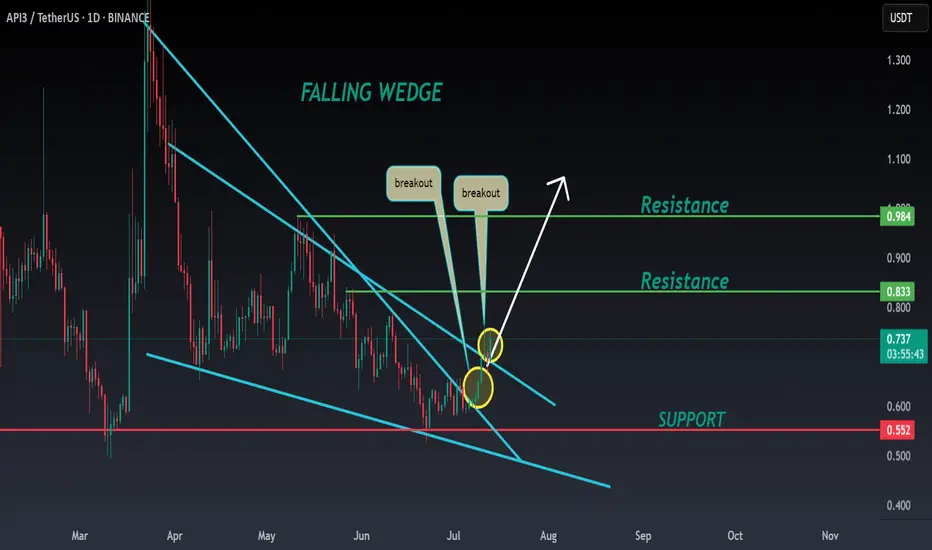
API3 ANALYSIS🚀#API3 Analysis :
🔮As we can see in the chart of #API3 that there is a formation of "Falling Wedge Pattern". In a daily timeframe #API3 broke out the pattern. Expecting a bullish move in few days if #API3 retest the levels
⚡️What to do ?
👀Keep an eye on #API3 price action. We can trade according to the chart and make some profits⚡️⚡️
#API3 #Cryptocurrency #TechnicalAnalysis #DYOR
API3USDT in Extended WXY Decline Key Breakout Levels in FocusAPI3USDT continues its corrective descent, unfolding into a potential WXY pattern, with price action currently extending toward the completion of leg Y. Attention is now on the Immediate Resistance Level (IRL) and the Main Support Zone highlighted on the chart.
Price is expected to remain range bound within these levels. A breakout will define the next major move, a break below support could complete the corrective structure into the Potential Reversal Zone (PRZ), while a break above the IRL may trigger a strong bullish leg toward the setup’s main upside target.
Share your thoughts on API3 in the comments!

API3 loves to scam pump when DeFi coins runBINANCE:API3USDT
Mini range and trend support holding so far.
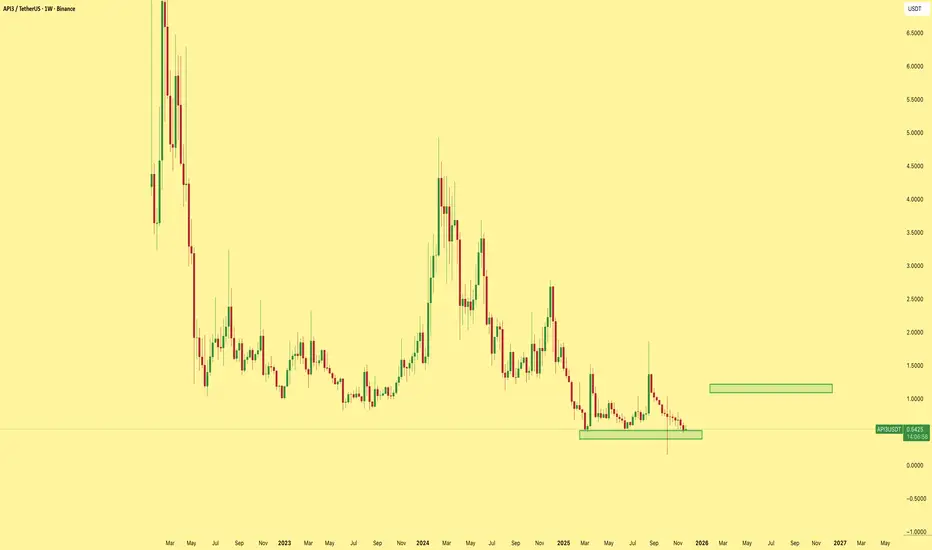
— Holding above $0.65–0.70 = base for a squeeze toward $1.40–2.00.
— Flip $1.10–1.20 = mid-term trend shift.
— Main resistance at $2.33, then macro targets $3.2–5.5.
— Lose trend support? Expect new lows inside the channel.
Key level: watch how it acts above $0.65.

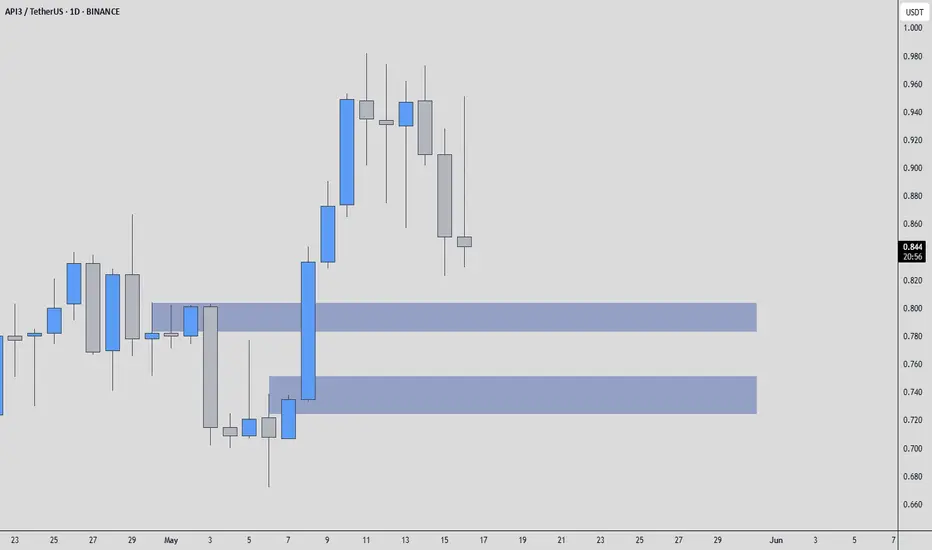
API3USDT - Looks Good!When most traders are looking at flashy pumps, I’m watching structure, confirmation, and where real buyers are hiding. In this case, the blue boxes are not just drawn for aesthetics, they represent potential accumulation zones, places where price might find its footing if approached with the right momentum and volume context.
We’ve seen this behavior before: strong drops into support, followed by subtle CDV divergence, an uptick in volume, and then a quick reclaim. That’s the kind of move that gives traders an edge, if they’re patient enough to wait for it.
But let’s be real, trading without confirmation is gambling. I say this every time: I will never insist on my long idea if the levels don’t react. If there’s no reclaim or strength in the low timeframe, I step back.
Volume, CDV, and reaction around these levels are everything. The market has been unforgiving lately, and API3 is no exception. However, these blue box zones still carry potential, if buyers show up.
📌 Stay sharp, stay flexible. This is how the highest win-rate traders operate, not by chasing, but by setting traps and waiting for price to walk in.
📌I keep my charts clean and simple because I believe clarity leads to better decisions.
📌My approach is built on years of experience and a solid track record. I don’t claim to know it all but I’m confident in my ability to spot high-probability setups.
📌If you would like to learn how to use the heatmap, cumulative volume delta and volume footprint techniques that I use below to determine very accurate demand regions, you can send me a private message. I help anyone who wants it completely free of charge.
🔑I have a long list of my proven technique below:
🎯 ZENUSDT.P: Patience & Profitability | %230 Reaction from the Sniper Entry
🐶 DOGEUSDT.P: Next Move
🎨 RENDERUSDT.P: Opportunity of the Month
💎 ETHUSDT.P: Where to Retrace
🟢 BNBUSDT.P: Potential Surge
📊 BTC Dominance: Reaction Zone
🌊 WAVESUSDT.P: Demand Zone Potential
🟣 UNIUSDT.P: Long-Term Trade
🔵 XRPUSDT.P: Entry Zones
🔗 LINKUSDT.P: Follow The River
📈 BTCUSDT.P: Two Key Demand Zones
🟩 POLUSDT: Bullish Momentum
🌟 PENDLEUSDT.P: Where Opportunity Meets Precision
🔥 BTCUSDT.P: Liquidation of Highly Leveraged Longs
🌊 SOLUSDT.P: SOL's Dip - Your Opportunity
🐸 1000PEPEUSDT.P: Prime Bounce Zone Unlocked
🚀 ETHUSDT.P: Set to Explode - Don't Miss This Game Changer
🤖 IQUSDT: Smart Plan
⚡️ PONDUSDT: A Trade Not Taken Is Better Than a Losing One
💼 STMXUSDT: 2 Buying Areas
🐢 TURBOUSDT: Buy Zones and Buyer Presence
🌍 ICPUSDT.P: Massive Upside Potential | Check the Trade Update For Seeing Results
🟠 IDEXUSDT: Spot Buy Area | %26 Profit if You Trade with MSB
📌 USUALUSDT: Buyers Are Active + %70 Profit in Total
🌟 FORTHUSDT: Sniper Entry +%26 Reaction
🐳 QKCUSDT: Sniper Entry +%57 Reaction
📊 BTC.D: Retest of Key Area Highly Likely
📊 XNOUSDT %80 Reaction with a Simple Blue Box!
📊 BELUSDT Amazing %120 Reaction!
📊 Simple Red Box, Extraordinary Results
I stopped adding to the list because it's kinda tiring to add 5-10 charts in every move but you can check my profile and see that it goes on..