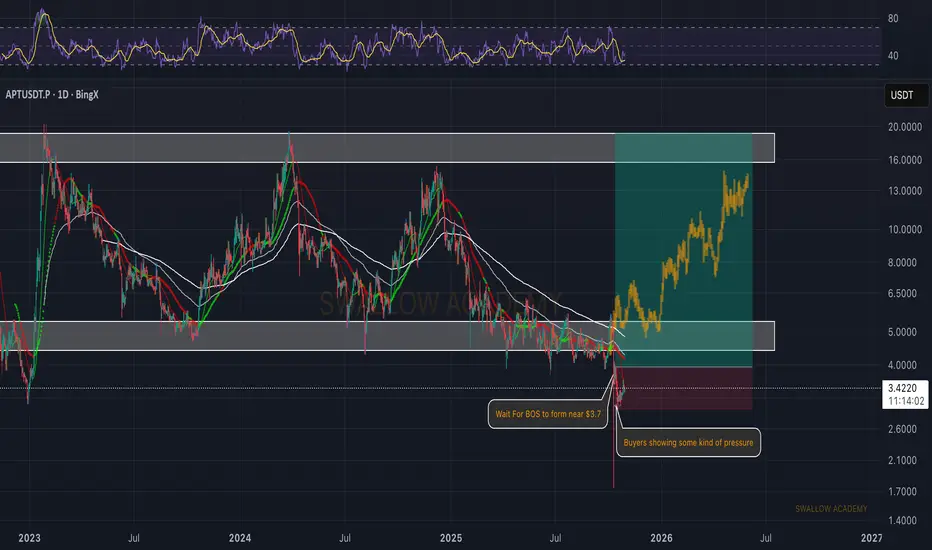
Aptos (APT): Looking For Break of Structure Near $3.7APT buyers are starting to show some pressure again, but we’re still waiting for a proper BOS to form around the $3.7 area. That would be the first real sign that buyers are taking back control.
Once that happens, we could easily see a strong push toward the mid-range zone, and from there, continuation toward the upper resistance. Overall setup is solid — just need that confirmation before getting involved.
Swallow Academy
Market insights
APTUSDT 1D#APT is currently trading within a descending channel on the daily timeframe. Consider accumulating a small position near the support zone. In case of a successful bounce, the initial upside targets are:
🎯 $4.315
🎯 $4.875
If a breakout occurs above the channel resistance, the extended targets are:
🎯 $5.817
🎯 $6.650
🎯 $7.483
🎯 $8.669
🎯 $10.180
⚠️ Always use a tight stop-loss and maintain proper risk management.

#APT/USDT bearish structural bias#APT
The price is moving in an ascending channel on the 1-hour frame, adhering well to it, and heading for a strong breakout and retest.
We have a bearish trend on the RSI indicator that is about to be broken and retested, which supports the upward breakout.
There is a major support area in green at 3.36, representing a strong support point.
We are heading for consolidation above the 100 moving average.
Entry price: 3.48
First target: 3.53
Second target: 3.63
Third target: 3.77
Don't forget a simple matter: capital management.
When you reach the first target, save some money and then change your stop-loss order to an entry order.
For inquiries, please leave a comment.
Thank you.

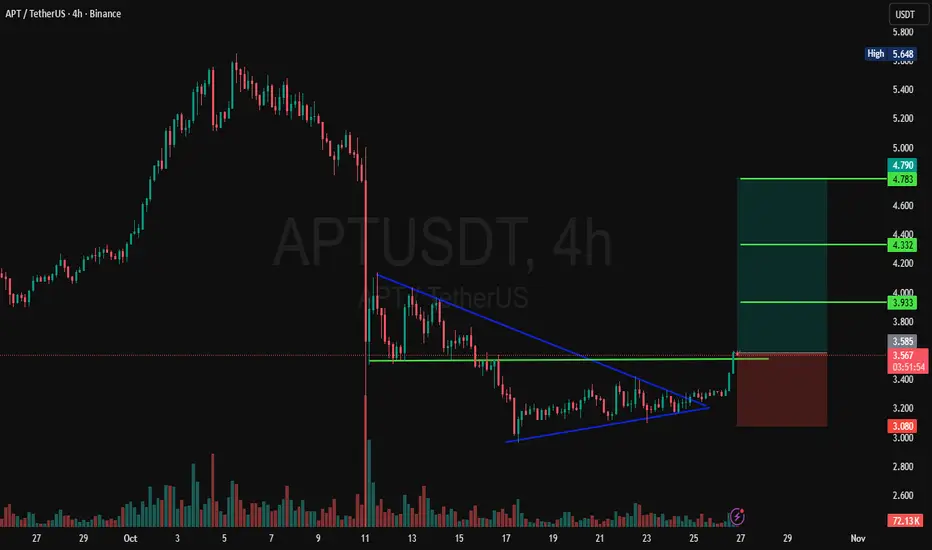
APT 4H Trade IdeaAptos looks bullish here on 4H time frame.
It has broke sideways & important level. Looks like a good accumulation done.
Entry & Exit points are on the chart.
NFA DYOR
#APT/USDT bearish structural bias#APT
The price is moving in a descending channel on the 1-hour frame and is expected to break and continue upward.
We have a trend to stabilize above the 100 moving average once again.
We have a downtrend on the RSI indicator that supports the upward move with a breakout.
We have a major support area in green that pushed the price higher at 3.10.
Entry price: 3.12.
First target: 3.21.
Second target: 3.30.
Third target: 3.36.
To manage risk, don't forget stop loss and capital management.
When you reach the first target, save some profits and then change the stop order to an entry order.
For inquiries, please comment.
Thank you.

Aptos at critical levels. APT needs to hold this level. Below this horizontal support, the price gets into dip discovery. This is the last line in the sand. Retail is not buzzing about it, and its institutional vibes are not attracting mindshare. Momentum is not in favor of the bulls, but RR is at its best.

Aptos Short (liquidity grab fade) This 4‑hour short fades a stop‑run into the former support that flipped to resistance. The plan is to sell a liquidity sweep into 3.22–3.65, where resting offers and recent breakdown supply cluster, then ride the move back into the local demand pocket.
Invalidity is a clean hold above the swept highs, which would signal acceptance back inside the prior range and risk a squeeze toward the next MA cluster, so the stop should live just above the top of that 3.22–3.65 box.
Take profits scale out into 3.06 first and then 2.78, aligning with the retrace to the breakdown shelf and the 1.618 extension area, where bounces are common on first touch.
The idea is momentum‑conservative: only execute on a rejection wick and close back below the zone, not on a blind limit fill, so the trade starts with confirmation rather than hope.

APTOS short
Aptos is an inflationnary token (7% new supply a year) with declining TVL.
I shorted APT on the 1‑hour around 3.15–3.17 because price is still under my 3.26 resistance shelf on the chart. I My first take‑profit is 3.04 to pay myself and then I move the stop to breakeven to protect the trade. If momentum continues, I aim for the 1.618 extension near 2.79 as TP2 and the 2.618 extension near 2.52 as TP3, with my overall target zone marked from 3.04 down to 2.45.
The setup is invalidated if a 1‑hour candle closes back above 3.258.

APT/USDTLast week’s Bitwise BINANCE:APTUSDT ETF news was overshadowed by the recent price action.
I’d turn bullish on this chart once it reclaims the range above $3.893.
If the December 2022 low around $3.066 comes into play, it could offer a good spot entry for medium-term accumulation at a discount.
The first plan for APT still looks much safer for now.

#APT/USDT bearish structural bias#APT
The price is moving within a descending channel on the 1-hour frame, adhering well to it, and is heading for a strong breakout and retest.
We have a bearish trend on the RSI indicator that is about to be broken and retested, which supports the upward move.
There is a major support area in green at 3.75, representing a strong support point.
We are heading for consolidation above the 100 moving average.
Entry price: 3.83
First target: 4.00
Second target: 4.22
Third target: 4.546
Don't forget a simple matter: capital management.
When you reach the first target, save some money and then change your stop-loss order to an entry order.
For inquiries, please leave a comment.
Thank you.

Potential Bullish Resumption on APTUSDAfter the pair tapped into a long time area of interest, it is showing bullish trend. Break of recent mini structure and retest and a draw on a 15 min liquidity can potential fuel the upside.
APTUSDT bearish structural bias* Structural Break (MSS 4H at 5.107): The most significant piece of evidence is the Market Structure Shift (MSS) on the 4-Hour chart. This break confirms that the long-term trend has officially reversed to bearish.
* Path Cleared (Liquidity Voids Filled): The Liquidity Voids (price gaps/inefficiencies) across the 4H, 2H, and lower timeframes (down to 15m) have all been filled by the price action. This removal of major imbalances means there are no structural obstacles left to impede the current move to the downside.
* The Next Target (Price Magnet): The market's structural goal is the Bullish Unicorn Model zone (the Order Block/FVG between 4.780 and 4.646). This un-mitigated zone acts as a powerful Price Magnet, drawing the price lower to eventually execute buy orders there.

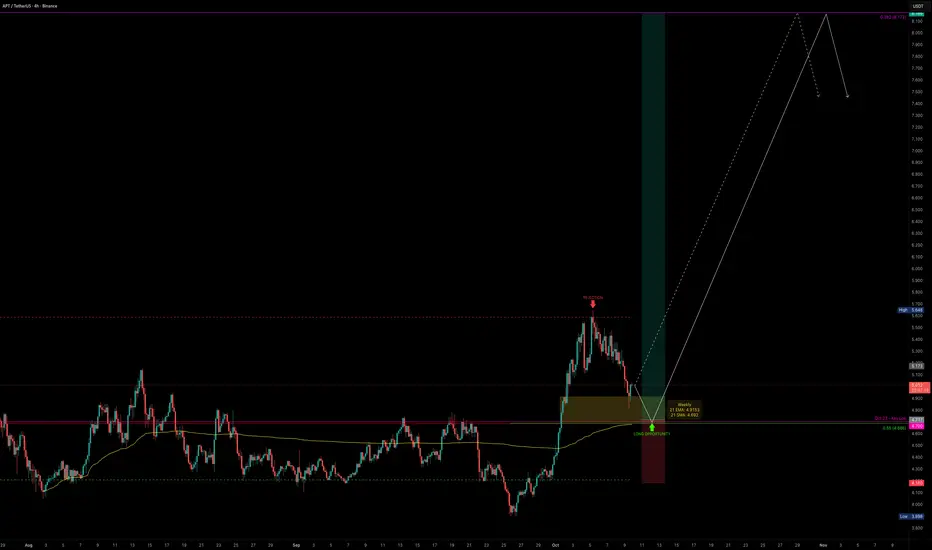
APT — 248 Days of Consolidation, Breakout PotentialAPT has been trading sideways for the past 248 days, building a massive base of consolidation. Things are starting to get interesting.
Recently, APT made its first real attempt to break above the yearly VWAP core (~$5.6) but got rejected, completing a 5-wave impulse right at this resistance zone. The rejection was no surprise: it lined up perfectly with the VAH of the 248-day trading range and the 4B market cap resistance at $5.69.
Now, after a strong impulse, we are in correction mode and this could set up the next major swing long opportunity.
🟢 Support Confluence Zone ($5.0–$4.5)
POC of 248-day range: $4.685
Anchored VWAP (from Aug low): sits right at the POC
Key Low (Oct 2023): $4.70
0.55 Fib retracement (of 5-wave impulse): $4.686
21 Daily EMA/SMA: $4.847 / $4.7
21 Weekly EMA/SMA: $4.915 / $4.69
200 4H EMA/SMA: $4.7 / $4.582
All confluences point to this being a critical support zone that bulls must defend.
🔴 Resistance Zone ($5.6–$5.7)
Yearly VWAP core (~$5.6)
VAH of 248-day range (~$5.6)
4B Market Cap resistance (~$5.69)
This zone remains the big wall to break. Once cleared with strong volume, upside potential opens significantly.
Freshly built (unpublished) Anchored VWAP Suite , which provides VWAP tracking:
Fair Value Trend Model :
Trade Setup
Long Entry: Ladder between $5.0–$4.5
Invalidation: Below VAL of range
Targets: $5.7 (major resistance), $7 (Fair Value), $8.172 (0.382 Fib)
Potential swing setup with R:R of 1:6+
Possible gain of +70% if structure holds and volume confirms breakout
Quick Take
APT is sitting at one of the most important support zones of the year. If this base holds, it sets up a high-probability swing long with great upside potential. All eyes are on whether bulls can reclaim momentum and finally break through the $5.7 wall.
🔍 Indicators used
Multi Timeframe 8x MA Support Resistance Zones → to identify support and resistance zones such as the weekly 21 EMA/SMA.
Fair Value Trend Model → Calculates a regression-based fair value curve
➡️ Available for free. You can find it on my profile under “Scripts” and apply it directly to your charts for extra confluence when planning your trades.
_________________________________
💬 If you found this helpful, drop a like and comment!
APTUSDT 1D#APT has broken above the descending triangle resistance on the daily chart and is currently retesting both the triangle and the daily SMA200, which are acting as strong support levels. In case of a successful bounce, the potential targets are:
🎯 $5.424
🎯 $5.885
🎯 $6.346
🎯 $7.003
🎯 $7.840
⚠️ Always remember to use a tight stop-loss and maintain proper risk management.

#APTUSDT 40% Movement Plan#APTUSDT 40% Movement Plan.
Like Somi and Mito, Aptos may also join the pump race. The same condition applies — it must hold the green box well. All other coins will also depend on BTCD. For the long term, we are not holding any coins right now. According to our analysis, Solana could fall to around \$70–80 and Ethereum to around \$2500 in the coming time.
$$ Ram Ram $$

APT USDTAPT currency is one of the high-potential currencies that will give extraordinary profits at the end of this upward cycle.
But in the medium term, this trend, in my opinion, can have a positive impact. With the breakdown of the downtrend line, it is easy to go to the price (6.795). We need to see how the price reacts at that price.
No analysis is 100%

Aptos (APT) Forms Strong Technical Base, Targets $6.13Aptos continues to show exceptional technical clarity, holding above $3.90 support while maintaining bullish momentum. A corrective retest toward $4.70 could serve as a prime entry for continuation toward $6.13.
Aptos has been one of the more structurally disciplined assets recently, reacting precisely to key support and resistance levels. The $3.90 region has acted as a reliable demand base multiple times, while the $5.43 area — previously a strong rejection zone — has flipped into resistance. This alignment provides traders with clear invalidation and continuation zones to guide their strategy.
A corrective pullback toward $4.70 would represent a classic bullish retest of the prior breakout zone. This level coincides with the 0.382 Fibonacci retracement and midrange equilibrium, giving additional technical confluence. As long as price holds above $4.50, the bullish thesis remains valid. APT’s daily chart also shows a series of higher lows accompanied by rising volume on upswings — a strong indicator of healthy accumulation.
Once the correction concludes, continuation toward $6.13 becomes the most probable scenario. This level represents both the prior weekly swing high and a key liquidity pool where short liquidations may trigger further upside extension.
What to Expect:
APT remains in a bullish structure. Any dip into $4.70 should be monitored for bullish confirmation candles, potentially setting the stage for a rally toward $6.13 in the coming sessions.

APT USDT LOOKS VERY BULLISH APT/USDT Technical Analysis (October 7, 2025 – 16:41 UTC+3)
APT has broken above a long-term descending trendline on the daily chart, forming a solid support reversal zone around the $5.15–$5.35 range. The price currently trades at $5.36, showing early signs of a bullish continuation toward the $6.73 resistance area.
Short-term (Scalp / Day Trade):
If the price retests the $5.25–$5.35 zone, it could present a buy opportunity for short-term traders. A daily close below $5.15, however, would invalidate this setup.
Immediate resistance lies at $5.63–$5.75. A breakout above this level could open the way to $6.73 and later $8.45.
Mid-term (Swing Trade):
A daily close above $6.73 may confirm a bullish breakout pattern targeting $8.45.
If momentum continues beyond $8.45, the historical resistance zone at $14.8–$15.0 could come into play again.
Indicators:
The RSI crossing above 50 indicates strengthening momentum. The breakout accompanied by increasing volume suggests that the upward move could be sustainable.
Overall Outlook:
With the descending trendline now broken and volume rising, APT appears to be entering a bullish phase. As long as the price holds above $5.15, the bias remains upward.


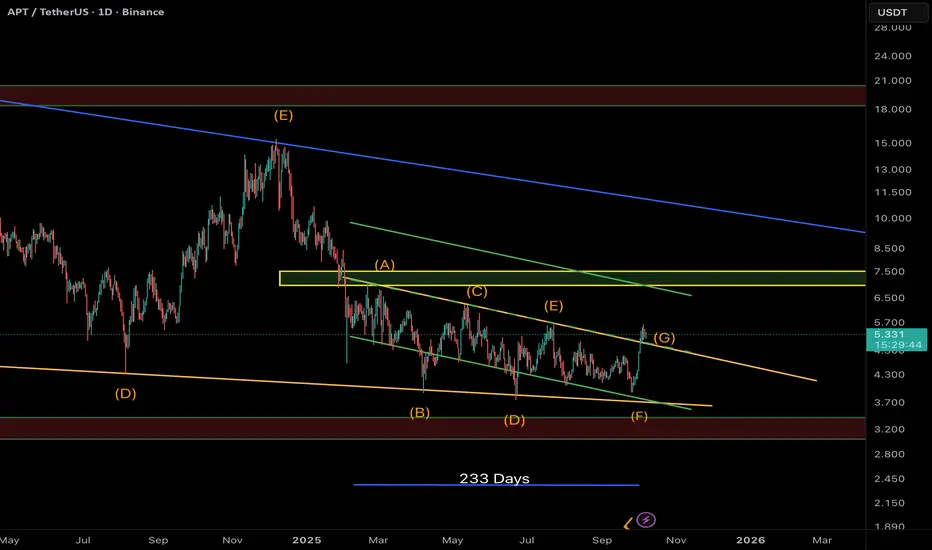
APT — Diametric Pattern Completed? Wave G in Play!APT appears to have completed a 7-leg Diametric correction (A–G) — a rare and complex Elliott structure often seen before major trend reversals.
Currently, price has broken out of the descending channel, confirming the start of Wave G, which could extend toward the $7.0 zone — aligning with the previous Wave A resistance.
Key Points:
• 🌀 Completed Diametric structure (A–G) over ~233 days
• 🟢 Breakout from the descending wedge
• 🎯 Potential target: $6.8 – $7.2
• ⚠️ Support to watch: $4.8 – $5.0 (retest area)
If momentum holds, this move could mark the first bullish leg of a larger reversal phase.
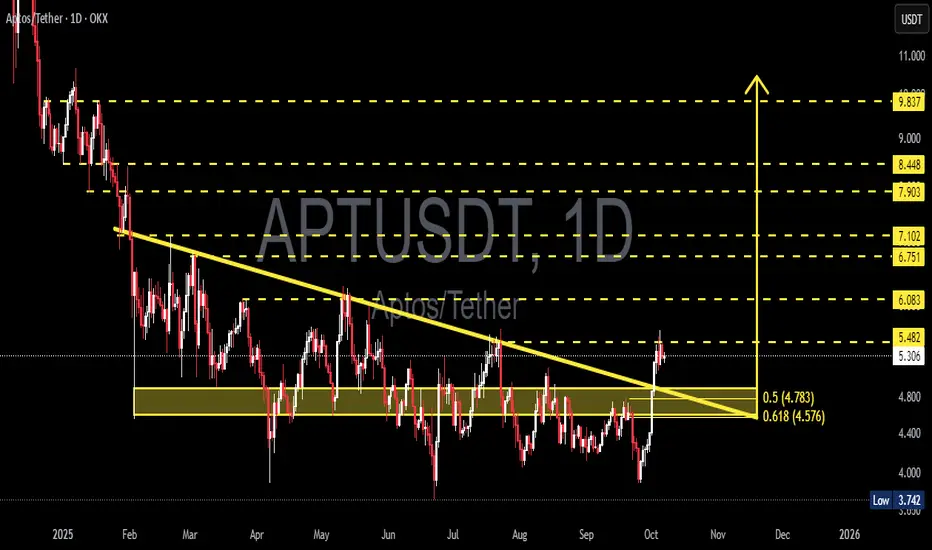
APTUSDT — Retesting the Demand Zone Before Potential Rally back?1. Overview
APT/USDT has been in a medium-term downtrend since early 2025, consistently forming lower highs and lower lows along the primary descending trendline (yellow).
Recently, however, the market has shown a clear shift in momentum: price successfully broke above the descending trendline and is now trading above a major confluence area between Fibonacci 0.5 and 0.618 (4.78–4.57).
This zone serves as the primary demand base, where historical accumulation by buyers has previously occurred. The breakout indicates a possible early stage of structural reversal, transitioning from a bearish environment toward a medium-term bullish phase.
---
2. Structure and Pattern
Over the past nine months, APT has formed a Descending Channel / Triangle pattern, where selling pressure gradually weakened as buyers began absorbing liquidity at lower levels.
The breakout above the trendline suggests a trendline breakout followed by a demand retest, a classic setup often signaling the start of a trend reversal.
If the 4.57–4.78 zone holds during the retest, the price structure could evolve into a compressed Inverse Head & Shoulders, further strengthening the bullish reversal narrative.
---
3. Key Technical Levels
The technical structure of APT can be summarized through several critical zones:
Main Demand Zone (4.783 – 4.576)
This is the key confluence area between the 0.5 and 0.618 Fibonacci retracements. Buyers have previously shown strong reactions here. Holding this level is crucial to validate the current breakout.
Immediate Resistance (5.482)
This marks the breakout line of the long-term descending trendline and the first significant psychological resistance. A daily close above this zone would confirm bullish continuation.
Major Support (3.742)
This is the main structural low formed during the previous capitulation phase. A breakdown below this level would invalidate the bullish structure and signal a potential continuation of the downtrend.
Upside Targets (Fibonacci Extensions)
Upon successful confirmation, price targets are projected at 6.083, 6.751, and 7.102, with extended targets at 7.903, 8.448, and 9.837.
The 4.57–4.78 region now acts as the core battlefield between buyers and sellers — defending this zone keeps the bullish structure intact.
---
4. Bullish Scenario
Confirmation Conditions:
Daily close above 5.48 with strong volume, or
Successful retest and bounce from 4.58–4.78.
If these conditions are met, the likelihood of sustained bullish continuation increases significantly.
Projected upside targets:
Target 1: 6.083
Target 2: 6.751
Target 3: 7.102
Momentum extension could push toward 7.90–9.84 if volume and sentiment align.
Additional confirmations:
RSI rising above 50 → showing positive momentum.
MACD golden cross in the positive zone → trend strength confirmation.
Increasing breakout volume → evidence of institutional accumulation.
Bullish invalidation: daily close below 4.576.
---
5. Bearish Scenario
If price fails to sustain above 5.48 and instead breaks down through the 4.58–4.78 zone, the breakout will be classified as a false breakout.
In this case, potential downside includes:
Short-term pullback toward 4.00,
And a deeper retest near 3.742, the major structural support.
A daily close below 3.742 would confirm trend continuation to the downside and nullify the reversal structure.
---
6. Market Sentiment and Dynamics
APT is currently in a transition phase between capitulation and re-accumulation.
The breakout above the trendline, combined with increasing buying volume, suggests a change in market character — shifting from selling pressure to growing demand.
If the broader crypto environment remains stable and risk appetite returns to altcoins, APT could become one of the stronger Layer-1 recovery candidates in the coming cycle.
However, two main risks remain:
1. False breakout caused by weak volume.
2. Low liquidity at higher levels that may lead to sharp retracements before continuation.
---
7. Trading Approach (Not Financial Advice)
A. Conservative Swing Approach
Entry: confirmed bounce at 4.78–4.60
Stop Loss: below 4.40
Take Profit: 6.08 / 6.75 / 7.10
Risk:Reward: approximately 1:3
B. Momentum Approach
Entry: breakout confirmation above 5.48 with strong volume
Stop Loss: below 4.78
Target: 6.75–7.10
---
8. Conclusion
APT/USDT stands at a technically decisive point.
The breakout above the long-term descending trendline signals a potential major shift in market direction.
However, full confirmation depends on the ability of the 4.58–4.78 zone to hold during the retest.
If the zone holds, the next move toward 6.75–7.10 could unfold over the coming weeks.
If it fails, sellers may regain control, pulling the price back to 3.74 and continuing the broader downtrend.
The coming sessions will determine whether this marks the beginning of a true bullish reversal or merely a temporary false breakout.
---
9. Relevant Hashtags
#APT #APTUSDT #Aptos #CryptoAnalysis #TechnicalAnalysis #Breakout #SupplyDemand #Fibonacci #SupportResistance #SwingTrading #PriceAction #TrendReversal #Altcoins #CryptoMarket
Buy APT
Bullish structure emerging with two main factors:
A key local trendline was broken, signaling strength.
CMF trendline breakout adds confirmation of inflows.
This pattern is similar to the October 2023 setup, which led to a strong upside move.
Catalysts to Watch for APT
Token Unlocks: ~11.3M APT (~2.2% supply) scheduled soon. Historically, unlocks create volatility but can also clear uncertainty once absorbed.
Ecosystem Growth: Ongoing developer activity and new dApps launching on Aptos (DeFi, gaming, socialFi) could drive demand.
Partnership Momentum: Aptos has been striking deals in Asia (especially gaming and Web3 social) that may fuel adoption.
Network Upgrades: Continued improvements to Move language, node performance, and Aptos SDK strengthen fundamentals.
L1 Rotation: Broader alt market rotations often send capital into high-beta L1s like APT after majors consolidate.
Disclaimer:
This analysis is based on my personnal views and is not a financial advice. Risk is under your control.

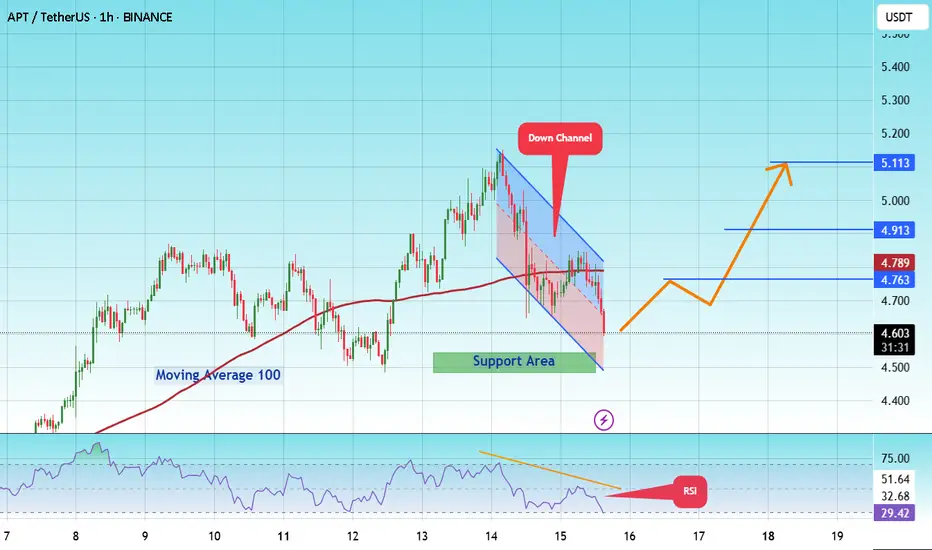
#APT/USDT Establish Support Zone !#APT
The price is moving within a descending channel on the 1-hour frame and is expected to break and continue upward.
We have a trend to stabilize above the 100 moving average once again.
We have a downtrend on the RSI indicator that supports the upward break.
We have a support area at the lower boundary of the channel at 4.54, acting as strong support from which the price can rebound.
We have a major support area in green that pushed the price higher at 4.49.
Entry price: 4.62.
First target: 4.76.
Second target: 4.91.
Third target: 5.11.
To manage risk, don't forget stop loss and capital management.
When you reach the first target, save some profits and then change your stop order to an entry order.
For inquiries, please comment.
Thank you.