[APTUSDT] - Massive round bottom pattern3D chart showing a massive round bottom pattern and not get out yet
price need to breakout the 0.5 fib resistance for bullish rally
our main target is 100$
Thank you, and for more ideas, hit "Like" and "Follow"!🎯
Market insights

APTUSDT LONG OUTLOOKHello Traders, this is outlook that i think might be work. All Entry, Stop Loss, and Take Profit its already showed up. All trade it is on yourself. DYOR.

APT might hold here and Continue A good area to hold here and if holds easy 20 target about 50% move.
Also it is showing some support here.
LL Longed 13.050. will add more slightly lower.
Stopping if doesn't hold 12.700.
A decent looking setup with good RR.
Note: Not a Financial Advice.

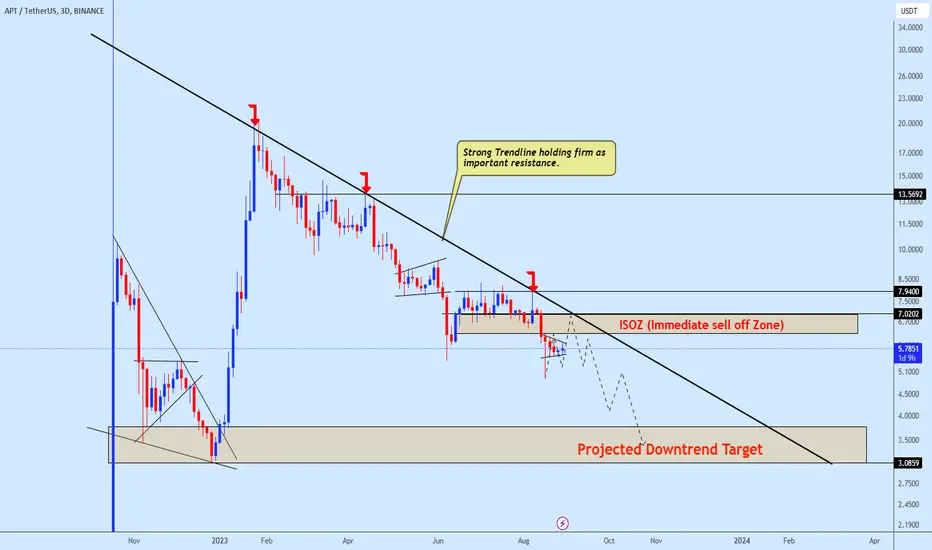
APTUSDT Analysis Downtrend Persists with Key Areas to Watch APTUSDT has been following a distinct downtrend recently, The price action, along with various technical indicators, confirms the bearish momentum. We should remain cautious, anticipating potential pullbacks or trend continuations.
The chart highlights the 'ISOZ' zone, a crucial area of interest. Price seems to be gravitating towards this zone for a potential re-test. A re-test here can provide insights into APTUSDT's next major move.
Looking forward, have pinpointed the 'Final Projected Target' on the chart. This target isn't just an area of potential price movement but also presents itself as a lucrative zone for long-term accumulation.
Do ensure to match this analysis with your personal findings, use appropriate risk management, and stay updated with any potential news events that might influence the market. If you found this analysis valuable, consider hitting the 'like' button.
Thank you.
APT: Channel UpTrade setup : Price is in an Uptrend, showing relative strength as it continues to advance even during an overall market correction. We would be buyers on pullbacks to Channel support trendline (~$16.00). Stop Loss (SL) at $14.50.
Pattern : Price is trading in a Channel Up pattern. With emerging patterns, traders who believe the price is likely to remain within its channel can initiate trades when the price fluctuates within its channel trendlines. With complete patterns (i.e. a breakout) – initiate a trade when the price breaks through the channel’s trendlines, either on the upper or lower side. When this happens, the price can move rapidly in the direction of that breakout.
Trend : Uptrend across all time horizons (Short- Medium- and Long-Term).
Momentum is Bullish (MACD Line is above MACD Signal Line and RSI is above 55).
Support and Resistance : Nearest Support Zone is $15.00 (previous resistance), then $13.00. The nearest Resistance Zone is $16.75, which it broke, then $20.00.

$APT Spot IdeaIt has lot of hype on it.
If any bull comes up, it will be seeking like this.
I'm long term hodler.
DYOR

APT Roadmap For Bullish RunAPT is another coin which getting ready to explode.
Seems like APT can easily claim 20.3 right not in short term.
But let's focus on the bigger picture.
If APT can close above 20 in a weekly time frame, Wave 3 can go up to 24.2, then all the set up might change. If it can't, it will act like the way you see on the chart.
Short Term Target:
20.3
Long Term Target for Inverstors:
33-37.8-45


APT - 15% rise of Open interest - big move is comingAPT - 15% rise of Open interest - big move is coming
In a video i compared it with LINK example
watch full update


APT USDT 4H A good area to hold here and if holds easy 20–23 target
Also, Triangle breaks out it a pump
LL Longed 13.050. Will add more, slightly lower.
Stopping if doesn't hold 12,700.
A decent looking setup with good RR.

Triangle BreakoutIf Aptos breaks the triangle upwards, a long position can be taken.
Entry level: 17
TP1: 19.6285
TP2: 21.5549
TP3: 21.3189
SL: 15.66
NOT FINANCIAL ADVICES

APTOS will hits 26$ soonHello
As the chart shows us we have a flag pattern and according to TP it gives us about 200% for long position.

Long APTAPT is in an uptrend with a strong bullish continuation. I’m expecting a move that will retest its ATH. The divergence and EMAs are showing a good buying opportunity.

Apt Long Term Apt Long Term Liquidity analyse
Apt Long Term Liquidity analyse
Apt Long Term Liquidity analyse
Apt Long Term Liquidity analyse
Apt Long Term Liquidity analyse

jeffans: APTUSDT is targeting next goals and +32% after fill fwgjeffans: APTUSDT is targeting next goals and +32% after filling it's fwg 1d

APT: Channel UpTrade setup : Price is in an Uptrend, showing relative strength as it continues to advance even during an overall market correction. Bullish break above $15.00 resistance signals continuation of an Uptrend with +10% upside potential to $16.75 near-term. Stop Loss (SL) at $13.90.
Pattern : Price is trading in a Channel Up pattern. With emerging patterns, traders who believe the price is likely to remain within its channel can initiate trades when the price fluctuates within its channel trendlines. With complete patterns (i.e. a breakout) – initiate a trade when the price breaks through the channel’s trendlines, either on the upper or lower side. When this happens, the price can move rapidly in the direction of that breakout.
Trend : Uptrend across all time horizons (Short- Medium- and Long-Term).
Momentum is Bullish (MACD Line is above MACD Signal Line and RSI is above 55).
Support and Resistance : Nearest Support Zone is $13.00 (previous resistance), then $11.00. The nearest Resistance Zone is $15.00, which it broke, then $16.75 and $20.00.

APT (Y24.P1.Video1).Cup and Handle, or just parabolic?Hi Traders,
Here are my thoughts on what is taking place, what levels are worth taking a long and what assumptions I have to think these target levels are possible.
All the best,
S.SAri

APT (Y24.P1.E2) Potential parabolic or Cup&HandleHi Traders,
#APT has been going well and held up with the recent pulbback...it didn't.
Its at resistance and like RNDR, has the makings of a parabolic structure along with a potential cup and handle.
A pullback to the grey zone would be the handle for wave 4.
All the best,
S.SAri

DOWN WE GO 🎶🎵 LOL WHAT DO YOU THINK ABOUT $APTthe most realistic idea for the moment is double top 🗻🗻
here is why
cuz i think bitcoin is about to reverse, there are plenty of altcoins with the possibility of another up wave but aptos isn't one of them SORRY not sorry.

📊#APT reaches the staged resistance zone⚠️🧠From a structural point of view, we are in a bullish trend. We have reached the stage resistance zone and there is a risk of a correction. Remember to lock in profits in time or continue to look forward without risk.
➡️There are still long targets that have not been achieved at the daily level. If you want to participate in long transactions, it is best to wait for the price to return to the neckline buying zone again before looking for buying opportunities. The profit-loss ratio and winning rate are both excellent.
➡️I don’t know if I can be given such an opportunity. If I am given such an opportunity, I will participate. If I am not given such an opportunity, I will give up.
Let's see👀
🤜If you like my analysis, please like 💖and share it💬
💕 Follow me so you don't miss out on any signals and analyze 💯

APT bullish idea Apt is in clear uptrend but it's creating Trendline Liquidity below and which is good sniper Entry zone around 13-50-13.80.
Keep eye on it and do your analysis before taking any action.

🔥 SOLANA KILLER (APTOS) EPIC OPPOTRUNITY 🔥Hello guys .
Today I want to talk about one of the possible big opportunity for this upcoming altcoin season .
as you might guess on the title of the idea ; I want to analyzing APTOS which is also m favorite ALTCOIN to hold .
So let's jump straightly into the content :
before start , I like to mention that the technique for my TA is :
1_ first of all we are going to look at the APTBTC chart for check out how this coin gonna actually perform against BTC .
2_ then we looking at the APT against us dollar chart .
as you can see in the chart above APTBTC is under a very strong resistance which is now actually trying to act as a support level because price trying to break out from it and in the daily chart we close bullish candle above it .
Also the point is ; the more stronger the resistance is , breakout could be much more difficult and when price finally break from this kind of levels we will probably see a massive reaction to the up or down side .
so we could decide that this 300 days of resistance and sells pressure from this weekly resistance is finally over if we close a weekly candle above it .
now it's time to look at APT aginst us dollar chart :
in the weekly time frame APT currently broke out from a symmetrical trianle which is also a bullish pattern and we could say the possible short term target for APT is around previous all time high around 20$ which is a very possible price target .
but the intersting fact is :
in the APTBTC chart we are currently around 300% far from previous all time high but in the APTUSDT chart we just 40% far from the all time high ; by considering this information we could say the massive rally is around the corner for APT ; also this coin is fundamentally very strong and people in the solana space knows that APT is a very strong competitor for solana .
