✴️ Aptos Year-Long Lower High (Going Down)Aptos (APTUSDT) produced a major bullish wave in early 2023, more than 560% growth.
After the peak we had a prolonged correction, 10 months and finally a new bullish jump.
This jump is the current move which is signaling the end based on the following signals:
➖ Trading daily below EMA10 and EMA21.
➖ RSI bearish divergence since Oct. '23.
➖ Low volume on the rise.
➖ Recent double-top + rounded top formation.
➖ We have a lower high January 2024 compared to January 2023.
Lower highs can lead to lower lowers; Not necessarily but the potential is there.
👉 This one is going down based on the chart structure and early signals but, things can always change.
Namaste.
Market insights

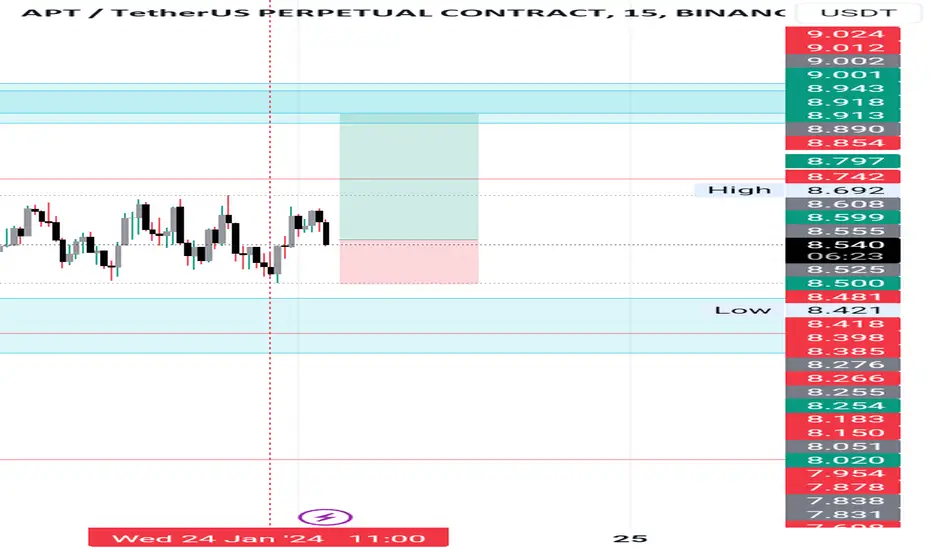
Apt long 🔥 My profit take is set at a price of 8.890. I believe the price is looking bullish, which means it is showing signs of upward momentum and potential for further gains. This positive price movement gives me confidence in my profit target.

Apt longI'll enter the market when there is a long and bullish pullback opportunity. I will take my 70% off the position at the 8.742 zone.
APT is going bullish if this scenario happenedfirst thing we need to see move up and break the ressistance of 8.70 $ and we see the first higher high if that happened then apt is goin bollish, first target will be 10.17$
this is my analyse it's not a recomandation to buy or sell !!


In mid big candle(APT)📊Analysis by AhmadArz:
🔍Entry: 8.186
🛑Stop Loss: 8.080
🎯Take Profit: 8.311 -8.418 -8.610 -8.742
🔗"Uncover new opportunities in the world of cryptocurrencies with AhmadArz.
💡Join us on TradingView and expand your investment knowledge with our five years of experience in financial markets."
🚀Please boost and💬 comment to share your thoughts with us!

APT NEW VOLUME INCREASEThank you for reading this update.
Depending on our study we see that APT has a good chance of volume increase.
This updates depending on day trade, And the market should confirm with time the right market way.
We did follow before more coins, and these coin seems to have an increase of break in the coming time.
#Nottradingadvice
#For Day traders take always profits when the market increase
#Expect nothing from the markets, but follow what it shows.
Apt longI recommend taking partial profits at regular intervals, such as every halfway point. The final take profit target is set at 8.255. Additionally, it is worth noting that the market structure has been broken on both the 15-minute and 1-hour timeframes.

APT ANALYSIS💥💥#APT Analysis 🚀🚀
🔮As we can see that there is a breakdown of trendlind in #APT. The breakdown below the support 1 indicates more bearish trend. 💸💸
👀Current Price: $7.7495
🚀 Target Price: $6.7594
⚡️What to do ?
👀Keep an eye on #APT price action and volume. We can trade according to the chart and make some profits. Stay tuned for further analysis and stay updated with market sentiments and news.⚡️⚡️
🏷Remember, the crypto market is dynamic in nature and changes rapidly, so always use stop loss and take proper knowledge before investments.
#APT #Cryptocurrency #TechnicalAnalysis #DYOR

Apt short term longThe price of Apt was declining, but then there was a break in the market structure, which signaled a long trade. I entered this trade because the risk-reward ratio looked favorable. My take profit zone is at 8.600.

$APT LongAfter I stopped with 0.5 profit on previous position, I saw a good manipulation.
So I shot another chance for a long.

APT Structure Turns To Bearish!!!APT changed its structure from bullish to bearish after making a double top with divergence and breaking HL, Now it will hopefully retest the current resistance for making new LH and go towards the target.
Entry: Cmp and 9.82
Tp: 8.39
Sl: 10.43

APT/USDT buy setup APT looking bullish for 25-30% move entry at DCA box stoploss below last swing low

APTUSDT - Trend reversal (Possible double top and retest EMA) There is visible trend reversal and possible double top and restest EMA with good risk reward ratio for shorting, what do you think?

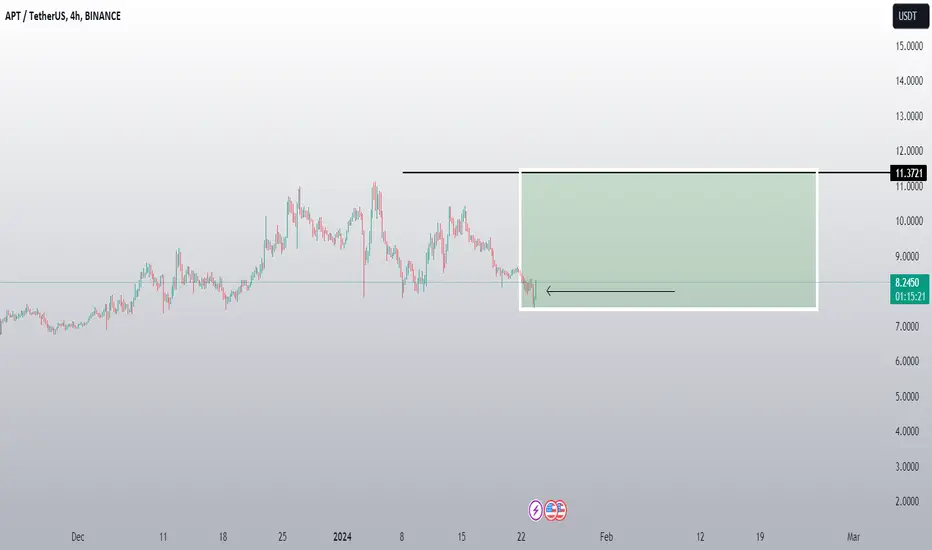
APTUSDT LONG POSITIONLONG POSITION
Signal Validity: 3D
Order Price: 8.59
TP: 12
SL: 7.58
Margin: 2% of the capital
Risk/Reward Ratio: 3.44
CROSS 3X-5X
Pay attention to the validity time of the signal from the time of publication. After the end of credit, if the order is not activated, delete the order.
See the results on the channel.


APTUSDT_N10APTUSDT
En: 9.1227-9.3900
Sl: 8.4784
Tp1: 10.3988
Tp2: 10.8648
Cancel if crossed without opening: 10.4171
#45Min_trade
#N10

I Cannot Short This !!! situation+next targets.Hi.
Time to break out of the rounding bottom on weekly & also above the key level.
AB=CD
✅Thank you, and for more ideas, hit ❤️Like❤️ and 🌟Follow🌟!

Long Setup, similar to $SUIThis looks an awful lot like the SUI play from yesterday. We had a false breakout on the 3rd attempt of a small descending channel or bullflag, with some POC support holding up the drops. We are making that third attempt at the breakout of the channel now on APT.
Mock Up Price Action for APT | Mid Term (12HR)Mock Up Price Action for BINANCE:APTUSDT | Mid Term (12HR)
- Watching and waiting for opportunities to enter short | Just Monitoring
Personal Approach & Base Chart Setup
- Stacked Parallel Channels for Grid of Confluence Points
- High Time Frame (HTF) Fib Extensions, Retracements, & Time Cycles
- Red Filled Horizontal Rectangles between areas of major Fib level from Extensions and Retracements
- Price Label Callout with Red Circle highlighting points of interest where I'd consider making a trade
- I will consistently monitor and adjust taking into consideration long/mid/near term price action and market conditions/news

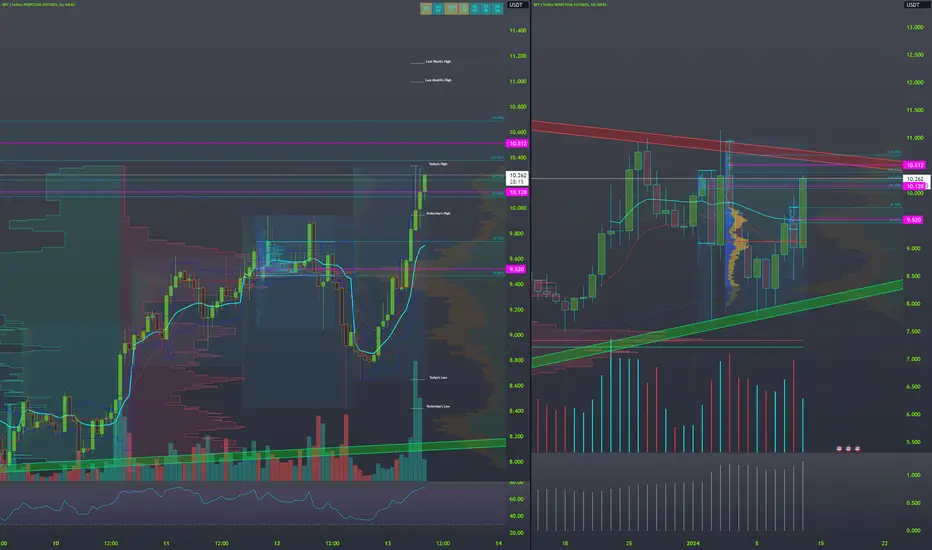
APT: Channel UpTrade setup : Price is in an Uptrend, trading in a Channel Up pattern. Swing Traders: can trade the Channel (enter near $8 support and exit near $11 channel resistance trendline), Stop Loss (SL) level at $7.40 (just below prior swing low and nearest support). Trend Traders wait for a breakout from Channel Up pattern.
Pattern : Price is trading in a Channel Up pattern. With emerging patterns, traders who believe the price is likely to remain within its channel can initiate trades when the price fluctuates within its channel trendlines. With complete patterns (i.e. a breakout) – initiate a trade when the price breaks through the channel’s trendlines, either on the upper or lower side. When this happens, the price can move rapidly in the direction of that breakout.
Trend : Neutral on Short-Term basis and Uptrend on Medium- and Long-Term basis.
Momentum is Mixed as MACD Line is below MACD Signal Line (Bearish) but RSI ~ 50 (Neutral). MACD Histogram bars are rising, which suggests that momentum could be nearing another upswing.
Support and Resistance : Nearest Support Zone is $8.00 (previous resistance), then $5.40. The nearest Resistance Zone is $10.00, then $12.50.
