AptusdtBroken downtrend..
Obv bullish structure
Macd flipping green htf
Like a 4x to yearly highs from here...
Market insights


APT/USDT Break the Descending channel. Ready to Upward Momentum?💎 APT has certainly piqued our interest. Following a period of reclaiming demand and undergoing consolidation, APT triumphantly breached the Descending channel, marked by substantial volume and a notable ascent.
💎 Currently, after a valid retesting phase, APT is advancing upwards, only to face stern resistance at a supply zone, leading to a significant rebuff. Now, APT is retracing its steps to the Demand area, gearing up for renewed momentum to challenge and potentially break through the Supply barrier.
💎 In this critical phase of the demand, it's imperative for APT to rally or form bullish rejection candles to sustain its upward trajectory and attempt a decisive breach of the supply constraints. If it manages to conquer the $6.33 supply frontier and secures a foothold above, APT probability could smoothly continue its bullish journey, reaching the anticipated bearish OB target zone.
💎 Conversely, should APT falter and fail to garner support at the demand junction, it risks forfeiting its stance and breaking lower. Under such circumstances, APT would be primed for a bearish turn, descending towards the support zone, and potentially retreating further to the foundational key support area.

#APTUSDT.P - HS POTANTIALI see a potential head and shoulder formation and open a short position. My target is the 5.40 band.
Good Luck ...
Not investment advice.

APT/USDT upward momentum? 👀 🚀 APT Today analysis💎 Paradisers, turn your focus to APTUSDT. The coin is showcasing a notable shift, having recently ascended past a descending channel, which amplifies the likelihood of a bullish trajectory.
💎 Analyzing its movement, the odds seem to favor the bulls. APTUSDT has commendably broken free from the descending channel, charting its course upwards. The primary scenario suggests that it might approach the supply zone at 5.3298. At this juncture, some novice traders might be tempted to initiate short positions.
💎 However, staying informed and ahead of the curve, if APTUSDT manages to surpass this supply threshold, the probability of it targeting the bearish OB becomes more pronounced.
💎 On the other hand, given the market's inherent unpredictability, should APTUSDT encounter a substantial pushback around the 5.2462 supply mark, there's a heightened likelihood it might find momentum from the demand zone.
💎 A descent below this demand threshold could pave the way for the coin to revisit its support levels. As always, strategic foresight and vigilance are key.

APT waiting for entry
APT has just broken the trendline since January 2023 (see screen-shot below), with at good candle (16% up).
I'll will wait for the retest of the range around $5.3-$5.4 to enter.
This area is a confluence of
The Fib 0.5 and Fib 0.6 (drawn for the today's candle of 16% raise)
The long-term trendline
EMA 50D
If prices come to this area, the proposed set-up is in chart.
Disclaimer:
This analysis is based on my personnal views and is not a financial advice. Risk is under your control.

Aptos to 3$ because it follows the bearsh line+ 10% unlock nextWe gained 40% in the past two days
The day RSI and the 4 RSI above the normal rate
We going to have a bad correction soon and once it is complete we going to face a 138 million unlock tokens
Forgot what cheers posting of apt going to 8$ and focus on fundamental news and technology we have
First a massive correction and second the 138 unlock millions tokens
Be careful

APT on the verge of breakoutAPT / USDT m
Price on the verge of breakout after multiple attempts before
If daily closed above resistance…full send

Aptos going to visit 2$ or 3$ Why I'm saying that apt going to visit 2$ or 3$
Because we have 138 million apt going to be unlock after 20 day , that's mean what!!
Go to Google and type apt unlock schedule if you don't believe it , soon the shorts going to dump it so be careful

APT long setupAptos is one of the big projects with huge potential to pump in the bullrun...
In this chart we see a deviation on the lows... Wait for retest of SSL... Then pump

Reversal Pattern, the Falling Wedge for potential longDaily Chart
Aptos has bounced back from the lower line acts a support in Falling Wedge
It's trading at 5.71x now
To complete this pattern, it needs to breakout and close above 6.15 before.
Wait for next move

Falling Wedge | Wait a BreakoutDaily Chart
Aptos has bounced back from the lower line acts a support in Falling Wedge
It's trading at 5.71x now
To complete this pattern, it needs to breakout and close above 6.15 before.
Wait for next move

$APE will pump soonBMV:APE is currently forming the perfect VCP pattern and breaking out and retesting #MA100. #MA100 is acting as the support level. Additionally, almost #altcoins pump right now because of #BTC ETF's new. So, BMV:APE has a huge chance to pump too.
Set the buy setup and wait:
Entry: $5
Target: 10-15%
Stoploss: 4-5%

Aptos The Crypto Exorcist AptosLabs, in partnership with NBCUniversal, conjured up a unique fan experience for the upcoming reboot of horror film classic, The Exorcist. Spine-chilling thrills take newer, immersive heights on Aptos!

My plan for APTUSDThere is my plan for BINANCE:APTUSDT
⛔"Daily crypto market analyses I provide are personal opinions & not financial advice. Trading carries risks, so do your own research & seek advisor's help.#DYOR"
Don't forget to like and comment

Good 12H closeI like where APT is. It dipped into monthly liquidity and has now put in a nice bullish structure on the LTF with this great 12H candle to pickup the lows. Targeting FVG above would put in on the breakout of the falling channel and we could see a move to fill the monthly FVG around 6.75. If that FVG turns into a bull flag in the zone... continuation.

APT long when breaking 4.92 resistance, very strong support, GPAPT potential long when breaking 4.92 resistance, very strong support at 4.7 targeting 4.92 resistance level. Also golden pocket at 4.9

APTUSDTHello snipers, on a one-day time frame, we see the price of APTUSDT close to the upper line of its long-term descending channel. If the price breaks and stabilizes, we can expect the price to rise to the upper resistances. nothing is impossible. Analyzing this is only a possibility and not a buy or sell.

#APT/USDT is forming bullish butterfly pattern and looking bulli#APT/USDT is forming bullish butterfly pattern and looking bullish in 4-Hour TF!
I am expecting a bullish momentum soon in $APT. The strong support level is PML $4.877. The local resistance level is PWH $5.225.

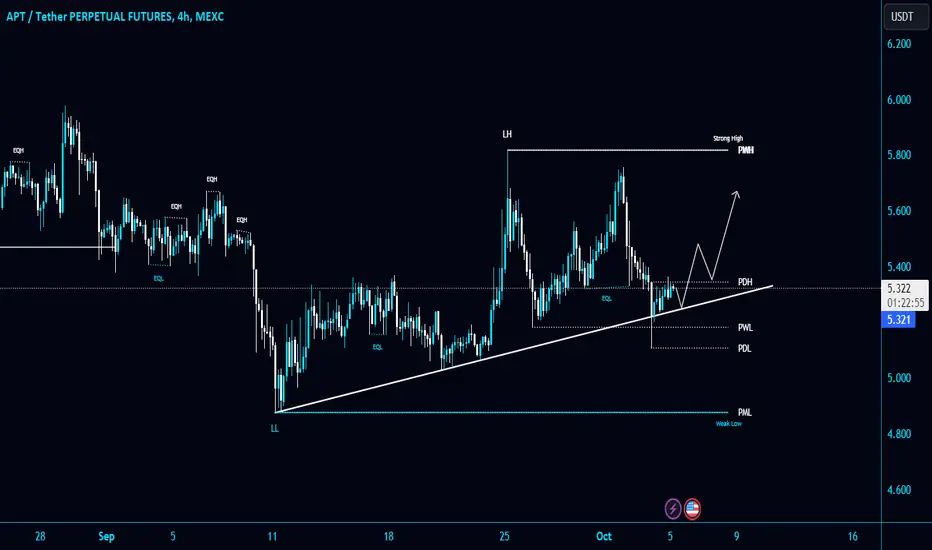
#APT/USDT is holding the Diagonal Trendline in 4-Hour TF!#APT/USDT is holding the Diagonal Trendline in 4-Hour TF!
AMEX:APT needs to clear PDH $5.340 to gain bullish momentum. Breakdown below the Trendline is a bearish sign.
APT SHORTJust like other altcoins, I believe APT coin will also fall due to Bitcoin's and the market's poor performance because there are no EMA or MA indicators below this level.

APT/USDT | 1d 👀When viewed from the point of view of the range, there is a deviation from above. Withdrawal of the liquidity pool. Then the natural demolition of the structure. we confirm the downward movement by forming new min/max.
✅ Stay updated on market news and developments that may influence the price of Aptos. Positive or negative news can significantly impact the cryptocurrency's value.
✅ Exercise patience and discipline when executing your trading plan. Avoid making impulsive decisions driven by emotions, and adhere to your strategy even during periods of market volatility.
✅ Remember that trading always involves risk, and there are no guarantees of profit. Conduct thorough research, analyze market conditions, and be prepared for various scenarios. Trade only with funds you can afford to lose and avoid excessive risk-taking.
#Crypto #Coins #Altcoins #Aptos #Trading

APT - accumulation in its last phaseAPT...
the hyped token of Jan 2023,
went for a correction in feb and march and first weeks of april...
its finally looking to finish the accumulation and looking to move towards new highs.
I am taking a long here...
I am looking for 25 - 27$ range.
