Will APT go lower again?Hi, how are you ? Today we want to have a review on APT.
After many ups and downs, from where I entered "Start of correction", this symbol has started to fall.
According to the time-price laws of the waves, we seem to be in a large and time-consuming diametric.
Upon further investigation, we found that we are now in wave e of this diametric and we expect to see the lower green box drop.
We also have a liquidity pool in the lower areas, which I have indicated with $$$. It is expected that this pool will be filled and the movement of the IFC will be balanced and we will reach the support of the green cadre.
For risk management, please don't forget stop loss and capital management
Comment if you have any questions
Thank You
Market insights


APTUSDT - we expect the price at the next resistance levelHello everyone! Let's analyze APTUSDT today. The chart shows the main support/resistance levels of the coin. Now we are testing an important resistance level again, but in addition, a trend line covers the coin from above, under which the price has been going for six months. Therefore, there are no reasons for the trend to break yet. So we are waiting for the price at the next resistance level in the area of 3.3.

$APT WHAT GOING ON?NOW I THINK AMEX:APT HAS A GOING TO WAVE B
OR
This could be WAVE 3 if it can breack B target
NFA

There could be one more potentially leg down on Aptos...' *Price Uber Allies* ' as Germans would say! Which means Price over Everything. We should not look at Fundamental Narratives & place our Trading/Investing Decisions as they more often than always put us on the wrong side of the Market. Price Action always leads ahead of any Fundamental News.
Anyways that's a topic for another day discussion.
TradingView has a very good feature so that anyone could publish Stock Ideas about a Particular Market. When I see latest ideas of Aptos right now all I see is just Bullish Setups (which I totally respect that & it could happen that this is the Final low at 5.4$ before we see it hitting all time Highs again. Don't get me wrong here these could be very smart, intelligent, sophisticated & talented people. They could be completely right about it but I just happen to very humbly disagree with them.
My main reason for disagreement is that when looked at the Long Term especially on Weekly's it still is in a Down-Trend. We just see it making a Lower Low every now & then. It becomes very important that you become Patient & not FOMO in because being Patience is key as so many good Traders say that you might already know that.
My Bearish Targets for Aptos is at 4$ because it is a Psychological level & this could be the real bottom.
When I'm wrong? My Bearish Outlook would certainly be confirmed if we see a sustained break below 5.4$ level also there is not a lot of backing of support so 4$ seems to me a very logical place it would fall. So as long as this KEY LEVEL at 5.4$ is being protected Bulls are certainly in control. There is a Brilliant Quote 'Bull Markets climb a wall of wary, while Bear Markets slide down a Slope of Hope' so maybe I might be wrong too here & all those Bullish Analysts are correct. Let's see it would certainly be quite interesting to see how things will look ahead especially we will get our another Monthly Candle close so more potential clues?
What do you think about my Bearish Outlook? Do you think I'm completely wrong here & overthinking a lot let me know if you can more than happy to hear what is going on in your head too. Thank you for reading all of this..😇

APT, Open interest rose by 100%. Something is going to happen APT, Open interest rose by 100%. Something is going to happen
watch video update

APT Dropped a lot after that OI Trap APT Dropped a lot after that OI Trap
I hope u saw previous video


APTAPT moving in a Descending triangle on 4 hour timeframe. On daily timeframe it's moving in a range and got a rejection from the resistance. High chances of breakdown. Keep an eye on.

APT S&R AllTime's>>>>>>>I Have Tried My Best to Bring the best Possible outcome in this Chart.
Based on the chart APT must support and pass 7.25USDT till APT price does not face more correct in lower support.
In longer time frame RSI move below in 30 LVL and buying for long term seem's not bad for 1 step,but we do entry in daily time frame correctin.
In short time must pass from 7.25 to recover and prepare for test 8.5-8.7 static resistance and mid term supply area resistance's.
All important resistance's in short-Mid -Long term marked on the chart.(scrool your mouse on the chart for more view area's)
It's Not a financial advise.
PLZ DYOR
With hopping success

Aptos Possible Playout ChartMicrosoft and Aptos Labs recently announced a promising partnership in the fields of blockchain and artificial intelligence, making significant strides in advancing technology for beginners to understand. The collaboration aims to support web 3.0 technology, revolutionizing internet usage, and contributes to the development of "Aptos Assistant," an artificial intelligence-powered tool to aid users in various tasks. This partnership holds the potential to reshape our technological interactions by enhancing internet security and efficiency through web 3.0, while also integrating artificial intelligence assistance into our daily lives, exemplifying how large companies are uniting to bring novel technology to our world.
The forecast for Aptos' price movement suggests a potential increase due to this sentiment. The target price movement for Aptos could reach $7.72, with a potential profit opportunity of about 6.62%. However, before reaching that level, Aptos needs to consider its resistance level at $7.43. If it successfully breaks through the $7.43 resistance, a movement towards the next resistance level may occur. Currently, Aptos is also positioned above its 100-day moving average, which could be interpreted as a sign of strengthening Aptos' price.

Aptos Possible Playout Chart The price of Aptos is predicted to experience a similar decline as other cryptocurrencies due to the current sluggish crypto market conditions and consolidation, as there are no new catalysts to drive the overall crypto assets. Aptos is currently trading at $7.54 and is in its consolidation range between $7.2 - $7.8. This consolidation range is likely to break, and APT may experience a decline based on the indication of a head and shoulder pattern, which suggests a weakening of the price. However, the HnS pattern has not been confirmed yet, so caution is advised.
Traders need to be watchful of the potential downturn at the $6.92 price level, which serves as the neckline support. If APT breaks below the $6.92 area, it is predicted to head towards the $5.93 area as the strongest support. At present, spot traders are better off adopting a wait-and-see approach. In terms of the RSI index, APT is currently at 18, indicating that it is already oversold, but on the other hand, APT has not reached its maximum support point yet.

Wave 3?Golden pocket of the Weekly Bullish Breaker restest (BOS), very bullish sign for APT, will the price go to the fib ext 1.618? 100usd per coin? What's going on onchain about this project.. something is cooking

solid APT long scalp Looks Bullish"Just witnessed a solid APT long scalp 📈! After a 78% retrace from the main breakout structure, the change on the 1TF is looking quite bullish 🚀💰 #TradingWins #BullishTrend #APT"

aptusdtThe descending channel has been broken and a pullback has been created. We see the possibility of 30% growth on this digital currency

APT +30% We noticed a falling trend line
Two days ago this trend was broken with a high volume
The trend has been retested, and I expect a huge rise in the two days
I apologize that my English is not good
Good luck to all
Did you like my analysis? Leave a comment, like, and follow to get more

Aptos - expected growth scenarioAs you can see on the chart, the price has long been pressed to the border of the descending channel and was waiting in the wings. Now the price needs to test the $6,7 - $7 level before going higher.
When the daily candle closes below $6.7, the scenario is canceled, I do not expect growth.

APTUSDT next few months ideas Here i have shared a quick ideas of APTUSDT based upon daily which is not a financial advice.

On the verge of breakoutAfter the previous pump ...
🔸Apt trying to breakout the descending channel and the 100 SMA on daily chart .
🔸I think it looks promising for midterm target would be 20$
🔸Iam waiting for breakout the crucial resistance at 7.5$
🔸Dont forget to support us with ur like , comment and follow for more ideas and updates.🎯

APTUSDT LONGAPTUSDT is still in its trading range. In my opinion, it can break the ceiling of its trading range and touch at least 9.20 . This move can be done without pullback or after pullback. Open your position after seeing the trigger.
tp:9.20

APT/USDT The Next Upward Incoming ?? 💎🚀 Aptos Analysis Today💎 Paradisers, brace yourselves for the trending coin!
💎Aptos has forged a partnership with Microsoft
💎 APT to surge and Break the falling wedge pattern, backed by impressive volume.
💎For the entry, We can entry now or wait for a retest on the support. Should APT showcase bullish indicators, such as a favorable candlestick pattern, we can anticipate a rebound and a continued ascent toward our target.
💎However, if APT struggles to maintain its stance at the support and breaches it, we might witness the price gravitating towards the bullish OB + Demand zone, potentially igniting a robust upward thrust.
💎Stay vigilant, as our bullish perspective would be challenged if APT descends past the 6.4 mark and settles below it. Trade wisely, ParadiseSquad! 🌴

Aptos bullish rally startedHello Traders,
This is a monthly chart.
APT (Korean giant) has woken up after a six-month correction.
The Microsoft News is the trigger.
People will short every green candle :D Look what happened last time :))
Please hit the boost button and follow me for more ideas.
Thanks

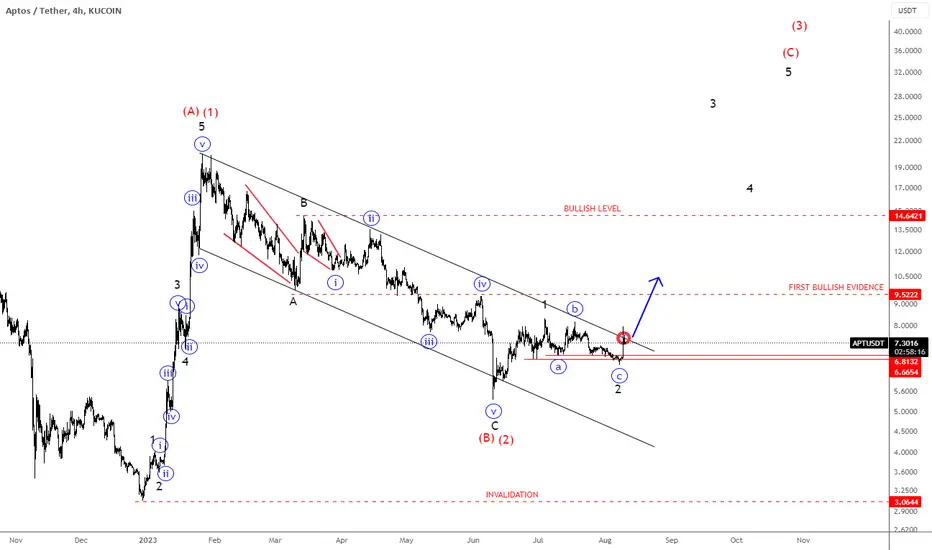
APTOS Bulls Ready?!Aptos Token Surges on Microsoft Partnership Ahead of APT Supply Unlock
Aptos with ticker APTUSD is waking up after a completed higher degree A-B-C correction in (B)/(2). Currently we can see it forming a lower degree bullish setup formation with impulsive wave 1, followed by a-b-c pullback in wave 2 that can push the price into the steepest wave 3 of a five-wave bullish cycle within higher degree wave (C)/(3). Just keep in mind that we still need broken channel resistance line decisively and 9.5 first bullish evidence level to confirm wave 3 of a five-wave bullish impulse.
Bullish confirmation is above 14 level, while invalidation level remains at 3.