ARB/USDT — Golden Pocket Re-Test: Big Momentum Ahead?🔎 Chart Overview
ARB/USDT (2D - OKX) is now at a critical decision point. The price is currently testing the Golden Pocket Fibonacci 0.5–0.618 (0.445–0.475 USDT), which also aligns with a Support-Resistance Flip (S/R Flip) from previous structure.
This area is not just another technical level; it’

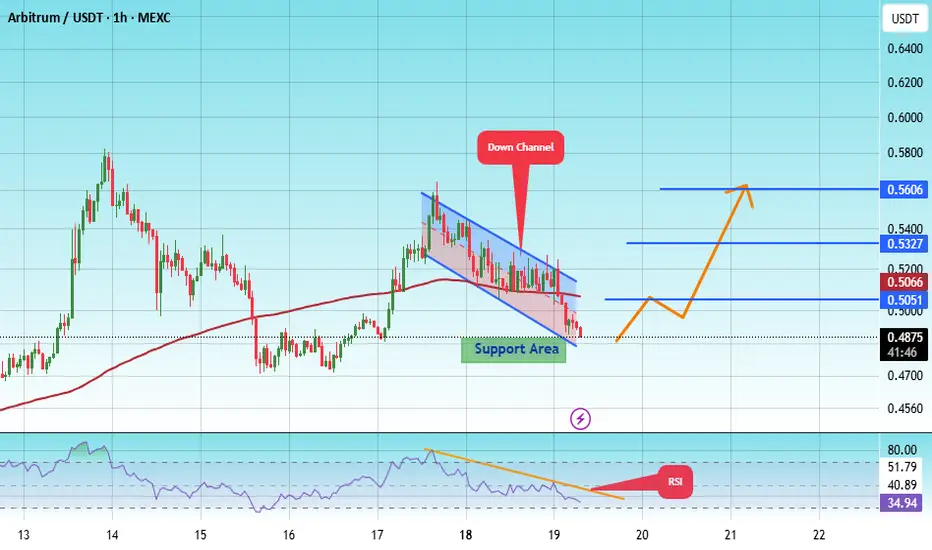
#ARB/USDT – Watching Key Support for Long Entry !#ARB
The price is moving within an ascending channel on the 1-hour frame, adhering well to it, and is on track to break it strongly upwards and retest it.
We have support from the lower boundary of the ascending channel, at 0.4880.
We have a downtrend on the RSI indicator that is about to break a
ARB/USDT – H1 Market Outlook Price is approaching a key OB supply zone after a strong bullish run.
From here, two scenarios could unfold:
1️⃣ Bullish Extension:
Break and hold above OB → target Strong High / Swing High near 0.5800.
2️⃣ Bearish Rejection:
Reject from OB → drop through FVG toward P1D High (0.5000) and possibly

ARB/USDT Swing Trading Plan
Current price: $0.522
Bullish Scenario (Breakout Play)
Entry: $0.53–$0.55 (confirmation above recent horizontal resistance)
Stop-loss: $0.48 (below recent swing low & breakout level)
Take Profit Targets:
TP1: $0.68 (previous high before breakdown)
TP2: $0.88 (mid-range supply zone)
TP3: $1.20–$1.25

ARB Main Trend 24 04 2025Logarithm. Time frame 1 week.
Previously a very hyped coin, "killer" of something there...
Now - the dominant opinion is that this is a scam, a scam, "whales are selling now", and so on. It's funny to look at all this and how the opinion changes with the price. Crypto is a mess, there are no other w

ARB/USDT BULLISH ON DAILY TIMEFRAME 150% POTENTIALBullish near-term path appears promising if ARB breaks through the $0.58 resistance—targeting $0.65–$0.70 in the next few weeks.
Support zone around $0.515–$0.52 is critical;
Mid-to-long term outlook varies:
Some long-term projections suggest ARB could reach $1.00+ if market conditions and adopt

ARB little trade and current situationfor a longer time I didn't look at BINANCE:ARBUSDT but well, here we are. jumped in at 47 cents 2 days ago - currently finding upwards support again and aiming for higher imho .
next levels to look at would be 66 cents (support from last bull) and 72 (50 fib level of last bull).
of course as wi


ARBUSDT to head to daily support before bounce to 0.75#ARB #ARBUSD #ARBUSDT AMEX:ARB
This is how I see #ARBUSDT playing out.
The price is pulling back right now and I see that it is likely that the price will land into daily support zone DS1.
The price is likely to bounce from DS1. However, we will monitor how it reacts when it taps into DS1 zone.

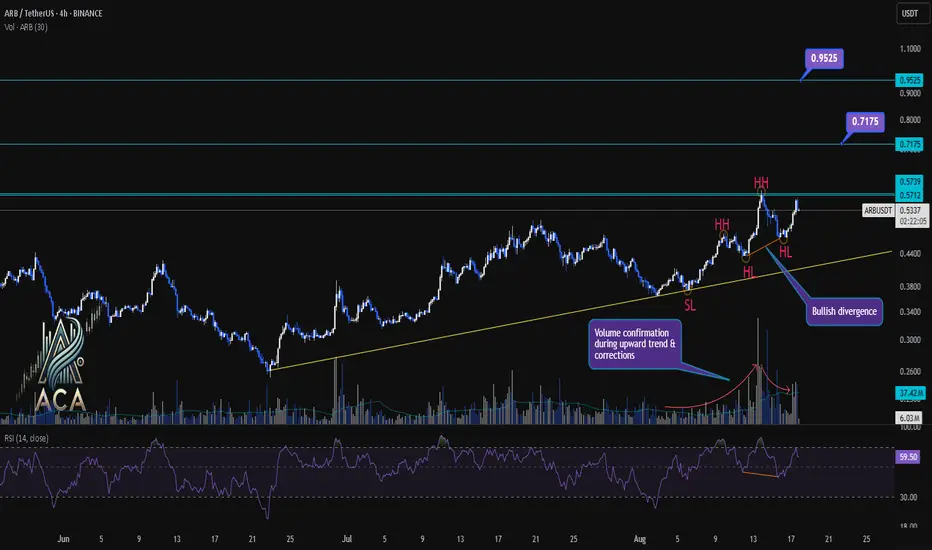
ARBUSDT 4H Chart Analysis | Trendline Integrity & Key TargetsARBUSDT 4H Chart Analysis | Trendline Integrity, Volume, Divergence & Key Targets
🔍 Let’s break down ARBUSDT on the 4-hour chart, spotlighting trend structure, swing plays, volume signatures, and momentum for precise trading setups.
⏳ 4H Overview
The chart shows ARBUSDT maintaining a solid uptrend
See all ideas
Summarizing what the indicators are suggesting.
Oscillators
Neutral
SellBuy
Strong sellStrong buy
Strong sellSellNeutralBuyStrong buy
Oscillators
Neutral
SellBuy
Strong sellStrong buy
Strong sellSellNeutralBuyStrong buy
Summary
Neutral
SellBuy
Strong sellStrong buy
Strong sellSellNeutralBuyStrong buy
Summary
Neutral
SellBuy
Strong sellStrong buy
Strong sellSellNeutralBuyStrong buy
Summary
Neutral
SellBuy
Strong sellStrong buy
Strong sellSellNeutralBuyStrong buy
Moving Averages
Neutral
SellBuy
Strong sellStrong buy
Strong sellSellNeutralBuyStrong buy
Moving Averages
Neutral
SellBuy
Strong sellStrong buy
Strong sellSellNeutralBuyStrong buy
Displays a symbol's price movements over previous years to identify recurring trends.