ARB (the strongest weekly candle what next ?)ARB / USDT
The Price printed the strongest weekly candle at horizon trendline after Series of downtrends such price action support the idea of being the bottom !
What next ?
Possible playout in coming weeks we see the price hit the recent high of December and after that if bulls continue showing their strength may hit the next target in my chart
Best wishes
ARBUSDT.P trade ideas

ARBUSDT - This was just the beginning.The upcoming wave will be directed toward all Ethereum-based tokens, with ARB being one of the most significant.
On the 3-day timeframe, you’ll notice it has broken the downward trendline with a giant bullish candle, signaling a trend reversal from bearish to bullish.
It has also formed an inverse Head & Shoulders pattern, a strong bullish signal.
While the long-term targets for this token are insane, I’ll settle for a $2 target—for now.
Best regards Ceciliones 🎯

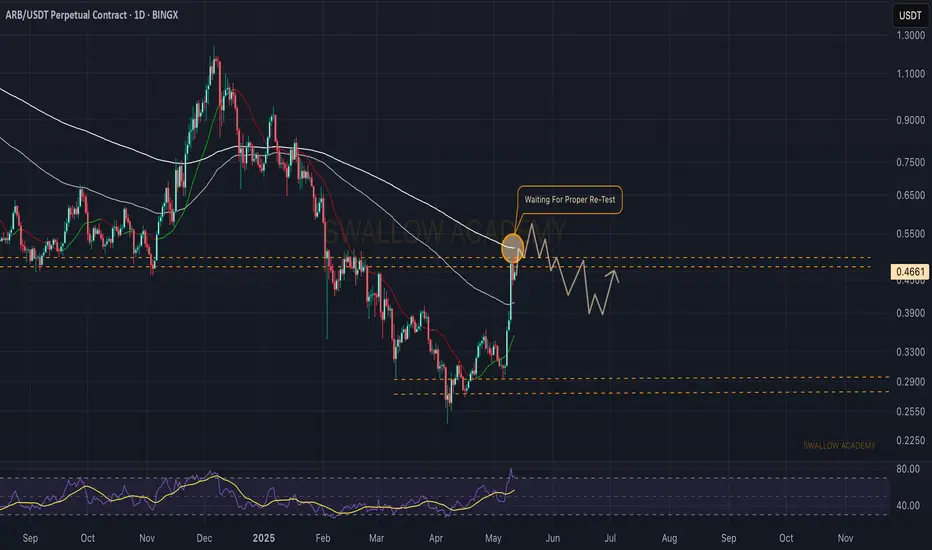
Arbitrum (ARB): Waiting For 200EMA | Rejection + Volatility ZoneARB coin has done well since last time, where the price is now approaching the 200EMA line, where last time we had a big volatility movement and liquidity hunting before a proper market structure break and movement to lower zones, so that's what we are looking for here again.
Swallow Academy
#ARB/USDT#ARB
The price is moving within a descending channel on the 1-hour frame, adhering well to it, and is heading for a strong breakout and retest.
We are experiencing a rebound from the lower boundary of the descending channel, which is support at 4050.
We are experiencing a downtrend on the RSI indicator, which is about to be broken and retested, supporting the upward trend.
We are looking for stability above the 100 Moving Average.
Entry price: 0.4436
First target: 0.4700
Second target: 0.4994
Third target: 0.5367

ARB/USDT 1-Day Chart – Downtrend Channel with a Bullish Twist!Arbitrum is playing out a textbook downtrend channel on the 1-day chart, and the structure is crystal clear!
We’ve been cycling through Accumulation → Rise → Distribution → Selloff, and right now, we’re in the Rise phase at $0.43. The price is climbing steadily after bouncing from the $0.35 support after breakout from Fallind Wedge within Selloff phase, and I’m eyeing a potential target of $0.66 — 0.618 Fib near the upper boundary of the channel!
This channel has been guiding ARB’s price action since late 2023, with each phase clearly marked. The current $0.35 level is a key support to watch — if it holds, this rise could have legs. But if we break below, the next accumulation zone might kick in. Let’s see if ARB can keep the momentum going and hit that $0.66 target!
Key Levels to Watch:
Support: $0.35 (current base of the rise)
Current Price: $0.43 (rise phase)
Target: $0.66 (0.618 fib near channel resistance)
What do you think, traders? Are we heading for $0.66, or will the downtrend channel strike back? Drop your thoughts below!

Good growth awaits him.After some time, it has turned from a downtrend to an uptrend.
Now you can have a buy step here, or wait for a correction to make an optimal buy.

ARB/USDT – Bullish SetupARB/USDT – Daily Trendline Break | Target: 2.40 🚀🔥
What’s up traders 👋
ARB (Arbitrum) is finally showing signs of life. After being suppressed under a long-term descending trendline, we’ve got a confirmed breakout on the daily chart — and that’s the signal we’ve been waiting for.
📉 Downtrend Broken – Momentum Shift in Motion
For weeks, ARB’s been stuck in a slow grind down — lower highs, lower lows, rinse and repeat. But that structure is now broken.
Price has closed above the daily trendline
Volume is starting to tick up
Candles are printing strong bodies, not just wicks — that’s a shift in sentiment
This isn’t just a bounce — it’s a potential reversal.
🎯 Trade Setup
Entry: At or around current levels (post-breakout)
Target: $2.40 — a major resistance zone and previous range top
Stop Loss: $0.23 — deep, but protects against daily shakeouts and confirms invalidation if hit
Yes, the stop is far — but that’s the price of playing a high-timeframe trend reversal. This is a position trade, not a scalp.
📌 Why It Matters
Daily trendline breaks don’t come often — and when they do, they usually mean business
Arbitrum is a major Layer 2 project — when the market turns, L2s tend to run hard
A reclaim of structure combined with bullish sentiment could fuel a strong move
💬 Are You Riding This Wave or Waiting on Retests?
Let’s talk setups — and if you’re in this trade, how are you managing risk?
#ARBUSDT #Arbitrum #Altcoins #CryptoTrading #DailyBreakout #TrendlineBreak #SwingTrade #PriceAction #BullishSetup

ARBUSDT | Long Bias | Descending Structure | (May 12, 2025)ARBUSDT | Long Bias | Descending Structure + Long Squeeze Setup | (May 12, 2025)
1️⃣ Short Insight Summary:
Arbitrum has been consolidating in a large descending triangle since early 2024. With spot selling pressure rising and shorts stacking in, this setup could build toward a classic short squeeze if the structure breaks upward.
2️⃣ Trade Parameters:
Bias: Long
Entry Zone: Around $0.36–$0.33
Stop Loss: $0.2193 (below key structure low)
TP1: $0.50
TP2: $1.00
Final TP: $1.24 (macro extension target)
Partial Exits: Suggested at $0.50 and $1.00 to manage risk and secure profits along the way
3️⃣ Key Notes:
✅ From January 2024, ARBUSDT has formed a broad wave structure that now compresses into a descending triangle or possibly a parallel channel, both suggesting a breakout is building.
✅ Open interest is increasing, and data shows more shorts than longs, making the case for a short squeeze if price holds above $0.33 and starts pushing up.
❌ Spot selling is still dominant, so caution is required—wait for reversal signals or strong wicks at the support zone.
✅ Bigger timeframes still lean short-biased, but that aligns well with our contrarian long entry plan.
4️⃣ Optional Follow-up Note:
Will monitor closely for either breakdown or breakout confirmation. If squeeze structure confirms, the rally could be steep due to overleveraged short positions.
Please LIKE 👍, FOLLOW ✅, SHARE 🙌 and COMMENT ✍ if you enjoy this idea! Also share your ideas and charts in the comments section below! This is best way to keep it relevant, support us, keep the content here free and allow the idea to reach as many people as possible.
Disclaimer: This is not financial advice. Always conduct your own research. This content may include enhancements made using AI.

ARB longRange lows reclaim, ichi cloud turning green on daily tf, all tfs on ichi cloud bullish. Big move coming?

Weekly trading plan for ArbitrumIn this idea I marked the important levels for this week and considered a few scenarios of price performance
The price is moving according to our plan and now in a local correction, but it may be only the 4th wave, so if the trend line and local resistance are broken, we may see further growth to our targets
Write a comment with your coins & hit the like button and I will make an analysis for you
The author's opinion may differ from yours,
Consider your risks.
Wish you successful trades ! mura

ARBUSDT 1D Analysis ARB ~ 1D Analysis
#ARB Buy back gradually from here if you still have confidence in this coin with a short term target of at least 15%++ from here.

Arbitrum (ARB): Multiple Good Risk:Reward Ratio Trades | SidewayArbitrum caught our attention with a possible BOS forming on smaller timeframes and a good sideways channel forming, which eventually we are looking to be broken, where we might be taking a sweet long position with some good R:R.
More in-depth info is in the video—enjoy!
Swallow Academy

Weekly plan for ArbitrumIn this idea I marked the important levels for this week and considered a few scenarios of price performance
Last week the price followed our main scenario, this week we expect to see local growth
Write a comment with your coins & hit the like button and I will make an analysis for you
The author's opinion may differ from yours,
Consider your risks.
Wish you successful trades ! mura

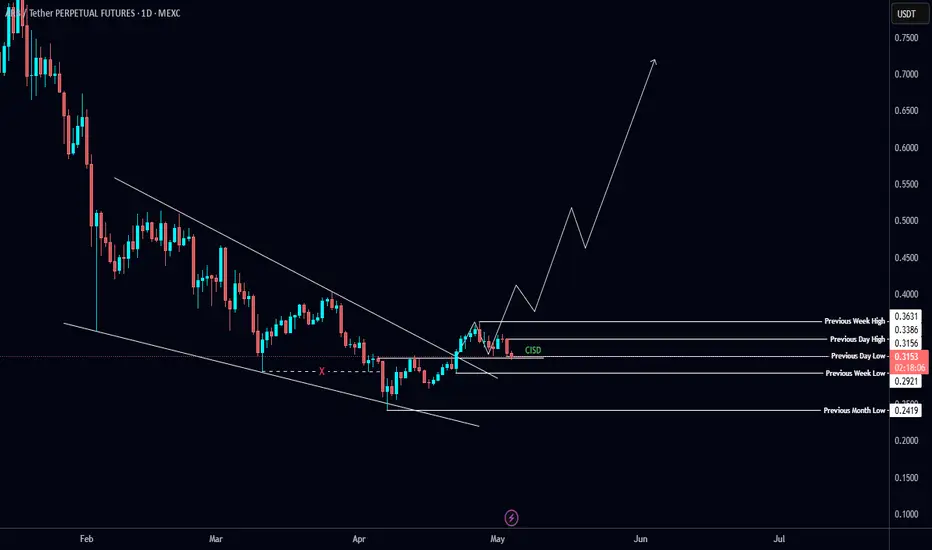
#ARB/USDT Update📊 #ARB/USDT Update 📊
AMEX:ARB breaks the Falling Wedge Pattern on the Daily TF—currently testing Daily CISD level, and looking good for swing long!
📈 Key Levels:
Resistance: PMH $0.3631
Support Level: PML $0.2419
#ARB/USDT#ARB
The price is moving in a descending channel on the 1-hour frame and is adhering to it well and is heading to break it strongly upwards and retest it
We have a rebound from the lower limit of the descending channel, this support is at a price of 0.3640
We have a downtrend on the RSI indicator that is about to be broken and retested, which supports the rise
We have a trend to stabilize above the moving average 100
Entry price 0.3730
First target 0.3890
Second target 0.4047
Third target 0.4266

Lingrid | ARBUSDT potential BREAKOUT. Long from SUPPORT zoneThe price perfectly fulfilled my previous idea . BINANCE:ARBUSDT is moving inside a clean upward channel, currently pulling back toward the 0.3175 support and trend-line after rejecting from the 0.3627 resistance. If buyers step in around trend-line support, the bullish structure could continue, pushing price back toward the top of the range.
📈 Key Levels
Buy zone: 0.3175 – 0.3200
Buy trigger: bounce from trend-line
Target: 0.3627
Sell trigger: break and hold below 0.3175
💡 Risks
Flag breakdown or failure at support may push price lower.
Loss of trend-line = structure invalidation.
Market-wide pullbacks could pressure ARB even with strong setup.
Traders, if you liked this idea or if you have your own opinion about it, write in the comments. I will be glad 👩💻

ARBUSDT Analysis D1ARBUSDT Descending Channel & Other Multiple Hurdles Has Already Got Cleared Arb Can Give Solid Bullish Rally In Coming Days

Global plan for ArbitrumIn this video I considered the global possible price movement, also made possible scenarios for the current week
At the moment the price is trying to grow, but it looks like a local bounce before the downward correction continues
Write a comment with your coins & hit the like button and I will make an analysis for you
The author's opinion may differ from yours,
Consider your risks.
Wish you successful trades! MURA

$ARB/USDT - Falling Wedge Breakout!🔸
🔸 Key Support Zone at $0.3414:
Price is retesting the broken falling wedge resistance, now acting as support. Holding this zone is crucial for bullish continuation.
🔸 Upside Target: $0.40+
After a successful retest, price can rally towards $0.40 and above.
🔸 Risk Level at $0.3340:
If price falls below $0.3340, the bullish structure will weaken.
🔸 Action Plan:
Monitor the $0.3414 zone closely. If a strong bullish confirmation appears (such as a bullish candle), we will open a long trade targeting $0.40+. Stop loss will be placed safely below $0.3040.

ArbBreakout is happening
Are you ready? Im am.
Wait for big return
Eth=arb
Daily and weekly is good for dip buy.

Arbitrum-ARBUSD Periodic Analysis-Issue 80 (Free Access)The analyst believes that the price of Arbitrum will decrease within the time specified on the countdown timer. This prediction is based on a quantitative analysis of the price trend.
___Please note that the specified take-profit level does not imply a prediction that the price will reach that point. In this framework of analysis and trading, unlike the stop-loss, which is mandatory, setting a take-profit level is optional. Whether the price reaches the take-profit level or not is of no significance, as the results are calculated based on the start and end times. The take-profit level merely indicates the potential maximum price fluctuation within that time frame.

ARB Weekly Reversal in Progress!
Arbitrum (ARB) is showing strong signs of a major reversal from its long-term downtrend on the weekly chart. After printing a rounded bottom and consolidating at key support, price is beginning to curve upwards — a textbook reversal structure! 📉➡️📈
✅ Current price: $0.34 💥 Anticipated breakout path targets:
🎯 T1: $1.60
🎯 T2: $2.35
🎯 T3: $2.90

#ARB/USDT#ARB
The price is moving within a descending channel on the 1-hour frame, adhering well to it, and is heading for a strong breakout and retest.
We are seeing a bounce from the lower boundary of the descending channel, which is support at 0.2460.
We have a downtrend on the RSI indicator that is about to be broken and retested, supporting the upward trend.
We are looking for stability above the 100 Moving Average.
Entry price: 0.2720
First target: 0.2850
Second target: 0.2954
Third target: 0.3095
