Destiny ARB Traders who are in profit should take their profits, as it has reached the upper boundary of the four-hour channel and the daily base, and is expected to experience a 30% drop in this currency.
ARBUSDT trade ideas

ARB Swing Long Idea - Arbitrum Analysis ARB is the leading Ethereum Layer 2 chain. We haven’t seen an ETH rally yet, so ETH-based coins (ETH betas) are currently underperforming. However, I would recommend considering a small position to potentially catch an ETH pump, as these ETH-based coins have significant technical potential.
Technical Analysis: The price took out the 2023 low and created new lows in 2024. It now appears to be building weekly bullish momentum by forming a weekly demand zone.
The daily structure also looks bullish. We recently broke and closed above the bearish trendline. I expect the price to retrace into the weekly demand zone, potentially retest the trendline, and then take off toward the first and second targets.
SL: 0.41
TP1: 0.83
TP2: 1.27


ARB correction is done and now we broke out of the Falling Wedge💰 AMEX:ARB correction is done and now we broke out of the Falling Wedge🔥
Pay attention to its compression at the end of the pattern and that RSI rounding bottom👀
As CRYPTOCAP:ETH recovered I am looking for its one of the best L2 project to rise as well!
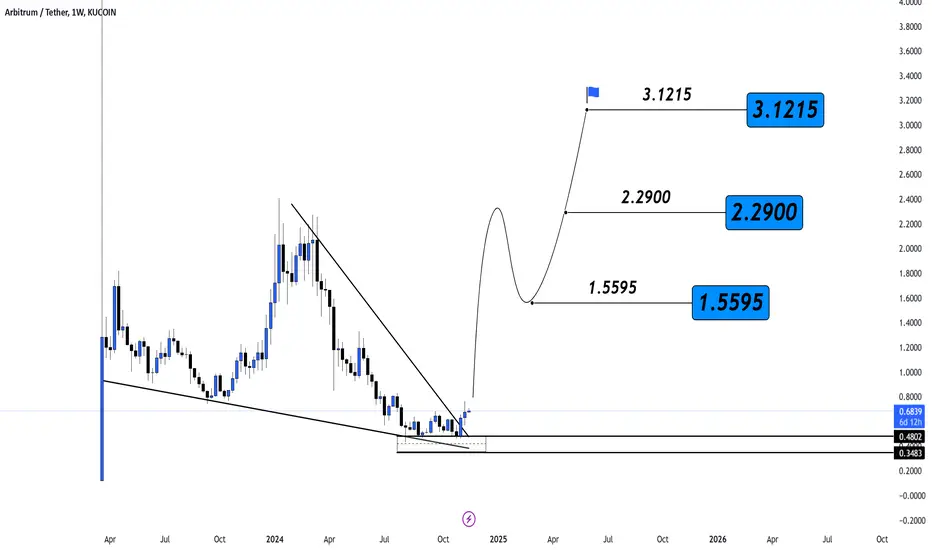
FULL SEND #ARB 🚀
🎯1 Target - 1.5595$
🎯2 Target - 2.2900$
🎯3 Target - 3.1215$
ARBUSDT Double Bottom Breakout Confirmed!BINANCE:ARBUSDT Technical analsysi update
ARB's price broke above the double bottom neckline resistance on the daily chart with high volume and has since retested this resistance level. A bullish move can now be expected from the current level. The price has also crossed above the 100 EMA on the daily chart, which is another bullish sign for ARB

#ARB/USDT#ARB
The price is moving in a descending channel on the 1-hour frame upwards and is expected to continue.
We have a trend to stabilize above the moving average 100 again.
We have a downtrend on the RSI indicator that supports the rise by breaking it upwards.
We have a support area at the lower limit of the channel at a price of
0.5700.
Entry price 0.5290.
First target 0.6113.
Second target 0.6346.
Third target 0.6583.

Technical analysis for $ARB/USDTTechnical analysis for $ARB/USDT
#ARB The chart shows a rounded bottom pattern, a strong bullish reversal indicator, suggesting a significant move to the upside.
T1: 1.2872 $
T2: 1.7888 $
T3: 2.2903 $

ARB to 2.5 $ arb bullish i think arb will reach 2.5 $ by the end of october or december
be patient and don't be greedy
this is my analyse it's not a recomandation to buy or sell !!


Alikze »» ARB | Expanded flat modification🔍 Technical analysis: Expanded flat modification
- It is moving in a downward channel in the weekly and daily time frame.
- The current corrective structure is completing a full 5-wave cycle.
- According to the structure, an expanded flat is being formed.
- This correction can enter an upward trend in the current area or a value lower in the range of 0.39 with the confirmation of the return, which can conquer and cross its previous major ceiling.
But in the short time frame of 12H, two behavioral scenarios can be considered to continue the process.
💎 Scenario 1: Keeping the green box, have a return to the neckline range.
💎 The second scenario: or if the green box area breaks, it will continue the downward correction to the range of 0.39.
»»»«««»»»«««»»»«««
Please support this idea with a LIKE and COMMENT if you find it useful and Click "Follow" on our profile if you'd like these trade ideas delivered straight to your email in the future.
Thanks for your continued support.
Best Regards,❤️
Alikze.
»»»«««»»»«««»»»«««
BINANCE:ARBUSDT

ARB Long Setup Setting / Targets and PlansBINANCE:ARBUSDT
COINBASE:ARBUSD
📈Which side you pick?
Bull or Bear
SL1 ---> Low-risk status: 1x-2x Leverage
SL2 ---> Mid-risk status: 3x-4x Leverage
(If there is just one SL on the chart, I suggest, low risk status)
👾Note: The setup is active but expect the uncertain phase as well.
➡️Entry Area:
Yellow zone
⚡️TP:
0.6409
0.6505
0.6605
0.6726
🔴SL:
0.5917
🧐The Alternate scenario:
If the price stabilize against the direction of the position, below or above the trigger zone, the setup will be canceled.

Will Arbitrum ARB reach $6 in 2025?Hello, Skyrexians!
Let's continue analyze different altcoins and try to calculate the potential gains in the bull market if it will happen. Today we have BINANCE:ARBUSDT - one the of top layer 2 in cryptocurrency market. Since March 2024 price has decreased significantly and broke the main "scam" support level. People now don't understand if Arbitrum is going to zero or we will see the significant gains on the bull run.
On the chart you can see ARB weekly time frame. After listing price pumped significantly, let's count this move as the wave 1. The further formation we cannot interpret as an impulse. The impulsive wave was only the last decrease, because it has clear 5 Elliott waves inside on the lower time frame. As a result, we can interpret all this move as irregular correction ABC, which forms the large wave 2. May be you tell that it's ugly, but sometimes corrective waves can have very unpredictable shapes.
As we can see the wave C inside 2 has been finished already with the bullish reversal bar on the Bullish/Bearish Reversal Bars Indicator . This bar is marked with the green dot. This is potentially very strong reversal sign, high chance to start the bullish phase from now. It's very important to break through the white line, the lips of Williams Alligator indicator and find support above it to trigger the increase. If this happens the next wave is wave 3 has the target area between $3.76 and $6.08. We assume that this target is going to be reached in 2025.
Best regards,
Skyrexio Team
___________________________________________________________
Please, boost this article and subscribe our page if you like analysis!

ARB looking a big gainhi every one
as you can see ARB is in main support area and trying to go up also breaks its dynamic resistance , as market is growing you can buy in this zones
ARBInteresting chart pattern for a pre-breakout situation. If possible for retracement, start bidding around the range of entry point. If price is strong and breakthrough trend line, don't open any position and wait for the next retracement

ARB with Exaado Technicalwe buy from 0.71$ - you can buy market now
and we target TPs on the board
i see we will hit All the targets

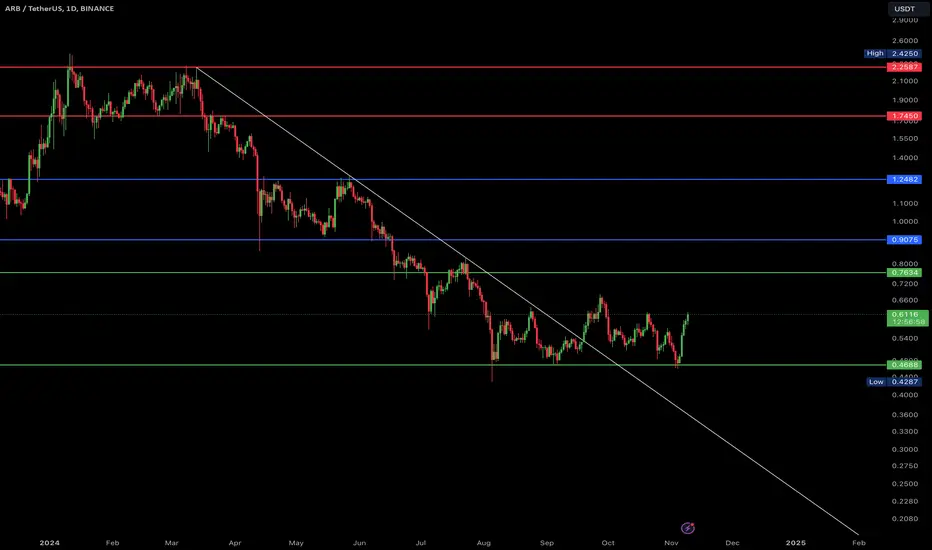
ARB 1D#ARB/USDT
⤵️ The price tested the major support at $0.45, dropped below the 50 EMA, and is now testing the support at $0.61.
💹 It has also formed a falling wedge, and if it closes the candle above the resistance, we can expect the next levels at $0.80 and $0.95.

Arbitrum (ARB)Arbitrum a highly anticipated project, is an Ethereum layer-two scaling solution that uses optimistic roll-ups to achieve its goal of improving speed, scalability, and cost-efficiency. There are not enough candles to see the big picture. But the short-term view is that there is a descending channel, and if ARB breaks it upward, an impulse wave can be expected. Let's see what happens.

ARB filling fire on the floorARB usdt pair shows a double tap on 0.465 lowest price in his history.
after that price show a grow to 0.53
in 30 min time frame ARB can grow to 0.56 0.6 and dailly target may touch 0.8
its just an idea for best results please search yourself
WELCOME Mr Trump and congratulation .

#ARB/USDT Analysis:📈 #ARB/USDT Analysis:
A falling wedge pattern has fully formed on the weekly chart for #ARB/USDT, signaling a potential breakout. Target levels are $0.9, $1.1915, $1.6625, and $2. Entry is recommended #upon confirmation of breakout, with stop-loss set below the wedge.

#ARB #Arbitrum #ARBUSD be waiting to recover.
#ARB #Arbitrum in my mind, waiting to recover likes other altcoins, BTW my 1st TP is around 0.8 or near EMA200 TF Day, and then 2nd TP is around 61.8% Fibonacci level at 0.16. Do not forget that this coin takes a top 3 on #ETH L2 fee or market share.

ARB / USDT 📍 #ARB / USDT
#ARB has formed a descending resistance on the daily timeframe💡. If we break above it, a strong upward move could follow, signaling bullish momentum in the #CryptoMarket✈️🚀.

ARBUSDTARB ~ 2D
#ARB Do you still have Conviction on this coin? If yes,. perhaps this support block will be an interesting purchase for now.

ARB longThis trading concept centers on ARB, the native cryptocurrency of the Arbitrum network, a Layer 2 scaling solution for Ethereum. Arbitrum has gained notable popularity for its ability to improve Ethereum’s scalability while lowering transaction fees. ARB is crucial for supporting decentralized applications by facilitating quicker and more cost-effective transactions. Its appeal stems from a robust developer community, growing adoption, and a widening range of use cases within the DeFi sector. Nevertheless, investing in ARB, like any cryptocurrency, exposes you to the highly volatile nature of the crypto market, where prices can be affected by various external factors such as regulatory shifts, technological advancements, and overall market sentiment. Effective risk management is essential when engaging in trades within this arena.
Disclaimer: This trading idea is intended for educational purposes only and should not be considered financial advice. Cryptocurrency investments are speculative and carry significant risk, including the potential loss of your entire investment. Always conduct your own research, evaluate your financial situation, and consult with a professional advisor before making any investment decisions. Past performance is not indicative of future results.
