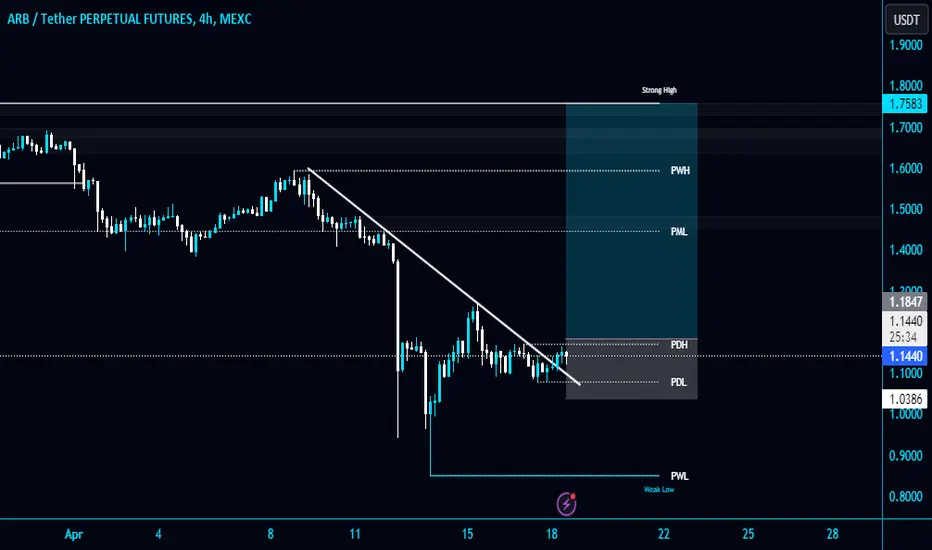
ARB 21/04/2024 Red box above is very important for me. It will determinate the direction. If we pass above it we can target MO, if not, we can consolidate below it. Because usually after a huge drop price either consolidate or takes the liquidity below.
ARBUSDT trade ideas

ARB Up To 26% ?!ARB has broken through the 1.16 level and is expected to find support in this area. After receiving support at this level, we can anticipate a move towards higher numbers with a potential breakout of the higher resistance at 1.236 (a breakout would be confirmed by a 4-hour candle closing above this price). The first target for this move would be 1.395, followed by a second target of 1.570, for a total R/R of 3.9.
Key Points:
Support: 1.16
Resistance: 1.236
Target 1: 1.395
Target 2: 1.570
R/R: 3.9
Please note that this is not financial advice, and past performance does not guarantee future results.

Keep An Eye On ARB/USDTDid you find this crypto market analysis helpful? Stay updated about the latest crypto market update. Please continue to follow my analysis and feel free to ask any queries, you may have. I am here to assist you. TradingView: @frmnCapital

short ARBARB broke through the ascending trendline after the failed attempt to break through the resistance level. A decline to $0.92 is expected to happen

#ARB/USDT breaks the Diagonal Trendline in 4-Hour TF!#ARB/USDT breaks the Diagonal Trendline in 4-Hour TF!
Wait for the PDH $1.171 resistance breakout to open a long position in $ARB. I am expecting a bullish momentum soon. The first local resistance level for #ARBUSDT is PML $1.447.
ARB Buy SignalLooks like ARB is going to finish its accumulation and ready for grow higher.
This is not a financial advice.

ARB - breakout happenedARB - breakout happened
Big oi accumulated in the middle of a range and after price broke it down
Look at the video that I shared few days ago where i share that breakout is going to happen

ARB - Oi dropped by 50% Best time to tradeARB - Oi dropped by 50% Best time to trade
In a video, I shared with you an ARB example when after a Big liquidation price bottomed
in the case of taking LOw $0.845 - that would be the best place to take LONG
watch full update in video

ARB inteligentasset#ARB
Bullish scenario
Resistances 1.33, 1.54 in 200 ema, 1.61 in 50 ema, 1.69
Bearish scenario
Supports 1 lower limit channel, 0.85 pivot low, 0.767

ARB final waveBullish Div daily tf, counting elliot, current wave 1-3 with 123% the goal is to hit 3$.
retest on the previous ath

ARB UPDATE (1D)This is an update to the analysis you see in the "Related Ideas" section
The previous scenario is still valid.
We have a large diametric that we are in wave D of which we also reached the green range of the previous analysis and the price reacted to this support range.
But the point is that the time of the D wave cannot end so soon.
From the specified supply, we expect a downward price rejection.
Between the two vertical lines on the chart (on August 24 to September 25), wave D can end and the price can enter bullish wave E.
Closing a candle above the invalidation level will violate the analysis
For risk management, please don't forget stop loss and capital management
Comment if you have any questions
Thank You

ARB targets scalpingLooking at the data we could see a short term target for ARBUSD as shown on the chart i i have included entry points we can enter on the retest zone with a stop loss on 5% bellow the .618 as for a failed analysis. Always looking forward for feedback wish you best of luck

Swing the sickle -- ARBAfter BTC failed to break through 71000 for several days, accompanied by sudden geopolitical issues, the crypto market began a violent callback. BTC remains near 65000 after slight rebound. ETH touched 3000. The average correction of Altcoin remains above -20%. There is no doubt that most tokens have fallen into decline.
After the Dencun upgrade, possibly due to sell the news, L2’s token began to decline. ARB we are talking about today is one of them. Arbitrum has the most competitive ecosystem in the crypto field, with real activity and TVL almost second only to ETH. However, as the market bulls are consumed and the unlocking continues, the token’s recent performance has not been good. One day later, ARB will again unlock tokens equivalent to 3.5% of the circulating supply.
Judging from the indicators, after maintaining a bullish trend for nearly three months. The TSB indicator prompted a SELL signal on March 24. We can see that before this, ARB maintained a wide range of fluctuation. After the SELL signal appeared, it was almost difficult for ARB to return to the high point, and began to break through the lower rail of the range downward, confirming that it had entered a downward trend. Judging from the current situation, ARB will continue to maintain its bearish trend.
Introduction to indicators:
Trend Sentinel Barrier (TSB) is a trend indicator, using AI algorithm to calculate the cumulative trading volume of bulls and bears, identify trend direction and opportunities, and calculate short-term average cost in combination with changes of turnover ratio in multi-period trends, so as to grasp the profit from the trend more effectively without being cheated.
KDMM (KD Momentum Matrix) is not only a momentum indicator, but also a short-term indicator. It divides the movement of the candle into long and short term trends, as well as bullish and bearish momentum. It identifies the points where the bullish and bearish momentum increases and weakens, and effectively capture profits.
Disclaimer: Nothing in the script constitutes investment advice. The script objectively expounded the market situation and should not be construed as an offer to sell or an invitation to buy any cryptocurrencies.
Any decisions made based on the information contained in the script are your sole responsibility. Any investments made or to be made shall be with your independent analyses based on your financial situation and objectives.

ARBUSDT ARBUSDT is showing bullish divergence , buy on breakout of Last LL which shows potential HH
Risk managed below its last lows

ARB: bullish with halving📊Analysis by AhmadArz:
🔍Entry: 0.8205
🛑Stop Loss: 0.6362
🎯Take Profit: 1 -1.15 -1.36 -1.50 -1.72 -1.89 -2.08 -2.21
🔗"Uncover new opportunities in the world of cryptocurrencies with AhmadArz.
💡Join us on TradingView and expand your investment knowledge with our five years of experience in financial markets."
🚀Please boost and💬 comment to share your thoughts with us!

Long-Term ARB Coin Analysis! Where Will We Buy?#ARB
We believe that unless ARB coin closes daily candles above the resistance level of $2.165, it will initiate a downward movement. However, for it to experience a decline, it first needs to break below the support of $1.933, followed by daily candle closures below the $1.743 support.
For ARB coin, our areas for spot buying are as follows: $1.544 - $1.409 levels (Blue lines). If a downturn occurs to our buying zones, we will invest for the long term. If the price continues its upward trend without reaching our buying zones, we will cancel the analysis.
However, our buying orders will be placed at $1.544 - $1.409 levels unless it surpasses the resistances of $2.165 - $2.42.
WAGMI
NFA

ARBITRUM - POTENTIAL $3 AFTER THIS RETRACEMENT
I am expecting a bounce from here on BINANCE:ARBUSDT since I am also confident that we are in a wave 3-cyan whereby the wave 4-yellow is almost in completion after the liquidity below is grabbed.
The invalidation level is clearly on the chart and a clean minimum of 3 risk reward presents itself if this plays out.
PREVIOUS ANALYSIS
OTHER ANALYSIS

ARB/USDT Short IdeaAfter rejecting 1.3, a big bearish OB was created.
Expecting retest of 0.86.
This is not financial advice.

ARB/USDT have some nice zones to buy I want to share with you a few zones to buy Arbitrum in case the correction continues and bitcoin continues its downward movement.
These zones are where I expect to see buyer action.
These buy zones are most likely better suited for long term hodlers and those who have not yet gotten into the market and are waiting for some reasonable prices to buy.
First one is in range 1.05-1.15$.
Second one is 0.80-0.82$.

#ARB Really good Spot Opportunity 😎#ARB Really good Spot Opportunity 😎
We are now on really important and strong support zone.
Plus we got bullish divergence

ARB. Searching for returns.ARB experiences a decline of more than 50% within 35 days - that's quite a lot. Taking into account the Fibonacci levels, you can see where the bounce may be. RSI in oversold zone.

ARBUSDT Elliott wave countEnding diagonal wave ((c)) of 2 is preferred status for this price action.
We are watching for evidences and clearing wave (4) 1.5915 will increase the chance to turn the price up.
Price reached at a key support level, 0.618 fib retracement of wave 1.
Also a possible oscillators indicators divergence at this level.

ARB UPDATE (6H)ARB appears to be forming a large diametric that has now entered wave D.
From the green range it is expected to support and start the bullish wave E.
We consider such a pattern and path for ARB.
Closing a daily candle below the invalidation level will violate the analysis
For risk management, please don't forget stop loss and capital management
When we reach the first target, save some profit and then change the stop to entry
Comment if you have any questions
Thank You
